Wolfram Function Repository
Instant-use add-on functions for the Wolfram Language
Function Repository Resource:
Quickly cluster a point cloud by recursive separation
ResourceFunction["PrincipalAxisClustering"][{{p11,p12,…},{p21,p22,…},…}] recursively partitions the given points into approximately equal-sized clusters along their principal axis. | |
ResourceFunction["PrincipalAxisClustering"][points,n] partitions points into at most n clusters. |
Cluster one-dimensional data:
| In[1]:= |
| Out[1]= |
Find exactly four clusters:
| In[2]:= |
| Out[2]= |
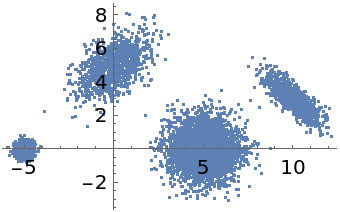
Cluster vectors of real values:
| In[3]:= |
| Out[3]= |
Partition a 3D point cloud:
| In[4]:= |
| Out[4]= | 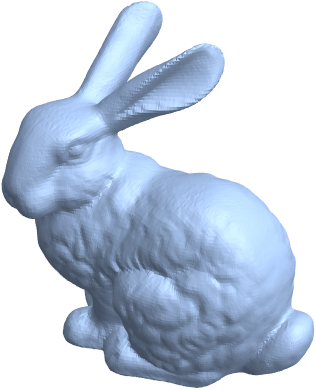 |
| In[5]:= |
| Out[5]= | 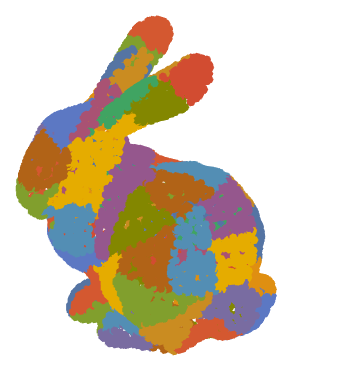 |
Cluster high-dimensional data:
| In[6]:= |
| Out[6]= |
Downsample a large point cloud by choosing nicely spaced representative points:
| In[12]:= |
| In[13]:= |
| Out[13]= | 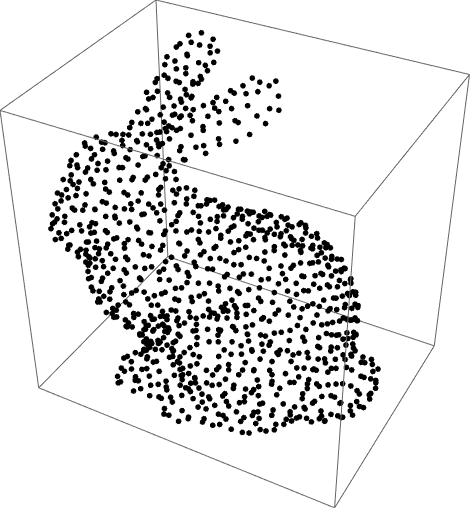 |
Compare to random sampling:
| In[14]:= |
| Out[14]= | 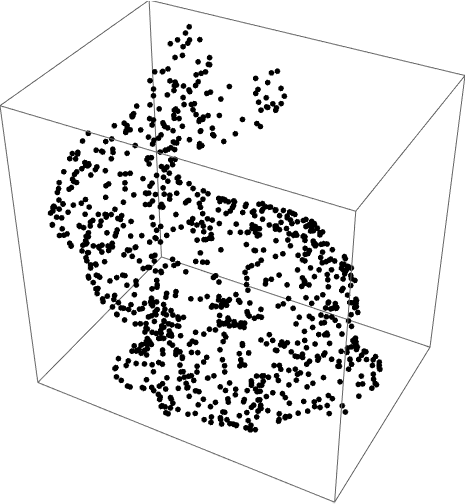 |
The axis representing each cluster separation corresponds to the first component in PrincipalComponents:
| In[15]:= |
| In[16]:= |
| Out[16]= | 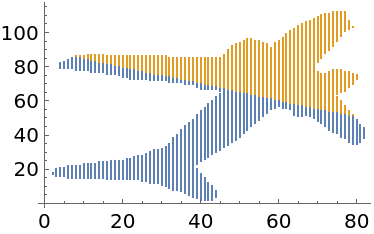 |
| In[17]:= |
| Out[17]= | 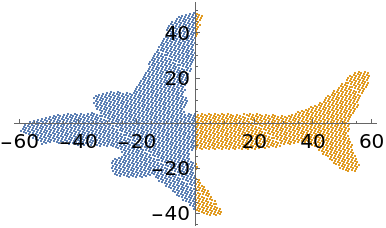 |
The principal axis can be obtained from the Eigenvectors of the Covariance matrix:
| In[18]:= |
| Out[18]= |
Visualize the axis over the original data:
| In[19]:= |
| Out[19]= | 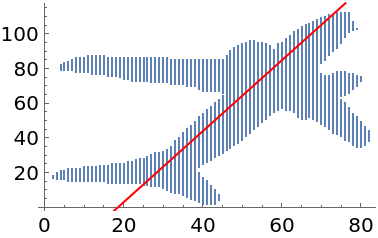 |
Projecting the standardized points onto the principal axis gives scalar values that indicate which cluster they belong to:
| In[20]:= |
| Out[20]= | 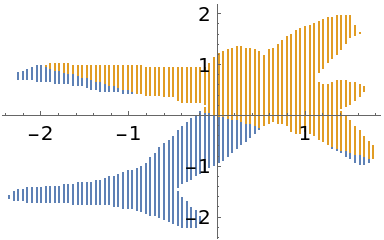 |
PrincipalAxisClustering finds clusters very quickly:
| In[21]:= |
| Out[21]= |
| In[22]:= |
| Out[22]= |
Compare to FindClusters:
| In[23]:= |
| Out[23]= |
PrincipalAxisClustering gives clusters that better represent the local point cloud density:
| In[24]:= |
| Out[24]= | 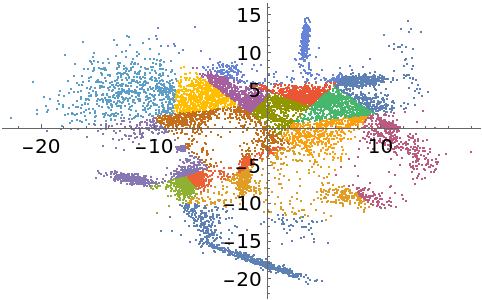 |
FindClusters represents better separation of the data:
| In[25]:= |
| Out[25]= | 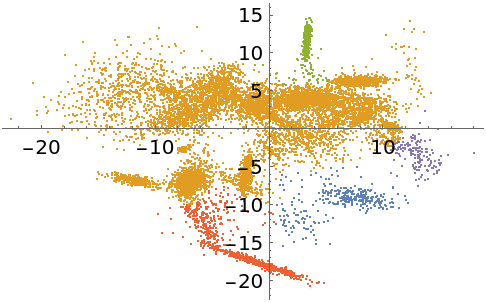 |
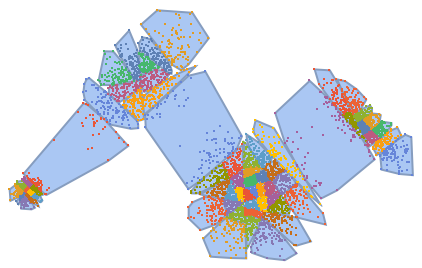
PrincipalAxisClustering partitions points into non-overlapping convex regions:
| In[26]:= |
| In[27]:= |
| Out[27]= | 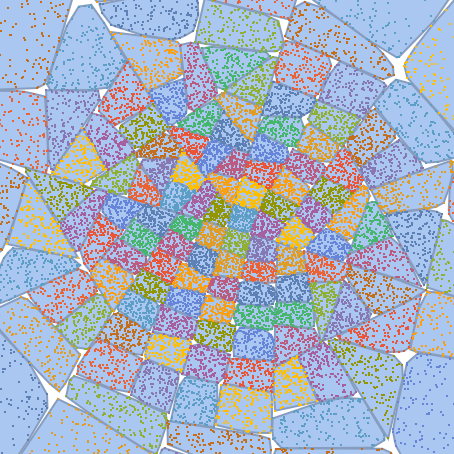 |
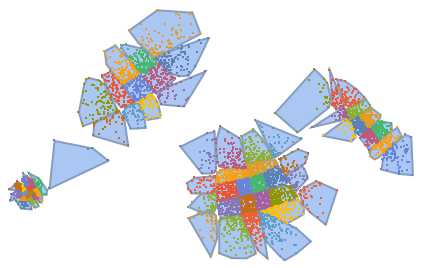
The number of clusters locally scales with the point cloud density:
| In[28]:= |
| Out[28]= |  |
| In[29]:= |
| Out[29]= |  |
If the number of requested clusters is not a power of 2, then cluster sizes will not be well balanced:
| In[30]:= |
| In[31]:= |
| Out[31]= |
| In[32]:= |
| Out[32]= |
Visualize the recursive nature of the clustering:
| In[33]:= |
| In[34]:= |
| In[35]:= |
| Out[35]= | 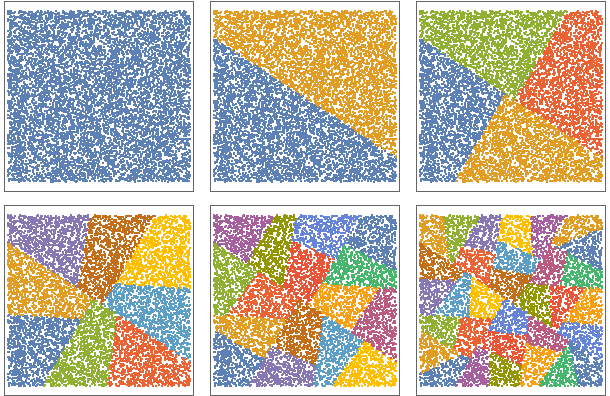 |
Partition a point cloud into clusters:
| In[36]:= | ![(* Evaluate this cell to get the example input *) CloudGet["https://www.wolframcloud.com/obj/4b531bfe-a45c-49ef-95d0-bf0b530cdd54"]](https://www.wolframcloud.com/obj/resourcesystem/images/fe8/fe81a78d-17a0-4b7d-be0f-0cb165c36459/2e24cdb3ec409347.png) |
| Out[36]= | 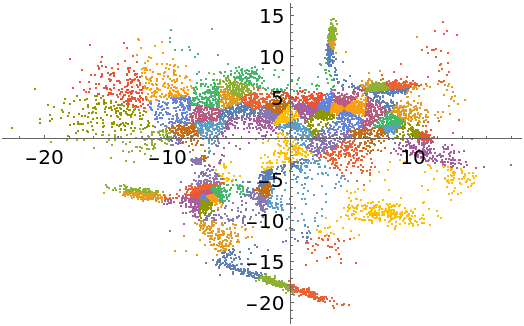 |
Remove some outliers from each cluster:
| In[37]:= | ![filterOutliers[cluster_, q_] :=
Module[{m, d, t},
m = Mean[cluster];
d = Norm[# - m] & /@ cluster;
t = Quantile[d, 1 - q];
Pick[cluster, # < t & /@ d]
];](https://www.wolframcloud.com/obj/resourcesystem/images/fe8/fe81a78d-17a0-4b7d-be0f-0cb165c36459/1cd74447ca2a94cc.png) |
| In[38]:= |
| In[39]:= | ![expand[cluster_, s_] :=
With[{m = Mean[cluster]},
m + s (# - m) & /@ cluster
];](https://www.wolframcloud.com/obj/resourcesystem/images/fe8/fe81a78d-17a0-4b7d-be0f-0cb165c36459/0c1a6e3c146cc130.png) |
Construct a parameterized topological representation of the point cloud:
| In[40]:= |
| Out[40]= | 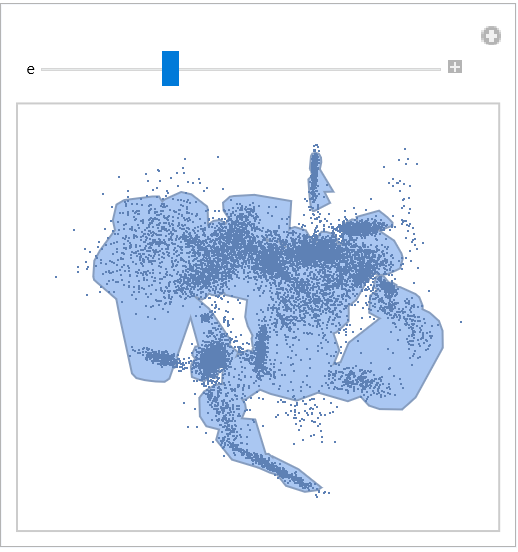 |
This work is licensed under a Creative Commons Attribution 4.0 International License