Wolfram Function Repository
Instant-use add-on functions for the Wolfram Language
Function Repository Resource:
Plot a polar tree map of a given nested list
ResourceFunction["PolarTreemapPlot"][list] generates a polar treemap plot of a tree-like structure list. |
| Background | White | specify what background color to use |
| ColorFunction | Automatic | applies a given color function f[path,area,{rad1,rad2}] to the arc sectors |
| ImageSize | 500 | specify the size of the resulting graphic |
| "TooltipFunction" | Automatic | applies a tooltip function f[path,area,{rad1,rad2}] to the arc sectors |
| "SortSectors" | True | whether to leave arc sectors in their original ordering or sort by area |
Plot simple polar tree map:
| In[1]:= |
| Out[1]= | 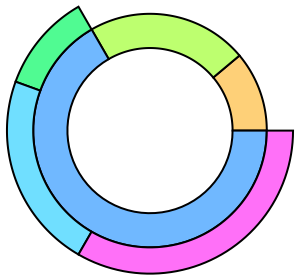 |
Compare a polar tree map to other tree visualizations:
| In[2]:= | ![t = {{1, {1, 2}, 3, 4}};
ResourceFunction[
"PrettyGrid"][{{"PolarTreemapPlot", ResourceFunction["PolarTreemapPlot"][t, ImageSize -> 150]}, {"ExpressionGraph", ExpressionGraph[t, VertexLabels -> Automatic, ImageSize -> 150]}, {"ExpressionViewer", ResourceFunction["ExpressionViewer"][t]}}\[Transpose], Spacings -> {2, 2}]](https://www.wolframcloud.com/obj/resourcesystem/images/d17/d17a7c3f-351b-4de5-9562-73f9150bafb8/3fa3890769979d18.png) |
| Out[3]= | 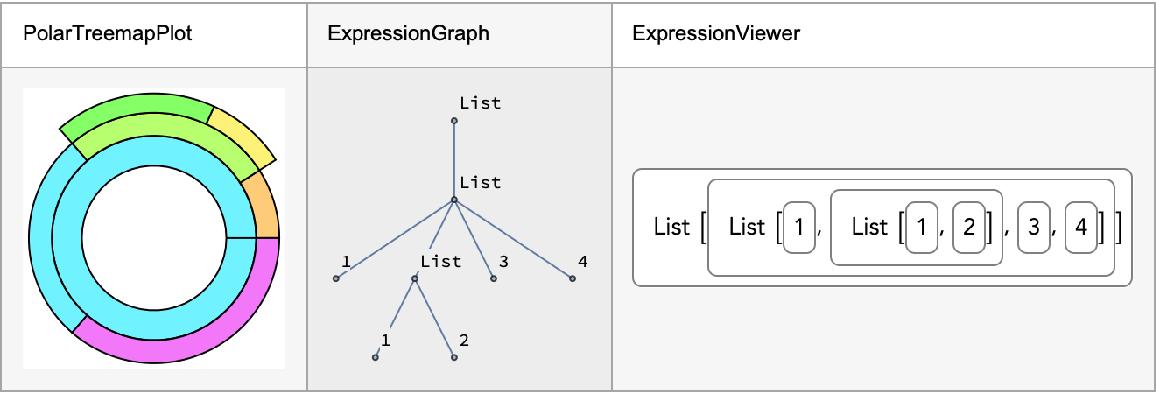 |
Plot random polar tree maps of varying depths:
| In[4]:= | ![trees = {{1, 1}, {{1, 2}, 3, 4}, {1, {{1, 1}, {1, 1, 1}}}, {1, 2, 6, 4, 8, 2, 1, {1, {1, {2, 1}}}}, {1, {1, 2, {1, {{1, 1, 1, 1, 1, 2, 5}, 1, 2, 1, 1}, 2}}, 5, {1, {1, {2, 1}}}}};
Row[Labeled[
ResourceFunction["PolarTreemapPlot"][#, ImageSize -> 50*Depth[#]/2], Row@{"Depth ", Depth[#]}] & /@ trees, Spacer[20]]](https://www.wolframcloud.com/obj/resourcesystem/images/d17/d17a7c3f-351b-4de5-9562-73f9150bafb8/4c34f3b149bad3ac.png) |
| Out[5]= | 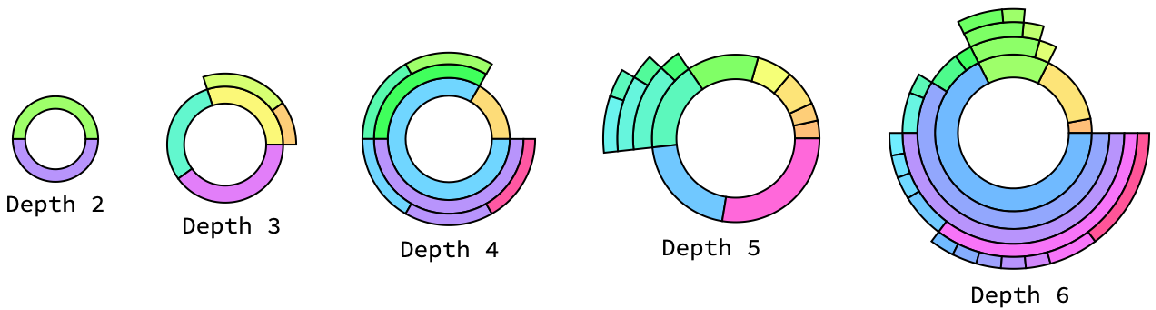 |
Tooltips (displayed by default) show both the path from the root to the selected node and the area of its subtree:
| In[6]:= |
| In[7]:= |
| Out[7]= | 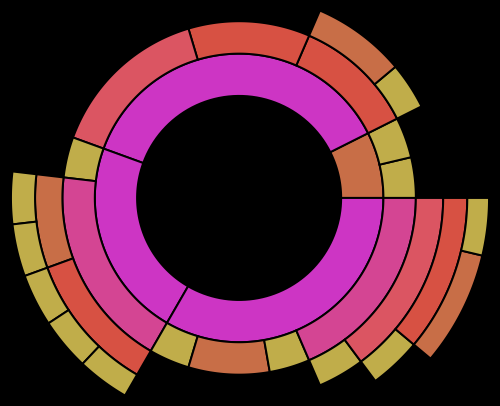 |
Set the resultant image size and use a custom color function:
| In[8]:= | ![cf = (Which[#2 < 1, Black, #2 < 2, Gray, True, ColorData["DeepSeaColors"][
Rescale[Mean[#3], {0, 2 \[Pi]}, {0, 1}]]] &);
ResourceFunction[
"PolarTreemapPlot"][{{1, 1}, {{1, {1, 1}, {{1, 2}, 3, 4}, {1, {{1, 1}, {1, 1, 1}}}, {1, 2, 1, {1, {1, {2, 1}}}}}, 3, 4}, {1, {{1, 1}, {1, {1, {{1, 1}, {1, 1, 1}}}, 1}}}, {1, 2, 1, {1, {{1, {{1, 1}, {1, 1, 1}}}, {2, 1}}}}}, ImageSize -> 250, ColorFunction -> cf, Background -> None]](https://www.wolframcloud.com/obj/resourcesystem/images/d17/d17a7c3f-351b-4de5-9562-73f9150bafb8/6c81cf22adc51213.png) |
| Out[7]= | 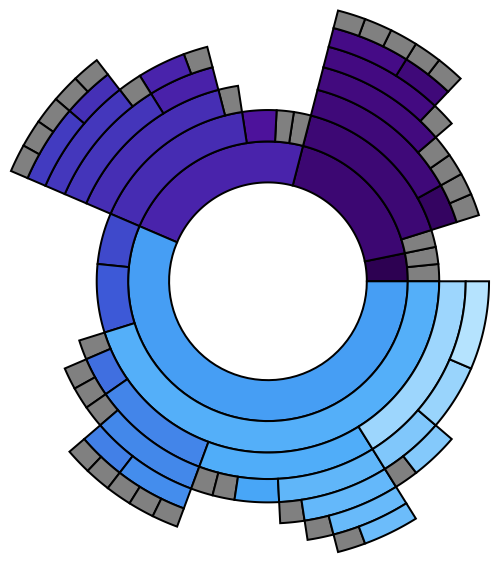 |
Set a custom tooltip function:
| In[9]:= |
| Out[7]= | 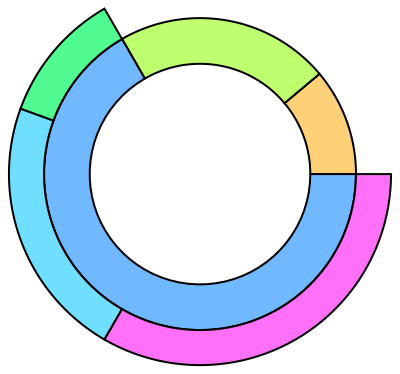 |
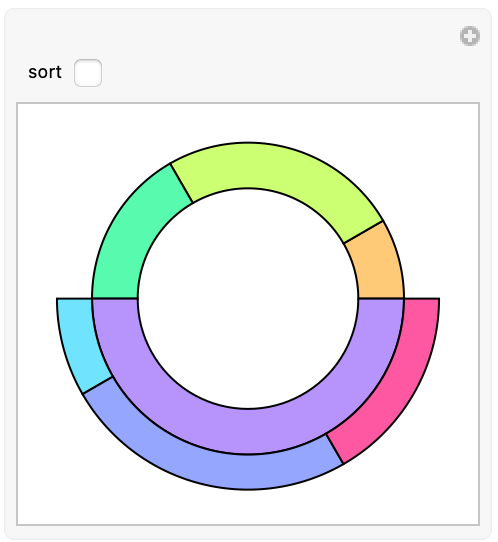
By default, all arc sectors are sorted by value, i.e. area:
| In[10]:= | ![Manipulate[
ResourceFunction["PolarTreemapPlot"][{1, 3, 2, {1, 3, 2}}, "SortSectors" -> sort, ImageSize -> 200], {sort, {True, False}}]](https://www.wolframcloud.com/obj/resourcesystem/images/d17/d17a7c3f-351b-4de5-9562-73f9150bafb8/1f7d42223759c51e.png) |
| Out[10]= | 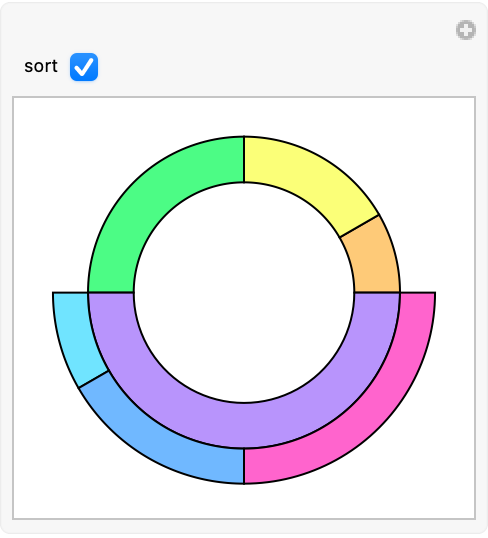 |
When unsorted, arc sectors may be ordered differently:
Set the Background color and ImageSize of the plot:
| In[11]:= |
| Out[7]= | 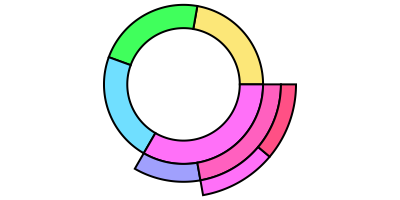 |
This work is licensed under a Creative Commons Attribution 4.0 International License