Wolfram Function Repository
Instant-use add-on functions for the Wolfram Language
Function Repository Resource:
Make polygons from an array of points
ResourceFunction["PointArrayToPolygons"][array] returns a GraphicsComplex object representing polygons formed from the two-dimensional array of 3D points array. |
An array of points:
| In[1]:= |
Make polygons out of the points, and visualize them:
| In[2]:= |
| Out[2]= | 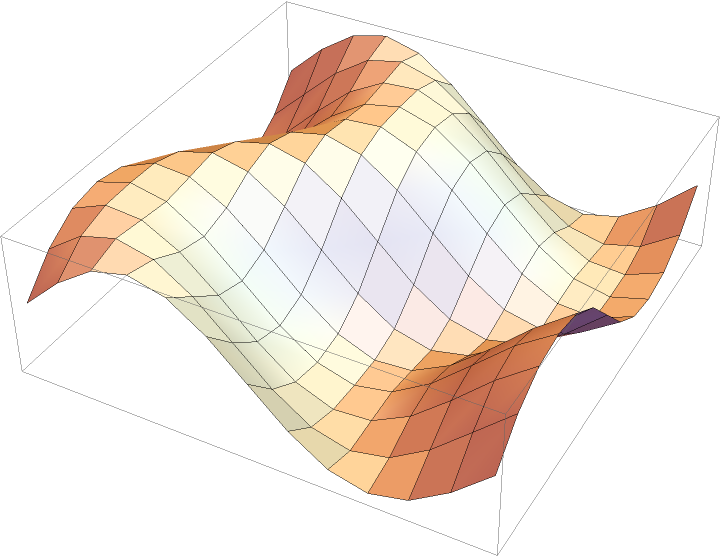 |
Points representing a torus:
| In[3]:= | ![torus = With[{c = 3, a = 1, m = 55, n = 55}, Table[N[{(c + a Cos[v]) Cos[u], (c + a Cos[v]) Sin[u], a Sin[v]}], {v, 0, 2 \[Pi], (2 \[Pi])/(n - 1)}, {u, 0, 2 \[Pi], (2 \[Pi])/(m - 1)}]];](https://www.wolframcloud.com/obj/resourcesystem/images/78c/78c54e30-2b72-476d-8235-3f188c9a6bec/7265357e9814c725.png) |
Use directives to modify the style of the polygons:
| In[4]:= |
| Out[4]= | 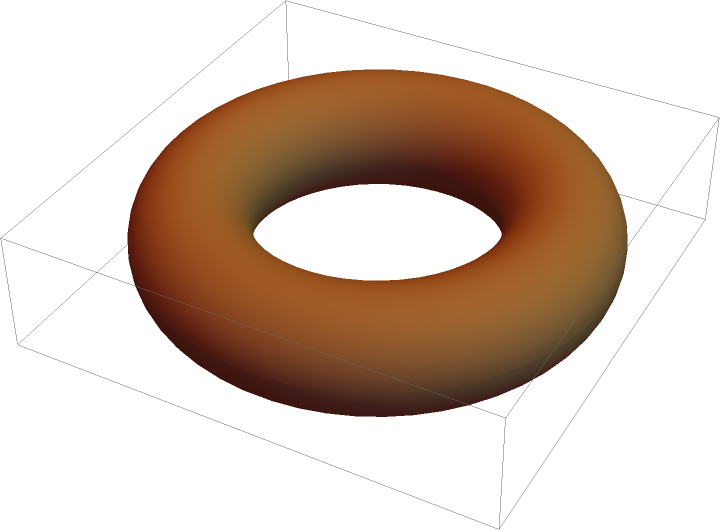 |
Torus points with color directives for each point:
| In[5]:= | ![torcol = With[{c = 3, a = 1, m = 55, n = 55}, Table[N[{(c + a Cos[v]) Cos[u], (c + a Cos[v]) Sin[u], a Sin[v], Hue[1/3 + Cos[u - v]^2 Sin[u]^2]}], {v, 0, 2 \[Pi], (2 \[Pi])/(
n - 1)}, {u, 0, 2 \[Pi], (2 \[Pi])/(m - 1)}]];](https://www.wolframcloud.com/obj/resourcesystem/images/78c/78c54e30-2b72-476d-8235-3f188c9a6bec/44b0ee3e7b4f9451.png) |
Show the colored torus:
| In[6]:= |
| Out[6]= | 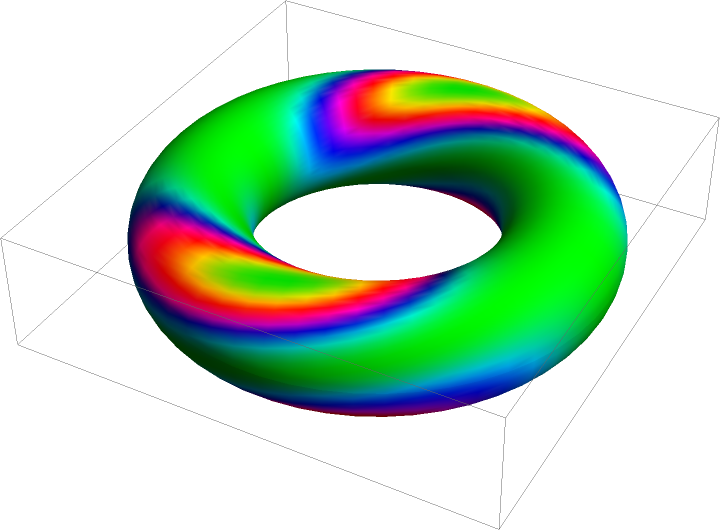 |
Compare the result of including and not including normals:
| In[7]:= |
| In[8]:= | ![{Graphics3D[{EdgeForm[], ResourceFunction["PointArrayToPolygons"][hat, VertexNormals -> True]}], Graphics3D[{EdgeForm[], ResourceFunction["PointArrayToPolygons"][hat, VertexNormals -> False]}]} // GraphicsRow](https://www.wolframcloud.com/obj/resourcesystem/images/78c/78c54e30-2b72-476d-8235-3f188c9a6bec/301a270e2a4085ad.png) |
| Out[8]= | 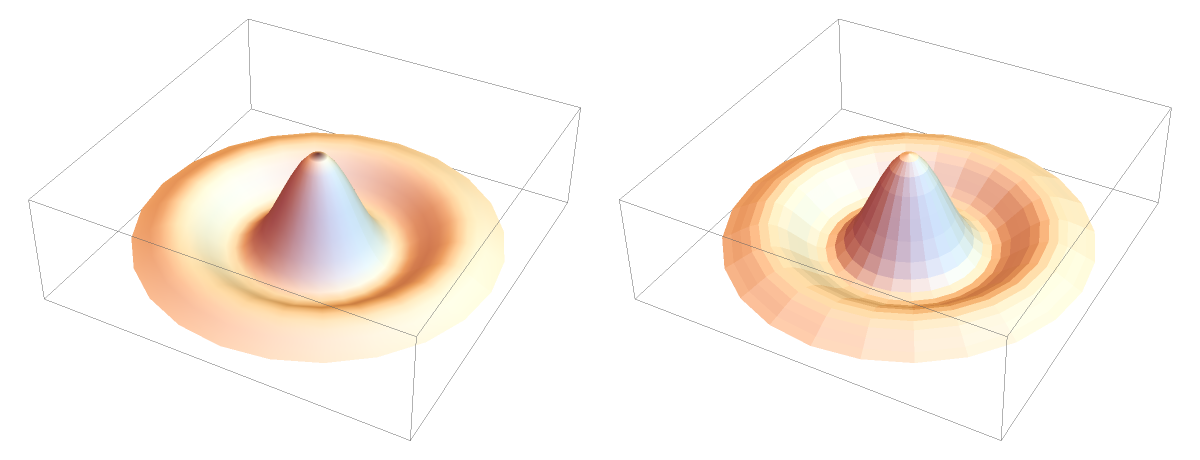 |
Use PointArrayToPolygons with the resource function PerforatePolygons to make a surface with holes:
| In[9]:= |
| In[10]:= |
| Out[10]= | 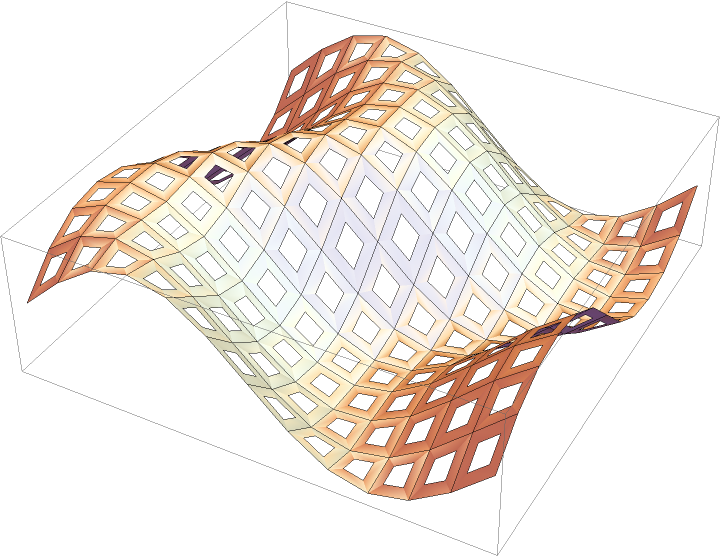 |
This work is licensed under a Creative Commons Attribution 4.0 International License