Wolfram Function Repository
Instant-use add-on functions for the Wolfram Language
Function Repository Resource:
Cluster and plot two-dimensional points
ResourceFunction["PlotClusters"][points] plot clusters in a list of two dimensional points. | |
ResourceFunction["PlotClusters"][points,n] plot n clusters. |
Identify and cluster points from some sample data:
| In[1]:= | ![data = CompressedData["
1:eJxtUktqAkEQbcxgPoyJzoh7r2AO0H2GHEFItp5Hb5JV9zYQ7+BqIDALRZEM
iOjMe6+hxYKm6FdVr15X9XS++PjsGWNm19P61bK1nV//tpa5987eHPA/4kPe
B+GrsxdnOstjPvLGDvEh8ZL5r6pnfML7t0Xdk+oDfO2R1yPPY+QlHtQXOrIA
L56M+CSkus4WvuK7DuxfE++z7t/rndKPfnsrfuDjoDnBP7N/wXhlpUs+nVdO
XPlHq3lL3/39lPQP7mYfQTqAF3FfwMuQ6smjTvAbp3rwj5hv6DeWc/DEmd9Q
38mmOgZRL+4/Vnqkn//Aqz/fTf6M8VGcm3SLT/9I/wTxLffRsN/Ra856X8rf
eOm53e8FGjw92w==
"];
ResourceFunction[
"PlotClusters", ResourceSystemBase -> "https://www.wolframcloud.com/obj/resourcesystem/api/1.0"][data]](https://www.wolframcloud.com/obj/resourcesystem/images/a49/a495d382-ed5f-4d9c-bb7a-09a9b04ba372/6ff1f1223b2856c6.png) |
| Out[2]= | 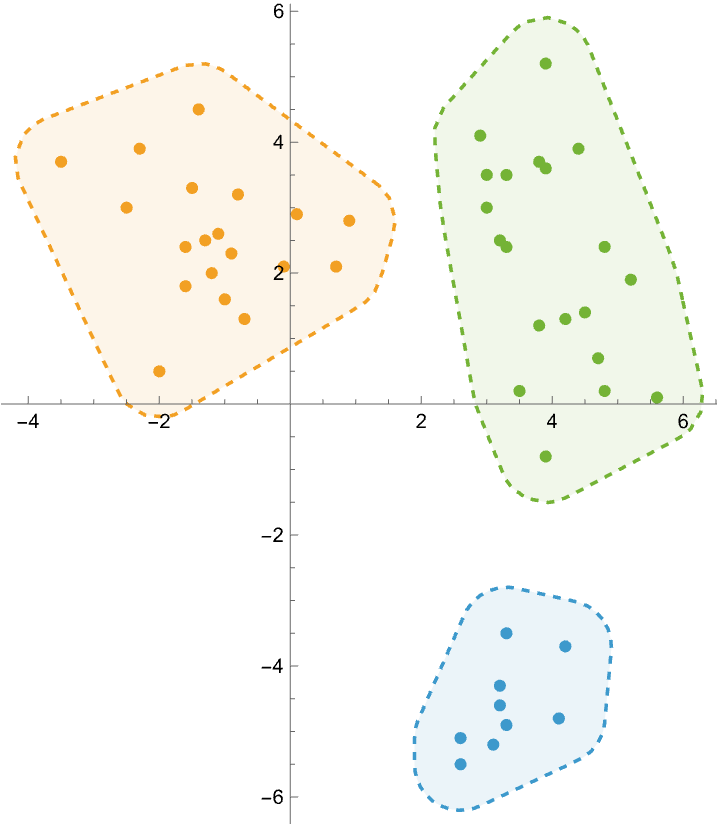 |
Find clusters in randomly generated data:
| In[3]:= | ![data = RandomSample[Join[{-1, 1} + # & /@ RandomReal[{0, 1}, {20, 2}],
{1, .5} + # & /@ RandomReal[{0, 1}, {20, 2}],
{1, -1} + # & /@ RandomReal[{0, 1}, {20, 2}],
{-.2, -.2} + # & /@ RandomReal[{0, 1}, {20, 2}]]];
ResourceFunction[
"PlotClusters", ResourceSystemBase -> "https://www.wolframcloud.com/obj/resourcesystem/api/1.0"][data]](https://www.wolframcloud.com/obj/resourcesystem/images/a49/a495d382-ed5f-4d9c-bb7a-09a9b04ba372/7524eb11db2fe7a0.png) |
| Out[4]= | 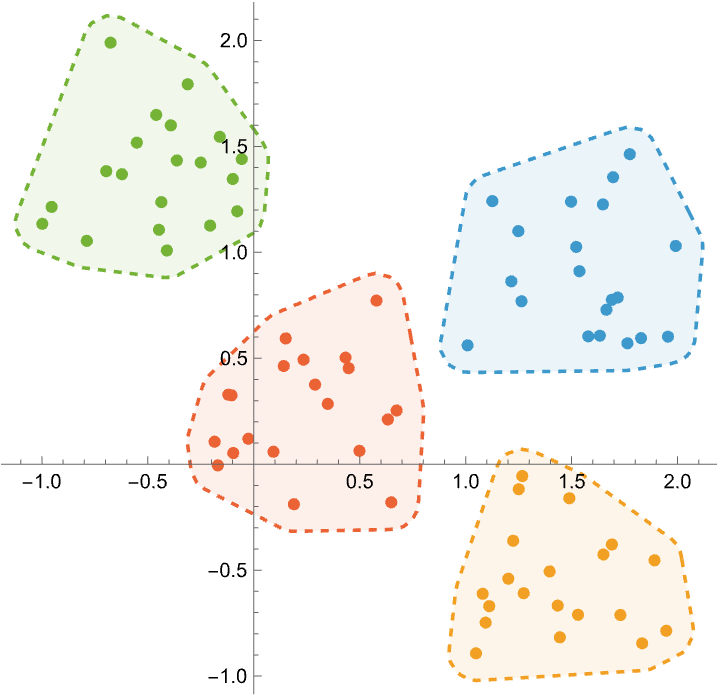 |
Change the number of clusters:
| In[5]:= | ![data = CompressedData["
1:eJxtUktqAkEQbcxgPoyJzoh7r2AO0H2GHEFItp5Hb5JV9zYQ7+BqIDALRZEM
iOjMe6+hxYKm6FdVr15X9XS++PjsGWNm19P61bK1nV//tpa5987eHPA/4kPe
B+GrsxdnOstjPvLGDvEh8ZL5r6pnfML7t0Xdk+oDfO2R1yPPY+QlHtQXOrIA
L56M+CSkus4WvuK7DuxfE++z7t/rndKPfnsrfuDjoDnBP7N/wXhlpUs+nVdO
XPlHq3lL3/39lPQP7mYfQTqAF3FfwMuQ6smjTvAbp3rwj5hv6DeWc/DEmd9Q
38mmOgZRL+4/Vnqkn//Aqz/fTf6M8VGcm3SLT/9I/wTxLffRsN/Ra856X8rf
eOm53e8FGjw92w==
"];
ResourceFunction[
"PlotClusters", ResourceSystemBase -> "https://www.wolframcloud.com/obj/resourcesystem/api/1.0"][data, 4]](https://www.wolframcloud.com/obj/resourcesystem/images/a49/a495d382-ed5f-4d9c-bb7a-09a9b04ba372/6e32aab5d9641d8d.png) |
| Out[6]= | 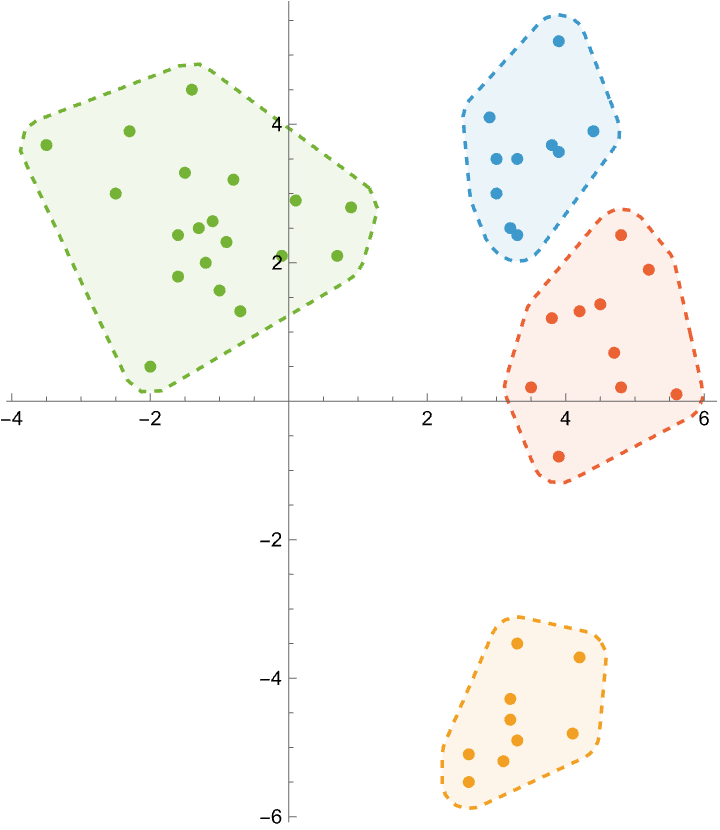 |
Observe how clustering changes as the number of clusters changes:
| In[7]:= | ![data = CompressedData["
1:eJxtUktqAkEQbcxgPoyJzoh7r2AO0H2GHEFItp5Hb5JV9zYQ7+BqIDALRZEM
iOjMe6+hxYKm6FdVr15X9XS++PjsGWNm19P61bK1nV//tpa5987eHPA/4kPe
B+GrsxdnOstjPvLGDvEh8ZL5r6pnfML7t0Xdk+oDfO2R1yPPY+QlHtQXOrIA
L56M+CSkus4WvuK7DuxfE++z7t/rndKPfnsrfuDjoDnBP7N/wXhlpUs+nVdO
XPlHq3lL3/39lPQP7mYfQTqAF3FfwMuQ6smjTvAbp3rwj5hv6DeWc/DEmd9Q
38mmOgZRL+4/Vnqkn//Aqz/fTf6M8VGcm3SLT/9I/wTxLffRsN/Ra856X8rf
eOm53e8FGjw92w==
"];
plots = Table[
ResourceFunction[
"PlotClusters", ResourceSystemBase -> "https://www.wolframcloud.com/obj/resourcesystem/api/1.0"][data, n], {n, 2, 5}];
Manipulate[plots[[n]], {{n, 2}, 1, Length[plots], 1}]](https://www.wolframcloud.com/obj/resourcesystem/images/a49/a495d382-ed5f-4d9c-bb7a-09a9b04ba372/751a754821569987.png) |
| Out[9]= | 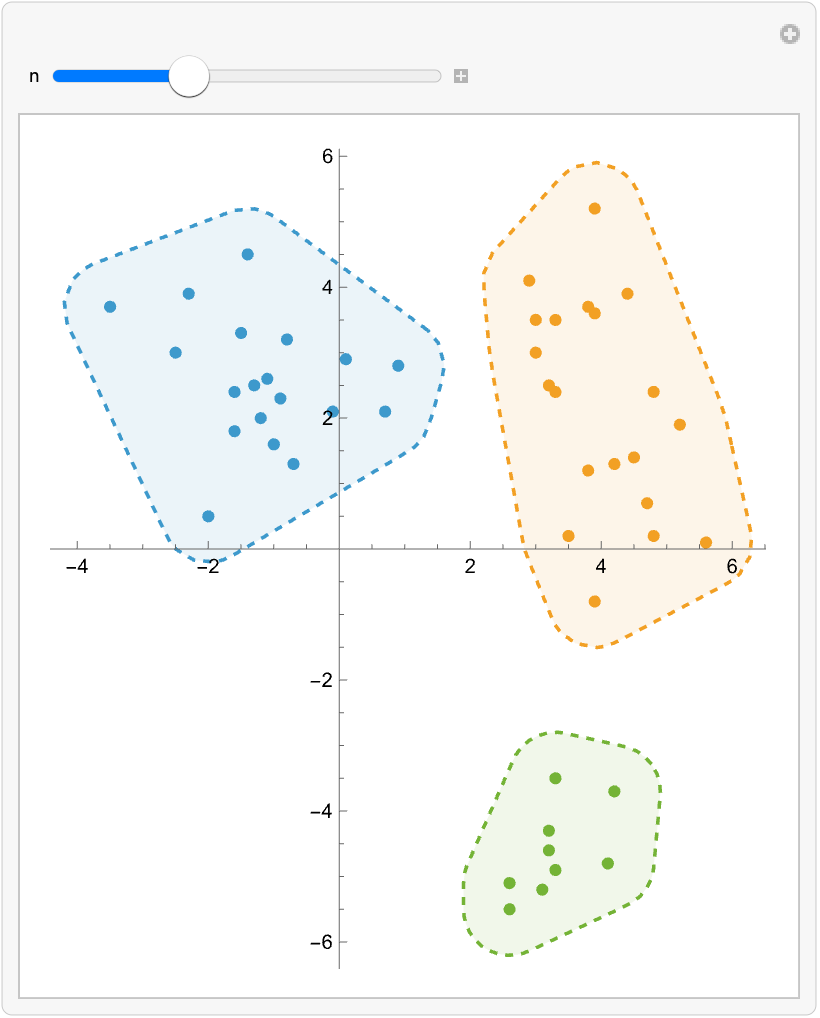 |
Wolfram Language 14.0 (January 2024) or above
This work is licensed under a Creative Commons Attribution 4.0 International License