Wolfram Function Repository
Instant-use add-on functions for the Wolfram Language
Function Repository Resource:
The derivative of a piecewise function with Indeterminate for points or regions where the function is not defined
|
ResourceFunction["PiecewiseD"][f,x] returns the derivative of a piecewise function returning the value Indeterminate for points or regions where the function is not defined. |
|
|
ResourceFunction["PiecewiseD"][f,x,k] returns the function together with its first k derivatives. |
|
|
ResourceFunction["PiecewiseD"][f,{x,k}] returns the kth derivative. |
Compute the derivative of a piecewise function:
| In[1]:= |
![f[x_] := \!\(\*
TagBox[GridBox[{
{"\[Piecewise]", GridBox[{
{
RowBox[{
RowBox[{"-", "2"}], " ", "x"}],
RowBox[{"x", "<", "0"}]},
{
RowBox[{
RowBox[{"2", " ", "x"}], "+", "1"}],
RowBox[{"x", ">", "0"}]}
},
AllowedDimensions->{2, Automatic},
Editable->True,
GridBoxAlignment->{"Columns" -> {{Left}}, "Rows" -> {{Baseline}}},
GridBoxItemSize->{"Columns" -> {{Automatic}}, "Rows" -> {{1.}}},
GridBoxSpacings->{"Columns" -> {
Offset[0.27999999999999997`], {
Offset[0.84]},
Offset[0.27999999999999997`]}, "Rows" -> {
Offset[0.2], {
Offset[0.4]},
Offset[0.2]}},
Selectable->True]}
},
GridBoxAlignment->{"Columns" -> {{Left}}, "Rows" -> {{Baseline}}},
GridBoxItemSize->{"Columns" -> {{Automatic}}, "Rows" -> {{1.}}},
GridBoxSpacings->{"Columns" -> {
Offset[0.27999999999999997`], {
Offset[0.35]},
Offset[0.27999999999999997`]}, "Rows" -> {
Offset[0.2], {
Offset[0.4]},
Offset[0.2]}}],
"Piecewise",
DeleteWithContents->True,
Editable->False,
SelectWithContents->True,
Selectable->False,
StripWrapperBoxes->True]\)
ResourceFunction["PiecewiseD"][f[x], x]](https://www.wolframcloud.com/obj/resourcesystem/images/2a1/2a1bf499-6130-438a-b37d-3929eb18cba2/1-0-0/76eed70bbe7bc6c4.png)
|
| Out[2]= |
|
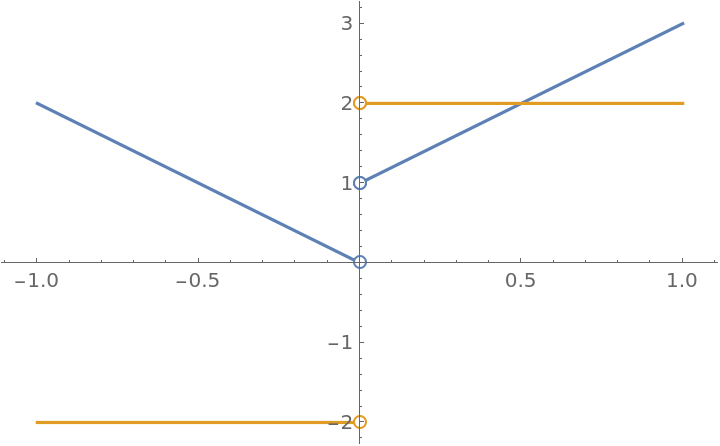
Plot a function together with its piecewise derivative:
| In[3]:= |
![ResourceFunction["EnhancedPlot"][
ResourceFunction["PiecewiseD"][f[x], x, 1], {x, -1, 1}, "Exception" -> 0, PlotRange -> All]](https://www.wolframcloud.com/obj/resourcesystem/images/2a1/2a1bf499-6130-438a-b37d-3929eb18cba2/1-0-0/1c09d03686d327a4.png)
|
| Out[3]= |
|
Compute the first two derivatives of a function whose domain is not an interval:
| In[4]:= |
![Clear[f]
f[x_] := \!\(\*
TagBox[GridBox[{
{"\[Piecewise]", GridBox[{
{
RowBox[{"x", "-",
RowBox[{"1", "/", "2"}]}],
RowBox[{"x", "<", "0"}]},
{
RowBox[{"Sin", "[", "x", "]"}],
RowBox[{"x", ">=", "1"}]}
},
AllowedDimensions->{2, Automatic},
Editable->True,
GridBoxAlignment->{
"Columns" -> {{Left}}, "ColumnsIndexed" -> {}, "Rows" -> {{Baseline}}, "RowsIndexed" -> {}},
GridBoxItemSize->{
"Columns" -> {{Automatic}}, "ColumnsIndexed" -> {}, "Rows" -> {{1.}}, "RowsIndexed" -> {}},
GridBoxSpacings->{"Columns" -> {
Offset[0.27999999999999997`], {
Offset[0.84]},
Offset[0.27999999999999997`]}, "ColumnsIndexed" -> {}, "Rows" -> {
Offset[0.2], {
Offset[0.4]},
Offset[0.2]}, "RowsIndexed" -> {}},
Selectable->True]}
},
GridBoxAlignment->{
"Columns" -> {{Left}}, "ColumnsIndexed" -> {}, "Rows" -> {{Baseline}}, "RowsIndexed" -> {}},
GridBoxItemSize->{
"Columns" -> {{Automatic}}, "ColumnsIndexed" -> {}, "Rows" -> {{1.}}, "RowsIndexed" -> {}},
GridBoxSpacings->{"Columns" -> {
Offset[0.27999999999999997`], {
Offset[0.35]},
Offset[0.27999999999999997`]}, "ColumnsIndexed" -> {}, "Rows" -> {
Offset[0.2], {
Offset[0.4]},
Offset[0.2]}, "RowsIndexed" -> {}}],
"Piecewise",
DeleteWithContents->True,
Editable->False,
SelectWithContents->True,
Selectable->False,
StripWrapperBoxes->True]\)
ResourceFunction["PiecewiseD"][f[x], x, 2]](https://www.wolframcloud.com/obj/resourcesystem/images/2a1/2a1bf499-6130-438a-b37d-3929eb18cba2/1-0-0/237e09f997ebc62c.png)
|
| Out[6]= |
|
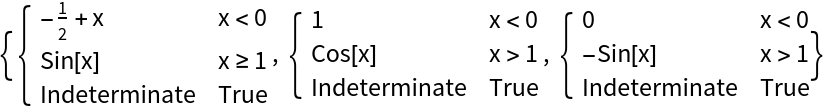
Compute just the second derivative:
| In[7]:= |
|
| Out[7]= |
|
Plot the function together with its first two derivatives:
| In[8]:= |
|
| Out[8]= |
|
Find and plot the first- and second-order derivatives. The function and its first-order derivative are continuous at x=0, but not the second-order derivative:
| In[9]:= |
|
| Out[10]= |
|
Check that the first derivative is continuous:
| In[11]:= |
|
| Out[11]= |
|
Check that the second derivative is not continuous:
| In[12]:= |
|
| Out[12]= |
|
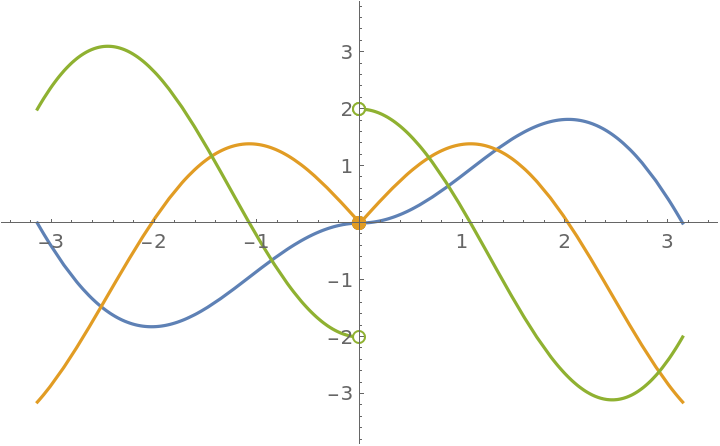
Plot the results:
| In[13]:= |
![ResourceFunction["EnhancedPlot"][
ResourceFunction["PiecewiseD"][f[x], x, 2], {x, -\[Pi], \[Pi]}, "Exception" -> 0, PlotRange -> {-3.5, 3.5}]](https://www.wolframcloud.com/obj/resourcesystem/images/2a1/2a1bf499-6130-438a-b37d-3929eb18cba2/1-0-0/3b8236f265d2d487.png)
|
| Out[13]= |
|
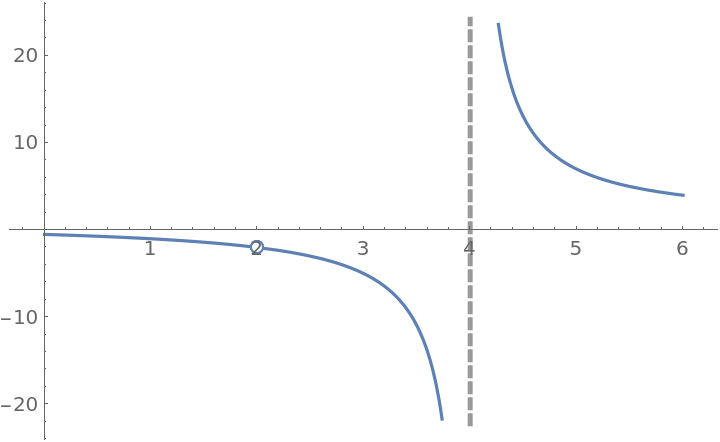
The following function has a removable discontinuity at x=2 and an infinite discontinuity at x=4:
| In[15]:= |
![f[x_] := (x^2 - 4)/((x - 2) (x - 4))
ResourceFunction["EnhancedPlot"][f[x], {x, 0, 6}, "Exception" -> 2, "Asymptote" -> 4]](https://www.wolframcloud.com/obj/resourcesystem/images/2a1/2a1bf499-6130-438a-b37d-3929eb18cba2/1-0-0/02a63b12dbd33022.png)
|
| Out[16]= |
|
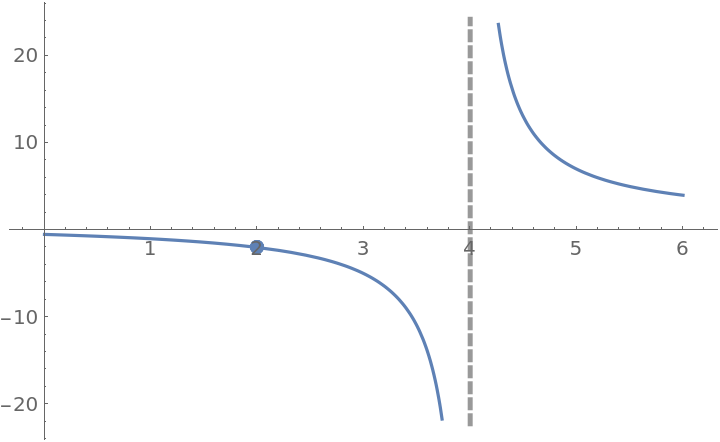
Extend the definition at x=2 to make the extended function continuous there:
| In[17]:= |
|
| Out[17]= |
|
| In[18]:= |
![g[x_] := \!\(\*
TagBox[GridBox[{
{"\[Piecewise]", GridBox[{
{
RowBox[{"f", "[", "x", "]"}],
RowBox[{
RowBox[{"x", "!=", "2"}], "&&",
RowBox[{"x", "!=", "4"}]}]},
{
RowBox[{"-", "2"}],
RowBox[{"x", "==", "2"}]}
},
AllowedDimensions->{2, Automatic},
Editable->True,
GridBoxAlignment->{
"Columns" -> {{Left}}, "ColumnsIndexed" -> {}, "Rows" -> {{Baseline}}, "RowsIndexed" -> {}},
GridBoxItemSize->{
"Columns" -> {{Automatic}}, "ColumnsIndexed" -> {}, "Rows" -> {{1.}}, "RowsIndexed" -> {}},
GridBoxSpacings->{"Columns" -> {
Offset[0.27999999999999997`], {
Offset[0.84]},
Offset[0.27999999999999997`]}, "ColumnsIndexed" -> {}, "Rows" -> {
Offset[0.2], {
Offset[0.4]},
Offset[0.2]}, "RowsIndexed" -> {}},
Selectable->True]}
},
GridBoxAlignment->{
"Columns" -> {{Left}}, "ColumnsIndexed" -> {}, "Rows" -> {{Baseline}}, "RowsIndexed" -> {}},
GridBoxItemSize->{
"Columns" -> {{Automatic}}, "ColumnsIndexed" -> {}, "Rows" -> {{1.}}, "RowsIndexed" -> {}},
GridBoxSpacings->{"Columns" -> {
Offset[0.27999999999999997`], {
Offset[0.35]},
Offset[0.27999999999999997`]}, "ColumnsIndexed" -> {}, "Rows" -> {
Offset[0.2], {
Offset[0.4]},
Offset[0.2]}, "RowsIndexed" -> {}}],
"Piecewise",
DeleteWithContents->True,
Editable->False,
SelectWithContents->True,
Selectable->False,
StripWrapperBoxes->True]\)
ResourceFunction["EnhancedPlot"][g[x], {x, 0, 6}, "Exception" -> 2, "Asymptote" -> 4]](https://www.wolframcloud.com/obj/resourcesystem/images/2a1/2a1bf499-6130-438a-b37d-3929eb18cba2/1-0-0/1a9750bb7392fe5d.png)
|
| Out[19]= |
|
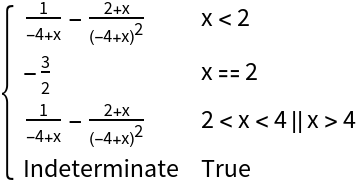
The extended function is actually differentiable at x=2:
| In[20]:= |
|
| Out[20]= |
|
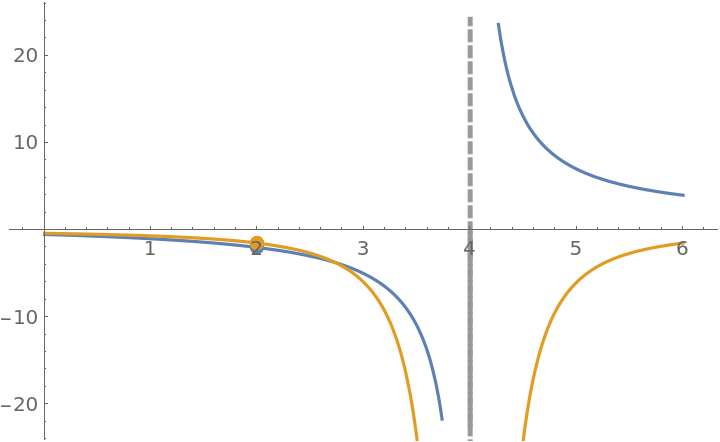
The resource function EnhancedPlot produces a correct plot:
| In[21]:= |
![ResourceFunction["EnhancedPlot"][
ResourceFunction["PiecewiseD"][g[x], x, 1], {x, 0, 6}, "Exception" -> 2, "Asymptote" -> 4]](https://www.wolframcloud.com/obj/resourcesystem/images/2a1/2a1bf499-6130-438a-b37d-3929eb18cba2/1-0-0/62b15ac2c0dcc4fc.png)
|
| Out[21]= |
|
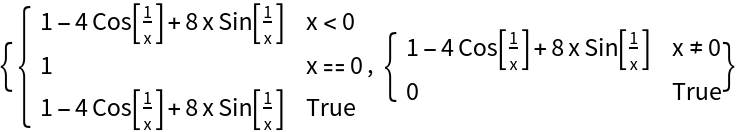
The function g is differentiable at x=0 and PiecewiseD returns the correct value, 1. The function D, however, returns the value 0 for the derivative at x=0:
| In[22]:= |
![g[x_] := \!\(\*
TagBox[GridBox[{
{"\[Piecewise]", GridBox[{
{
RowBox[{
RowBox[{"4",
SuperscriptBox["x", "2"],
RowBox[{"Sin", "[",
FractionBox["1", "x"], "]"}]}], "+", "x"}],
RowBox[{"x", "!=", "0"}]},
{"0",
RowBox[{"x", "==", "0"}]}
},
AllowedDimensions->{2, Automatic},
Editable->True,
GridBoxAlignment->{
"Columns" -> {{Left}}, "ColumnsIndexed" -> {}, "Rows" -> {{Baseline}}, "RowsIndexed" -> {}},
GridBoxItemSize->{
"Columns" -> {{Automatic}}, "ColumnsIndexed" -> {}, "Rows" -> {{1.}}, "RowsIndexed" -> {}},
GridBoxSpacings->{"Columns" -> {
Offset[0.27999999999999997`], {
Offset[0.84]},
Offset[0.27999999999999997`]}, "ColumnsIndexed" -> {}, "Rows" -> {
Offset[0.2], {
Offset[0.4]},
Offset[0.2]}, "RowsIndexed" -> {}},
Selectable->True]}
},
GridBoxAlignment->{
"Columns" -> {{Left}}, "ColumnsIndexed" -> {}, "Rows" -> {{Baseline}}, "RowsIndexed" -> {}},
GridBoxItemSize->{
"Columns" -> {{Automatic}}, "ColumnsIndexed" -> {}, "Rows" -> {{1.}}, "RowsIndexed" -> {}},
GridBoxSpacings->{"Columns" -> {
Offset[0.27999999999999997`], {
Offset[0.35]},
Offset[0.27999999999999997`]}, "ColumnsIndexed" -> {}, "Rows" -> {
Offset[0.2], {
Offset[0.4]},
Offset[0.2]}, "RowsIndexed" -> {}}],
"Piecewise",
DeleteWithContents->True,
Editable->False,
SelectWithContents->True,
Selectable->False]\)
{ResourceFunction["PiecewiseD"][g[x], x], D[g[x], x]}](https://www.wolframcloud.com/obj/resourcesystem/images/2a1/2a1bf499-6130-438a-b37d-3929eb18cba2/1-0-0/66acd3d5662ef51f.png)
|
| Out[23]= |
|
| In[24]:= |
|
| Out[24]= |
|
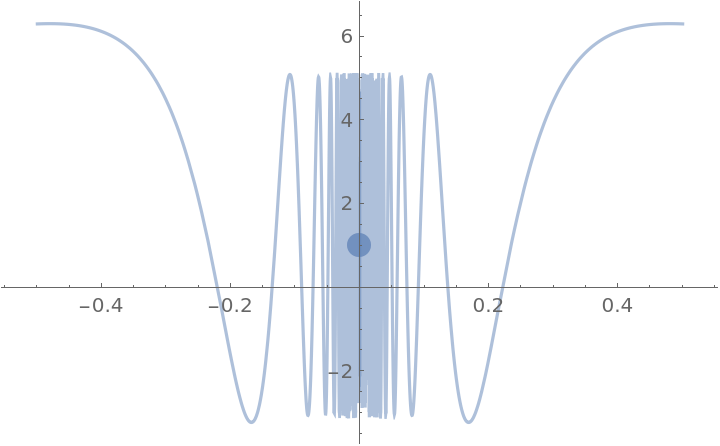
However, the derivative is not continuous:
| In[25]:= |
![ResourceFunction["EnhancedPlot"][
ResourceFunction["PiecewiseD"][g[x], x], {x, -.5, .5}, "Exception" -> 0, PlotStyle -> Opacity[.5], "PointStyle" -> AbsolutePointSize[12]]](https://www.wolframcloud.com/obj/resourcesystem/images/2a1/2a1bf499-6130-438a-b37d-3929eb18cba2/1-0-0/0526d2e478390ef2.png)
|
| Out[25]= |
|
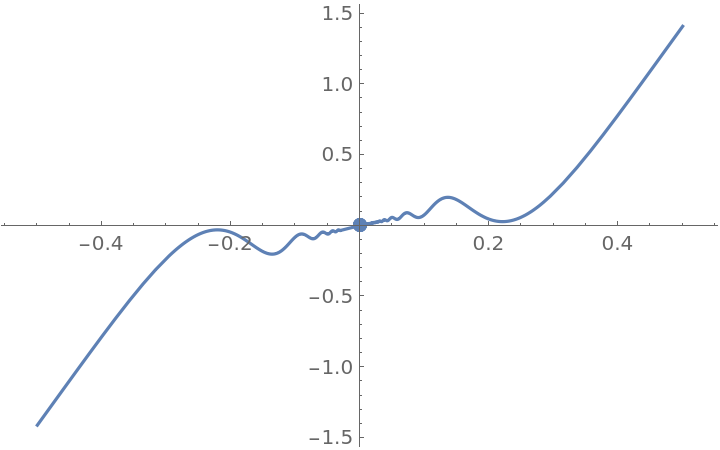
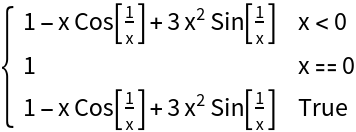
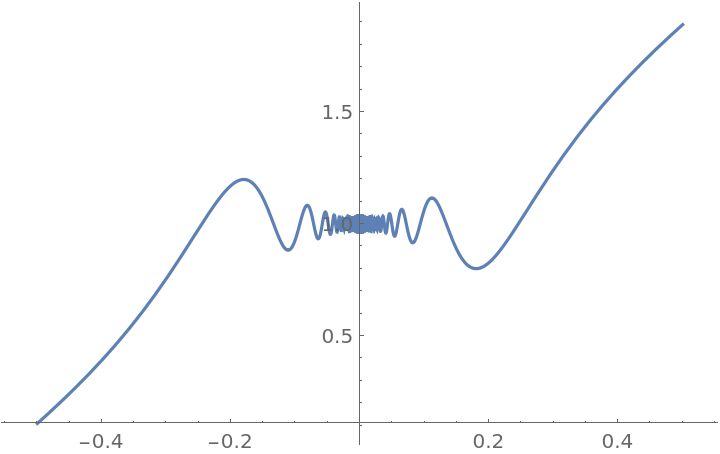
This function is differentiable at x=0 and its derivative is continuous there:
| In[26]:= |
![Clear[g]
g[x_] := \!\(\*
TagBox[GridBox[{
{"\[Piecewise]", GridBox[{
{
RowBox[{
RowBox[{
SuperscriptBox["x", "3"],
RowBox[{"Sin", "[",
FractionBox["1", "x"], "]"}]}], "+", "x"}],
RowBox[{"x", "!=", "0"}]},
{"0",
RowBox[{"x", "==", "0"}]}
},
AllowedDimensions->{2, Automatic},
Editable->True,
GridBoxAlignment->{
"Columns" -> {{Left}}, "ColumnsIndexed" -> {}, "Rows" -> {{Baseline}}, "RowsIndexed" -> {}},
GridBoxItemSize->{
"Columns" -> {{Automatic}}, "ColumnsIndexed" -> {}, "Rows" -> {{1.}}, "RowsIndexed" -> {}},
GridBoxSpacings->{"Columns" -> {
Offset[0.27999999999999997`], {
Offset[0.84]},
Offset[0.27999999999999997`]}, "ColumnsIndexed" -> {}, "Rows" -> {
Offset[0.2], {
Offset[0.4]},
Offset[0.2]}, "RowsIndexed" -> {}},
Selectable->True]}
},
GridBoxAlignment->{
"Columns" -> {{Left}}, "ColumnsIndexed" -> {}, "Rows" -> {{Baseline}}, "RowsIndexed" -> {}},
GridBoxItemSize->{
"Columns" -> {{Automatic}}, "ColumnsIndexed" -> {}, "Rows" -> {{1.}}, "RowsIndexed" -> {}},
GridBoxSpacings->{"Columns" -> {
Offset[0.27999999999999997`], {
Offset[0.35]},
Offset[0.27999999999999997`]}, "ColumnsIndexed" -> {}, "Rows" -> {
Offset[0.2], {
Offset[0.4]},
Offset[0.2]}, "RowsIndexed" -> {}}],
"Piecewise",
DeleteWithContents->True,
Editable->False,
SelectWithContents->True,
Selectable->False]\)
dg[x_] = ResourceFunction["PiecewiseD"][g[x], x]](https://www.wolframcloud.com/obj/resourcesystem/images/2a1/2a1bf499-6130-438a-b37d-3929eb18cba2/1-0-0/2a9210ecd4750f45.png)
|
| Out[28]= |
|
| In[29]:= |
|
| Out[29]= |
|
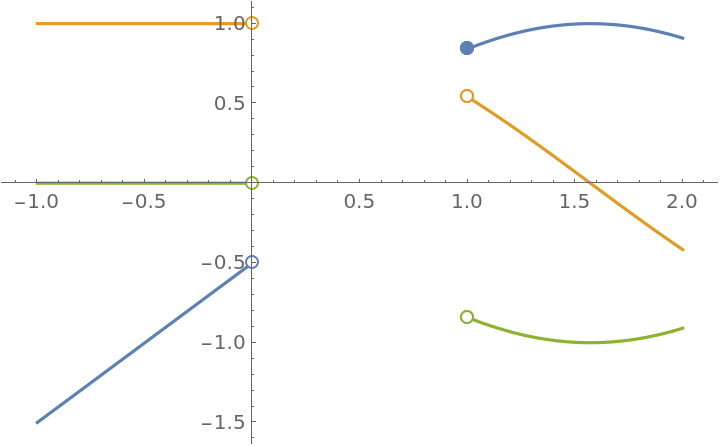
Plot the result using the resource function EnhancedPlot:
| In[30]:= |
![ResourceFunction["EnhancedPlot"][
ResourceFunction["PiecewiseD"][g[x], x], {x, -.5, .5}, "Exception" -> 0, "PointStyle" -> AbsolutePointSize[10]]](https://www.wolframcloud.com/obj/resourcesystem/images/2a1/2a1bf499-6130-438a-b37d-3929eb18cba2/1-0-0/26da4d9248046c49.png)
|
| Out[30]= |
|
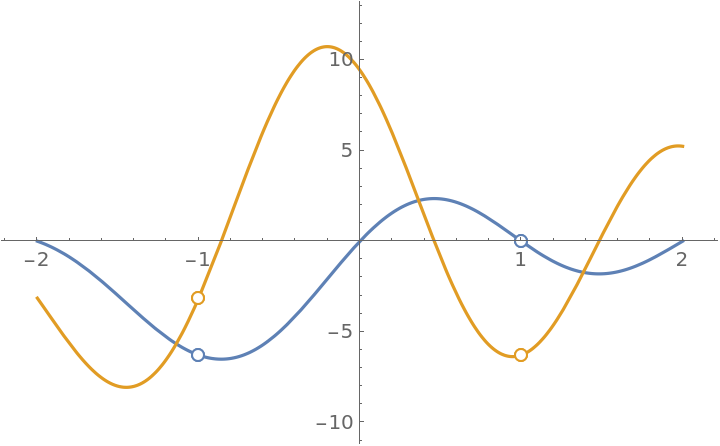
A function with a singularity at x=-1 and x=1; PiecewiseD returns the correct result. Note that if this expression is simplified, the singularity at x=1 will be lost:
| In[31]:= |
|
| Out[31]= |
|
The resource function EnhancedPlot is able to produce a correct plot:
| In[32]:= |
![ResourceFunction["EnhancedPlot"][
ResourceFunction["PiecewiseD", ResourceVersion->"1.0.0"][(x^2 + 2 x - 3)/(x^2 - 1) Sin[\[Pi] x], x, 1], {x, -2,
2}, "Exception" -> {-1, 1}, PlotRange -> {-10, 12}]](https://www.wolframcloud.com/obj/resourcesystem/images/2a1/2a1bf499-6130-438a-b37d-3929eb18cba2/1-0-0/764806ffeb12d9dc.png)
|
| Out[32]= |
|
Extend the function so that it becomes continuous at -1 and 1:
| In[33]:= |
|
| Out[33]= |
|
| In[34]:= |
![Clear[h]
h[x_] := \!\(\*
TagBox[GridBox[{
{"\[Piecewise]", GridBox[{
{
RowBox[{
FractionBox[
RowBox[{
SuperscriptBox["x", "2"], "+",
RowBox[{"2", "x"}], "-", "3"}],
RowBox[{
SuperscriptBox["x", "2"], "-", "1"}]],
RowBox[{"Sin", "[",
RowBox[{"\[Pi]", " ", "x"}], "]"}]}],
RowBox[{
RowBox[{"x", "!=",
RowBox[{"-", "1"}]}], "&&",
RowBox[{"x", "!=", "1"}]}]},
{
RowBox[{
RowBox[{"-", "2"}], "\[Pi]"}],
RowBox[{"x", "==",
RowBox[{"-", "1"}]}]},
{"0",
RowBox[{"x", "==", "1"}]}
},
AllowedDimensions->{2, Automatic},
Editable->True,
GridBoxAlignment->{
"Columns" -> {{Left}}, "ColumnsIndexed" -> {}, "Rows" -> {{Baseline}}, "RowsIndexed" -> {}},
GridBoxItemSize->{
"Columns" -> {{Automatic}}, "ColumnsIndexed" -> {}, "Rows" -> {{1.}}, "RowsIndexed" -> {}},
GridBoxSpacings->{"Columns" -> {
Offset[0.27999999999999997`], {
Offset[0.84]},
Offset[0.27999999999999997`]}, "ColumnsIndexed" -> {}, "Rows" -> {
Offset[0.2], {
Offset[0.4]},
Offset[0.2]}, "RowsIndexed" -> {}},
Selectable->True]}
},
GridBoxAlignment->{
"Columns" -> {{Left}}, "ColumnsIndexed" -> {}, "Rows" -> {{Baseline}}, "RowsIndexed" -> {}},
GridBoxItemSize->{
"Columns" -> {{Automatic}}, "ColumnsIndexed" -> {}, "Rows" -> {{1.}}, "RowsIndexed" -> {}},
GridBoxSpacings->{"Columns" -> {
Offset[0.27999999999999997`], {
Offset[0.35]},
Offset[0.27999999999999997`]}, "ColumnsIndexed" -> {}, "Rows" -> {
Offset[0.2], {
Offset[0.4]},
Offset[0.2]}, "RowsIndexed" -> {}}],
"Piecewise",
DeleteWithContents->True,
Editable->False,
SelectWithContents->True,
Selectable->False,
StripWrapperBoxes->True]\)](https://www.wolframcloud.com/obj/resourcesystem/images/2a1/2a1bf499-6130-438a-b37d-3929eb18cba2/1-0-0/008cf1df176af1e5.png)
|
The first and second derivatives are continuous at ±1:
| In[35]:= |
|
| Out[35]= |
|
| In[36]:= |
|
| Out[36]= |
|
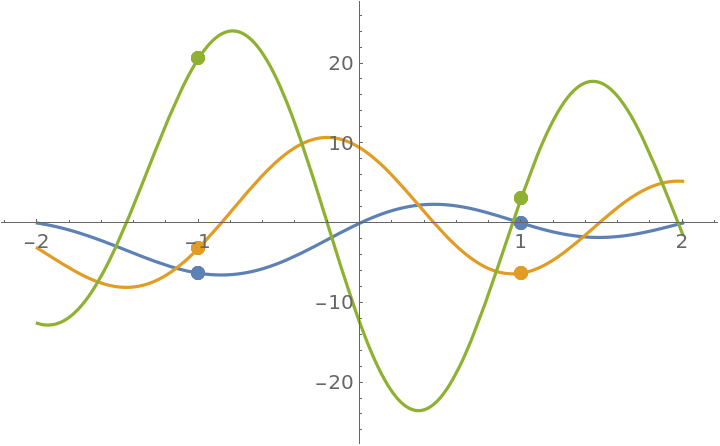
Plot the extended function and its first two derivatives:
| In[37]:= |
![ResourceFunction["EnhancedPlot"][
ResourceFunction["PiecewiseD"][h[x], x, 2], {x, -2, 2}, "Exception" -> {-1, 1}, PlotRange -> {-25, 25}]](https://www.wolframcloud.com/obj/resourcesystem/images/2a1/2a1bf499-6130-438a-b37d-3929eb18cba2/1-0-0/5d2b1fe48c53d0e7.png)
|
| Out[37]= |
|
This work is licensed under a Creative Commons Attribution 4.0 International License