Details and Options
The Persian Immortals were an elite army described by the Greek historian and geographer Herodotus while attacking Greece in 480-479 BCE under Xerxes's command. Their name refers to the fact that the size of the army was always kept constant at 10000 by immediately replacing every fallen warrior with a warrior from reserve troops. Because of this tactic, morale was kept high, and the army was actually getting stronger over time.
n determines how many of the weakest agents are removed:
| n | Integer, remove the n weakest agents. |
| dist | Use the distribution dist to determine how many of the weakest agents are removed. |
m determines how random agents are removed:
| m | Integer, remove m agents randomly |
| dist | Use the distribution dist to determine how many random agents are removed |
| {dist} | Each agent gets a random threshold between 0 and its fitness.
This threshold is then compared to a random attack given by dist.
Fitter agents have a higher chance of survival. |
pop describes the initial population:
| n | Integer, n agents of fitnesses linearly chosen between 0 and 1. |
| Automatic | Use 104 agents of fitnesses linearly chosen between 0 and 1. |
| {f1, f2,…} | Use agents with fitness fi (should be between 0 and 1). |
tspec describes the time for storing the output:
| n | Integer, simulate n steps and save data from all timesteps. |
| {tmin,tmax,Δt} | Simulates for tmax steps but saves every Δt steps, starting from tmin. |
| {{t1, t2,…}} | Simulates until Max[ti] and saves each ti. |
bins should be an integer that describes in how much bins the data should be binned. Fitnesses are assumed to be between 0 and 1.
PersianImmortals takes the following options:
| "Repetitions" | Automatic | number of times to simulate |
| "NewFitness" | Automatic | fitness for new agents |
| "Strengthening" | Automatic | specifies how the surviving agents strengthen over time |
Possible settings for the option "Repetitions" include:
| Automatic | perform a single simulation |
| n | perform n simulations and average the results |
Possible settings for the option "NewFitness" include:
| Automatic | generate agents with random fitnesses uniformly taken between 0 and 1 (UniformDistribution[0,1]) |
| dist | generate agents with random fitnesses taken from the distribution dist |
Possible settings for the option "Strengthening" include:
| Automatic | agents do not become stronger (equivalent to 0) |
| val≤1 | after each time step val is added to the fitness and clipped to[0,1] |
| val>1 | after each time step the fitness is multiplied by val and clipped to[0,1] |
| Scaled[val] | after each time step the fitness gets a fraction val closer to 1 |
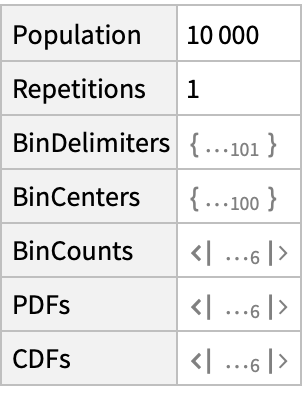
ResourceFunction["PersianImmortals"] returns an
Association with the following keys: "Population", "Repetitions", "BinDelimiters", "BinCenters", "BinCounts", "PDFs" and "CDFs".
![i = ResourceFunction[
"PersianImmortals"][{DiscreteUniformDistribution[{1, 5}], DiscreteUniformDistribution[{1, 3}]}];
ListLinePlot[Values[i["PDFs"]], PlotLegends -> Keys[i["PDFs"]], PlotRange -> {0, All}]](https://www.wolframcloud.com/obj/resourcesystem/images/5a8/5a89b235-c996-4bc0-8ee7-55d9e5c75e4a/1fcc56863b425678.png)
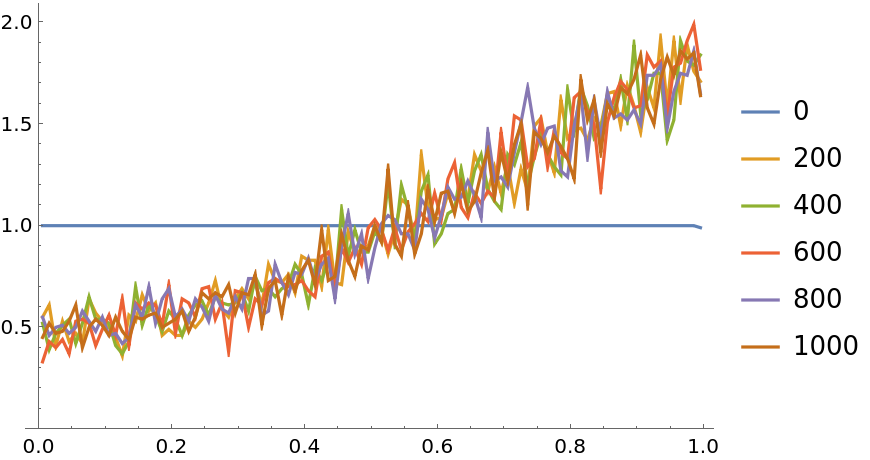
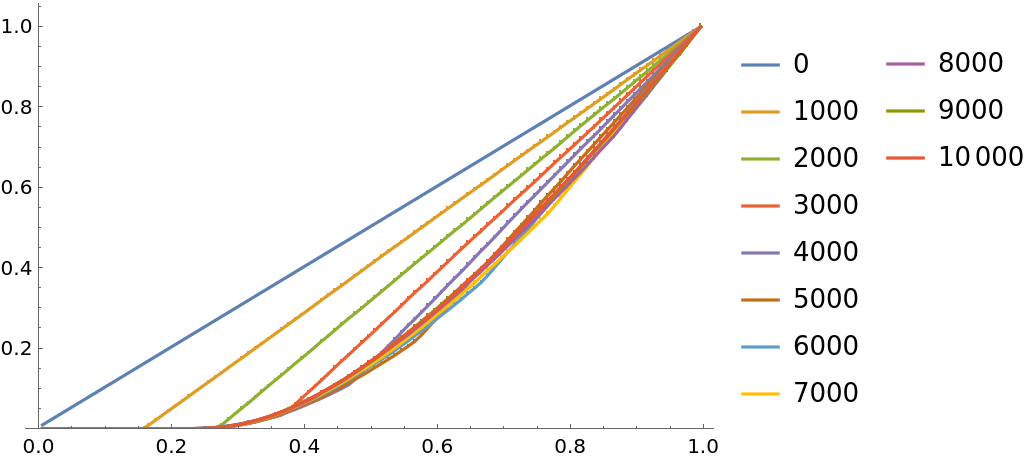
![i = ResourceFunction["PersianImmortals"][{1, 3}, 10^4, {0, 10^4, 1000}, "Strengthening" -> 0.0001, "Repetitions" -> 10];
ListLinePlot[Values[i["CDFs"]], PlotLegends -> Keys[i["CDFs"]], PlotRange -> {0, All}]](https://www.wolframcloud.com/obj/resourcesystem/images/5a8/5a89b235-c996-4bc0-8ee7-55d9e5c75e4a/303ee96837531f8a.png)
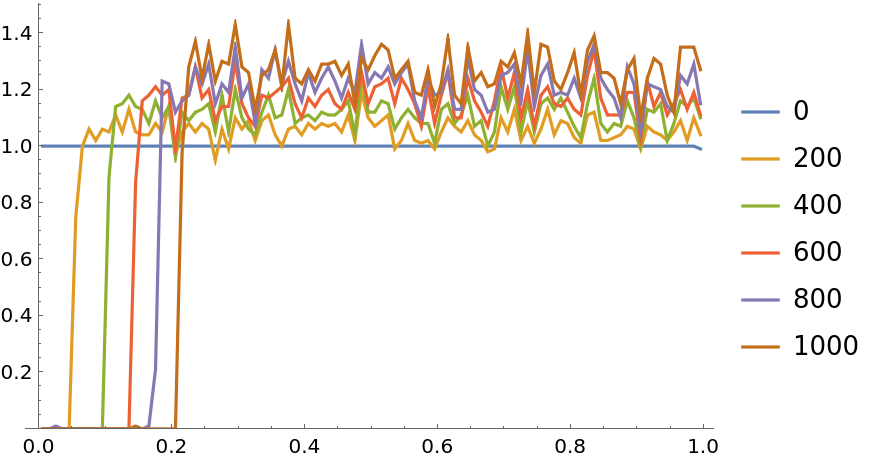
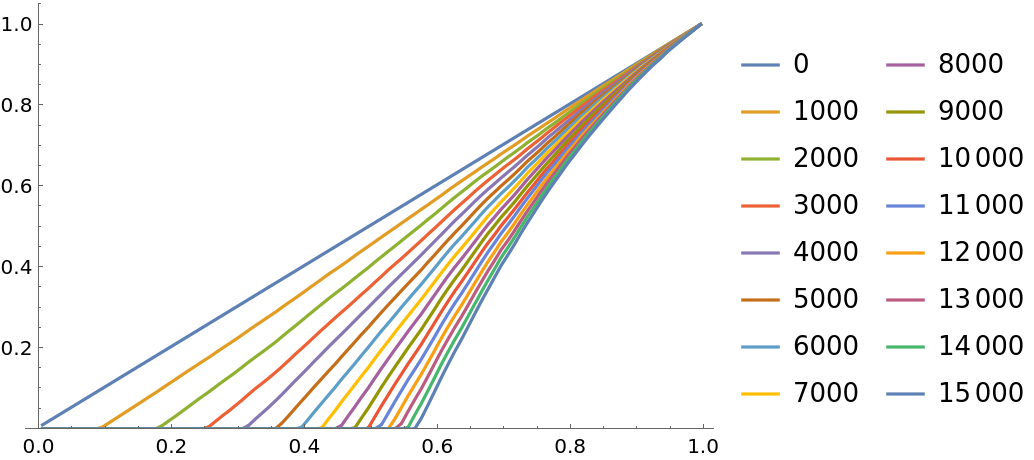
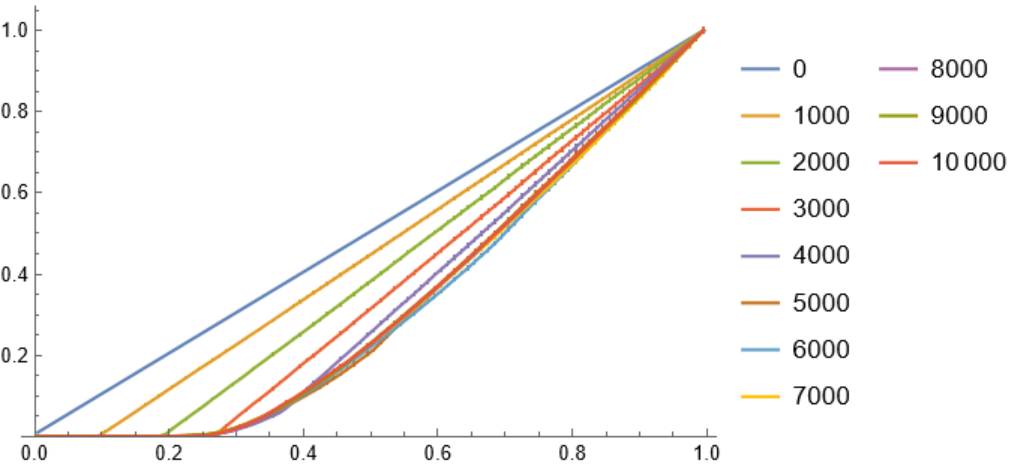
![i = ResourceFunction["PersianImmortals"][{1, 3}, 10^4, {0, 10^4, 1000}, "Strengthening" -> 1.0003, "Repetitions" -> 10];
ListLinePlot[Values[i["CDFs"]], PlotLegends -> Keys[i["CDFs"]], PlotRange -> {0, All}]](https://www.wolframcloud.com/obj/resourcesystem/images/5a8/5a89b235-c996-4bc0-8ee7-55d9e5c75e4a/18dd01279a16ee96.png)
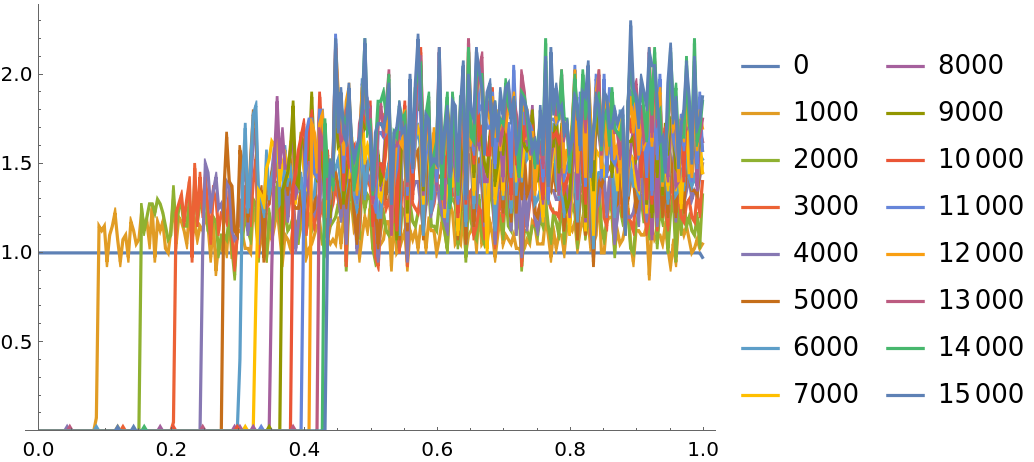
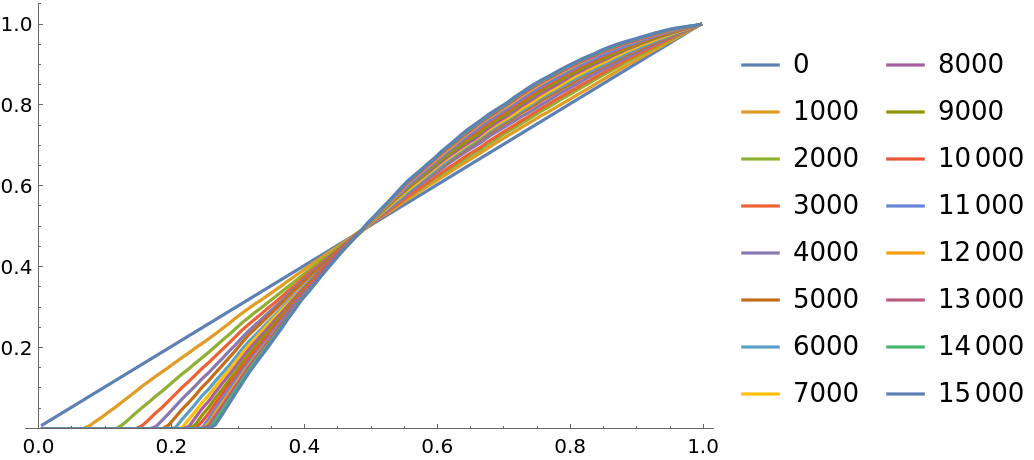
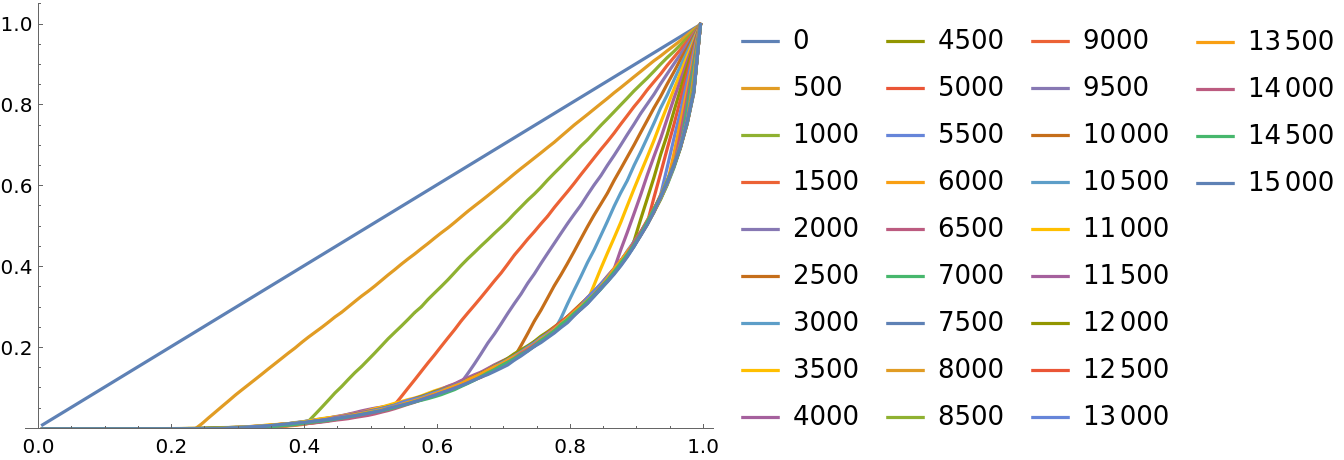
![i = ResourceFunction["PersianImmortals"][{1, 3}, 10^4, {0, 15000, 500}, "Strengthening" -> Scaled[0.0005], "Repetitions" -> 1];
ListLinePlot[Values[i["CDFs"]], PlotLegends -> Keys[i["CDFs"]], PlotRange -> {0, All}]](https://www.wolframcloud.com/obj/resourcesystem/images/5a8/5a89b235-c996-4bc0-8ee7-55d9e5c75e4a/525f95a678c21eb3.png)
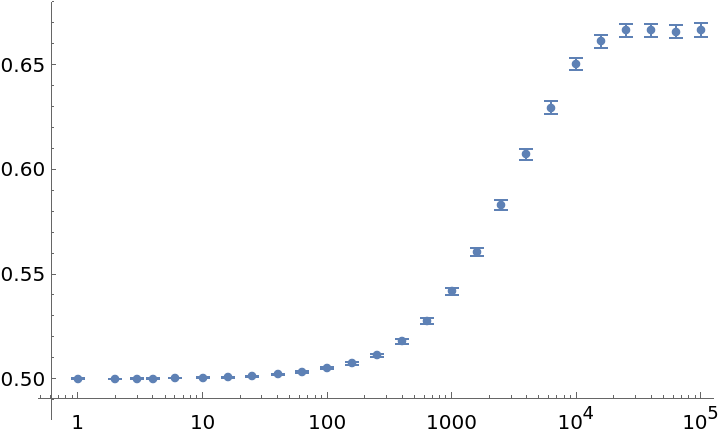
![ts = Round[10^Range[0, 5, 1/5]];
i = ResourceFunction["PersianImmortals"][{1, 2}, 10^4, {ts}, "Repetitions" -> 5];
widths = Differences[i["BinDelimiters"]];
meanstrengths = MapApply[Times]/*(# . widths &) /@ Values[i["PDFs"]];
ListLogLinearPlot[{Keys[i["PDFs"]], meanstrengths} // Transpose]](https://www.wolframcloud.com/obj/resourcesystem/images/5a8/5a89b235-c996-4bc0-8ee7-55d9e5c75e4a/79b78365c4492736.png)
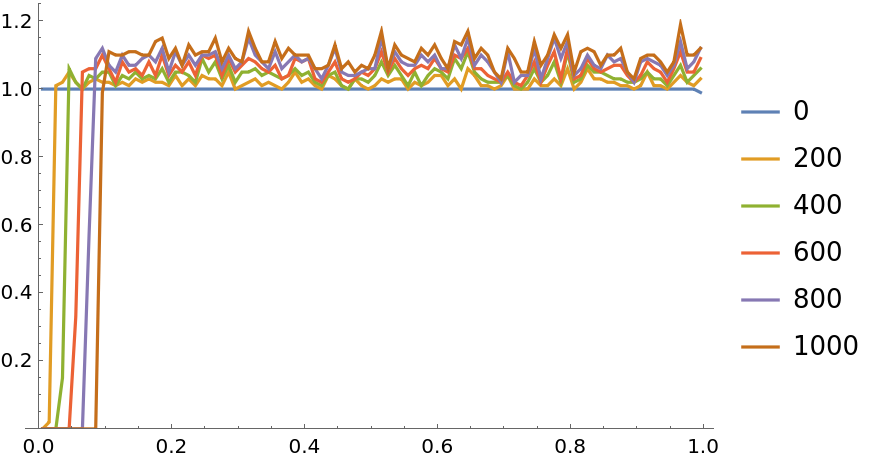
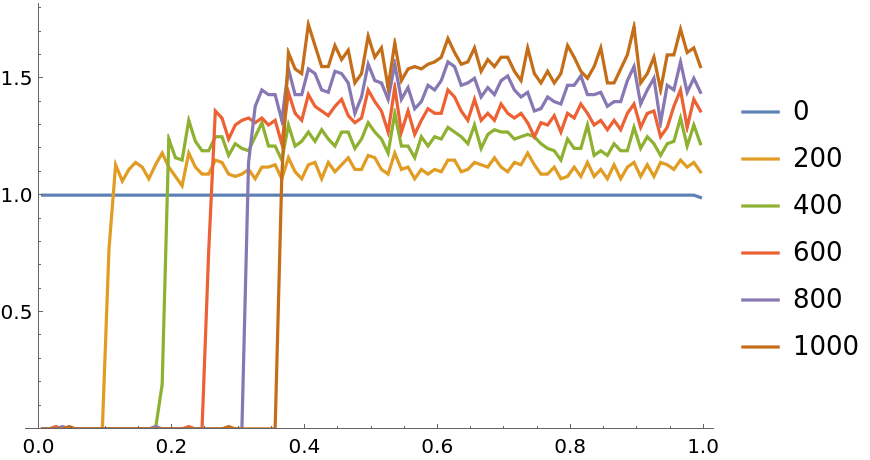
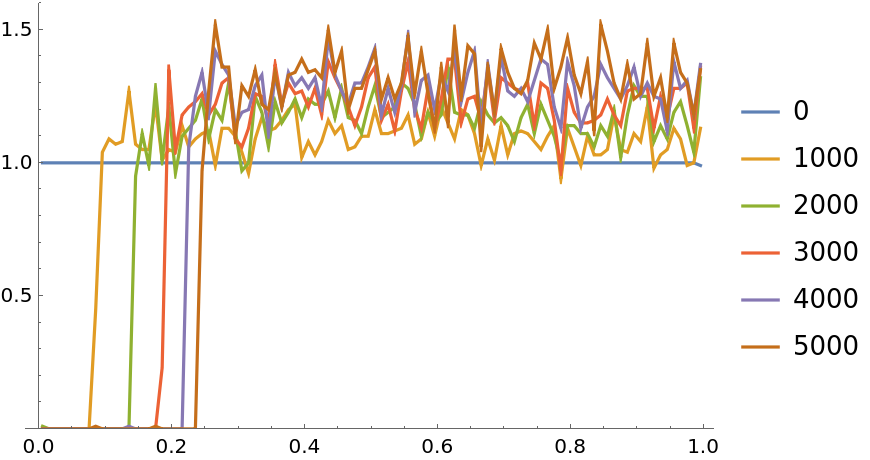
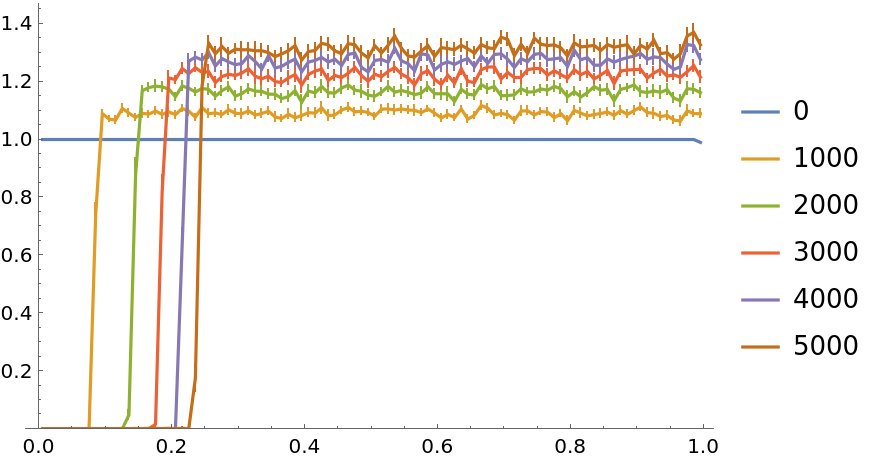
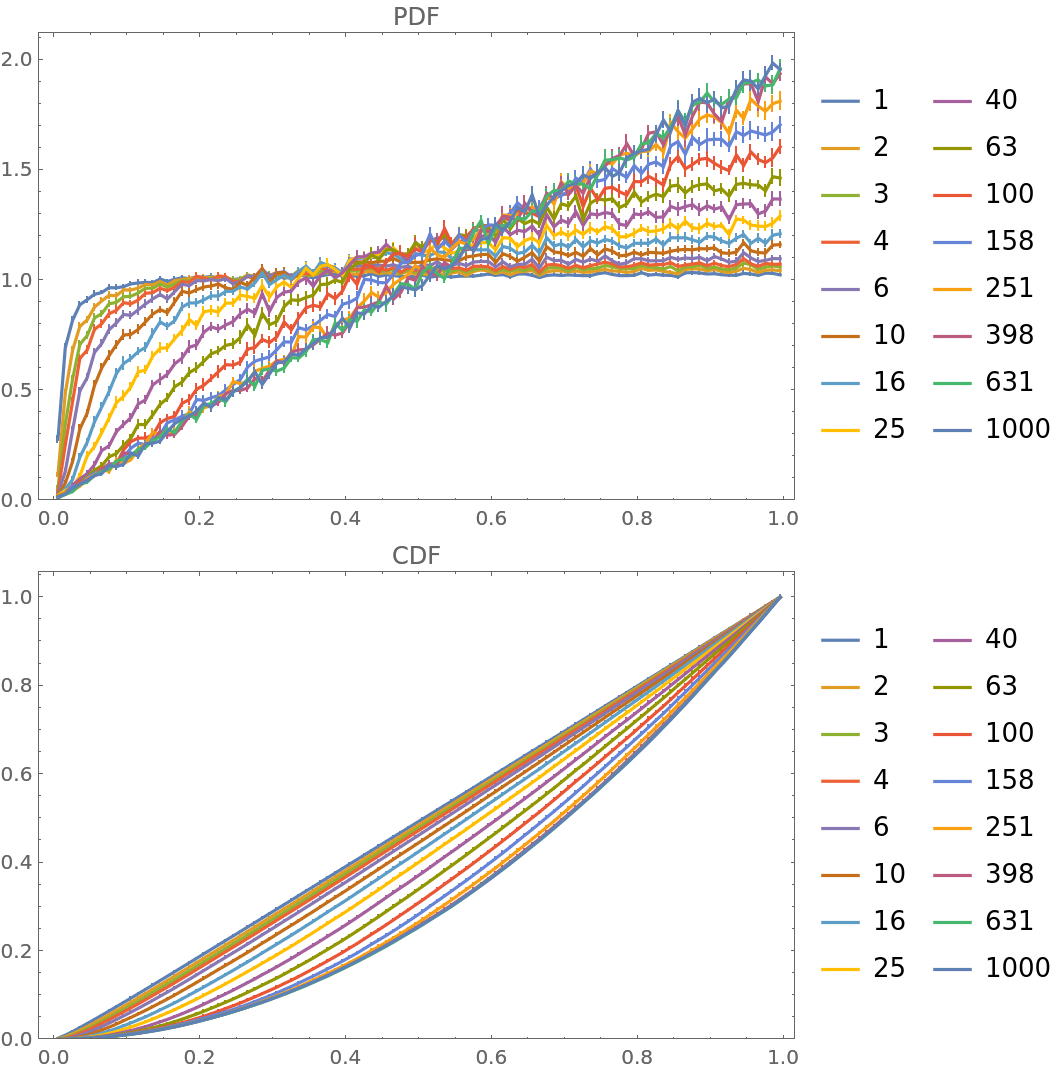
![ts = Round[10^Range[0, 3, 1/5]];
i = ResourceFunction[
"PersianImmortals"][{0, {UniformDistribution[{0, 0.01}]}}, 10^4, {ts}, "Repetitions" -> 15];
{
ListLinePlot[Values[i["PDFs"]], PlotLegends -> Keys[i["PDFs"]], PlotRange -> {0, All}, ImageSize -> 400, PlotLabel -> "PDF", Frame -> True],
ListLinePlot[Values[i["CDFs"]], PlotLegends -> Keys[i["CDFs"]], PlotRange -> {0, All}, ImageSize -> 400, PlotLabel -> "CDF", Frame -> True]
} // Column](https://www.wolframcloud.com/obj/resourcesystem/images/5a8/5a89b235-c996-4bc0-8ee7-55d9e5c75e4a/01481ffc229145f7.png)
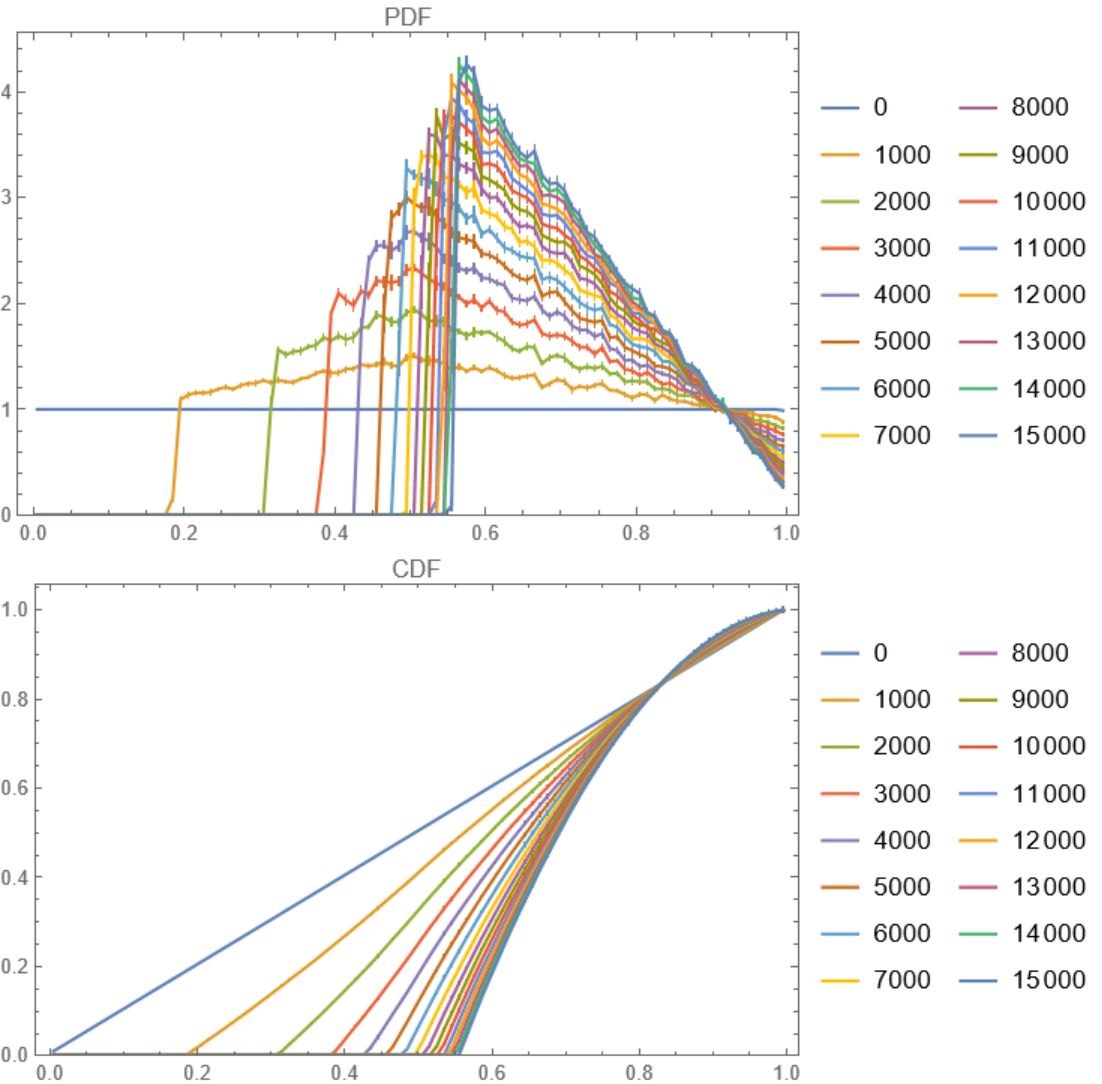
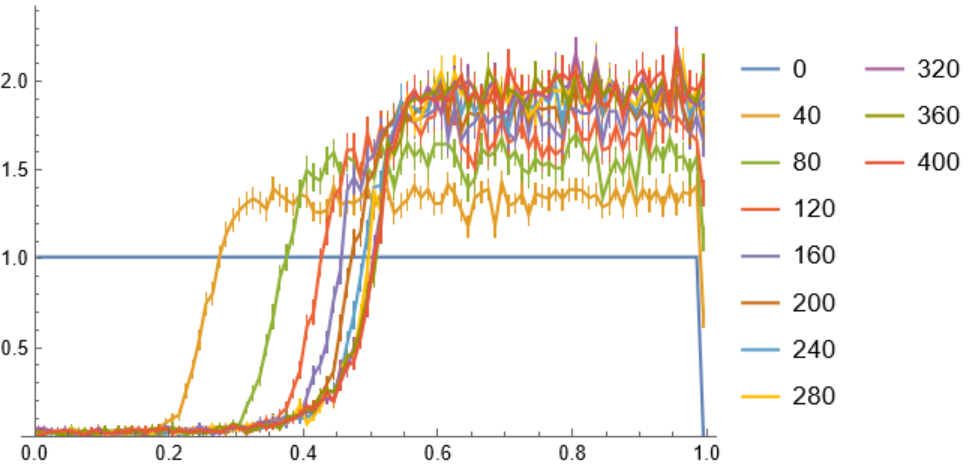
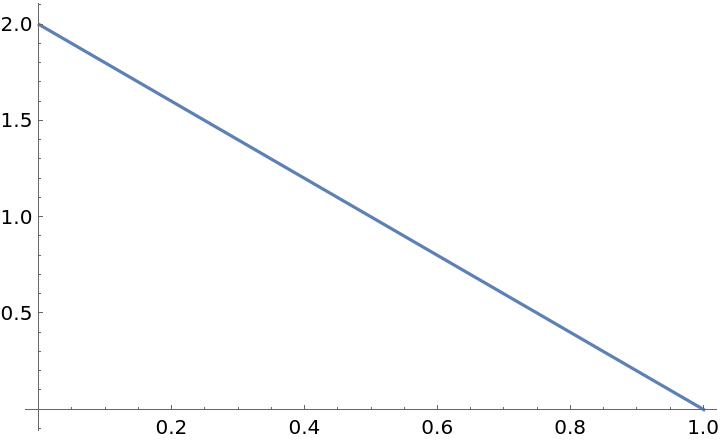
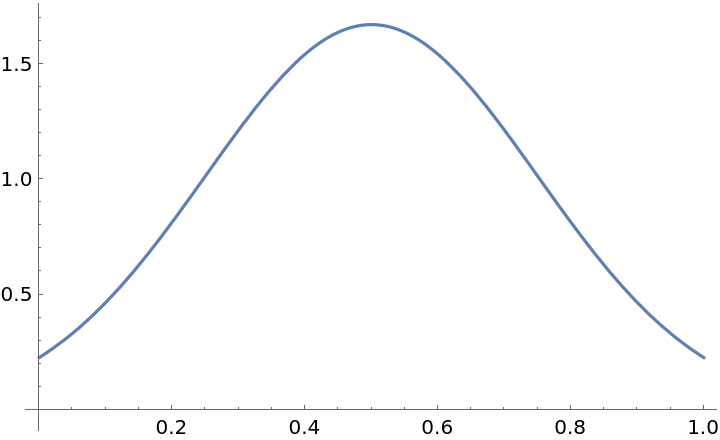
![dist = TriangularDistribution[{0, 1}];
i = ResourceFunction["PersianImmortals"][{2, 1}, 10^4, {0, 15000, 1000}, "Repetitions" -> 10, "NewFitness" -> dist];
{
ListLinePlot[Values[i["PDFs"]], PlotLegends -> Keys[i["PDFs"]], PlotRange -> {0, All}, ImageSize -> 400, PlotLabel -> "PDF", Frame -> True],
ListLinePlot[Values[i["CDFs"]], PlotLegends -> Keys[i["CDFs"]], PlotRange -> {0, All}, ImageSize -> 400, PlotLabel -> "CDF", Frame -> True]
} // Column](https://www.wolframcloud.com/obj/resourcesystem/images/5a8/5a89b235-c996-4bc0-8ee7-55d9e5c75e4a/0e79e4b7dd2c01e9.png)