Wolfram Function Repository
Instant-use add-on functions for the Wolfram Language
Function Repository Resource:
Compare two data samples using a specified test statistic
ResourceFunction["PermutationTest"][{data1,data2}] tests whether data1 and data2 differ according to a specified test statistic. | |
ResourceFunction["PermutationTest"][{data1,data2},"property"] returns the "property" of the test. | |
ResourceFunction["PermutationTest"][{data1,data2},{"prop1","prop2",…}] returns an association of values for the "propi". |
| "PValue" | two-tailed p-value relative to the observed statistic |
| "PValueRight" | one-tailed p-value for measurements greater than the observed statistic |
| "PValueLeft" | one-tailed p-value for measurements smaller than the observed statistic |
| "OriginalTestStatistic" | test statistic calculated from the original samples |
| "TestStatisticValues" | test statistic values calculated for each permutation |
| "TestStaticticHistogram" | Histogram of the test statistic values with the original test statistic represented by an infinite line |
| "PermutationCount" | number of permutations used in the test |
| All | Association containing all permutation test data |
| "TestStatisticFunction" | Function[{d1,d2},Mean[d1]-Mean[d2]] | statistical function used to compare the data |
| "PermutationCount" | 10000 | number of permutations used in the test |
| RandomSeeding | Automatic | seeding value for the random generation of permutations |
Generate some data:
| In[1]:= |
Test whether their means differ statistically, by calculating a p-value:
| In[2]:= |
| Out[2]= |
Generate many properties for the permutation test:
| In[3]:= |
| Out[3]= |  |
Retrieve the two-tailed and both one-tailed p-values for a given test:
| In[4]:= |
| Out[4]= |
The "TestStatisticValues" property returns the test statistic calculated for each permutation:
| In[5]:= |
| Out[5]= |  |
Retrieve a Histogram representing the distribution of test statistic values for each permutation. The red line represents the original test statistic:
| In[6]:= |
| Out[6]= | 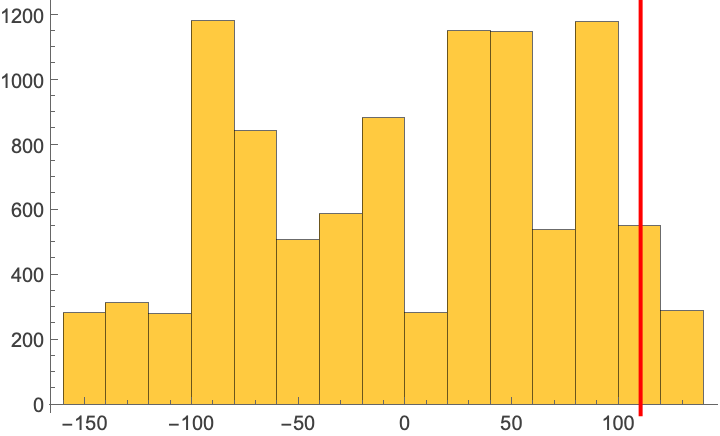 |
Use All to retrieve a summary Association containing all test data:
| In[7]:= |
| Out[7]= | 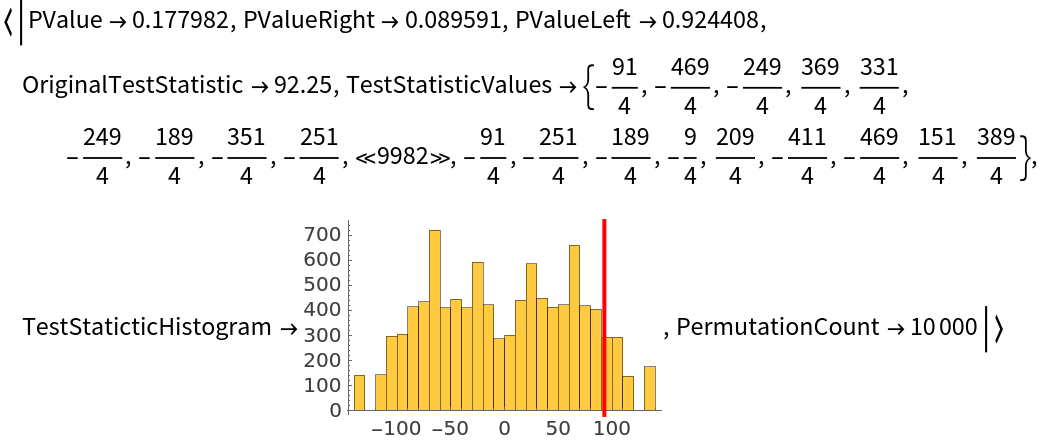 |
Use the "OriginalTestStatistic" property to retrieve the test statistic applied on the given data samples:
| In[8]:= | ![data1 = {320, 480, 290, 350};
data2 = {180, 260, 220, 275};
ResourceFunction[
"PermutationTest"][{data1, data2}, "OriginalTestStatistic"]](https://www.wolframcloud.com/obj/resourcesystem/images/911/911f65a5-c2bf-4e4a-8af2-beaa5d33dcf3/3474182d6577150e.png) |
| Out[10]= |
Notice how it maches with the mean difference:
| In[11]:= |
| Out[11]= |
Specify the test statistic of interest:
| In[12]:= |
| Out[12]= |
Change the number of permutations performed:
| In[13]:= |
| Out[13]= |
Specify a RandomSeeding value in order to have the same set of permutations for each test:
| In[14]:= |
| Out[14]= |
Setting RandomSeeding to Automatic will create different permutations for each test, leading to different test results:
| In[15]:= |
| Out[15]= |
TTest assumes that the data is normally distributed:
| In[16]:= | ![data1 = RandomVariate[ParetoDistribution[1, 2], 50];
data2 = RandomVariate[ParetoDistribution[3, 2], 50];
TTest[{data1, data2}]](https://www.wolframcloud.com/obj/resourcesystem/images/911/911f65a5-c2bf-4e4a-8af2-beaa5d33dcf3/18504ac2bbb8f176.png) |
| Out[18]= |
On the other hand, PermutationTest does not make assumptions about the data distribution:
| In[19]:= |
| Out[19]= |
Retrieve data on tennis match statistics:
| In[21]:= |
| Out[21]= | 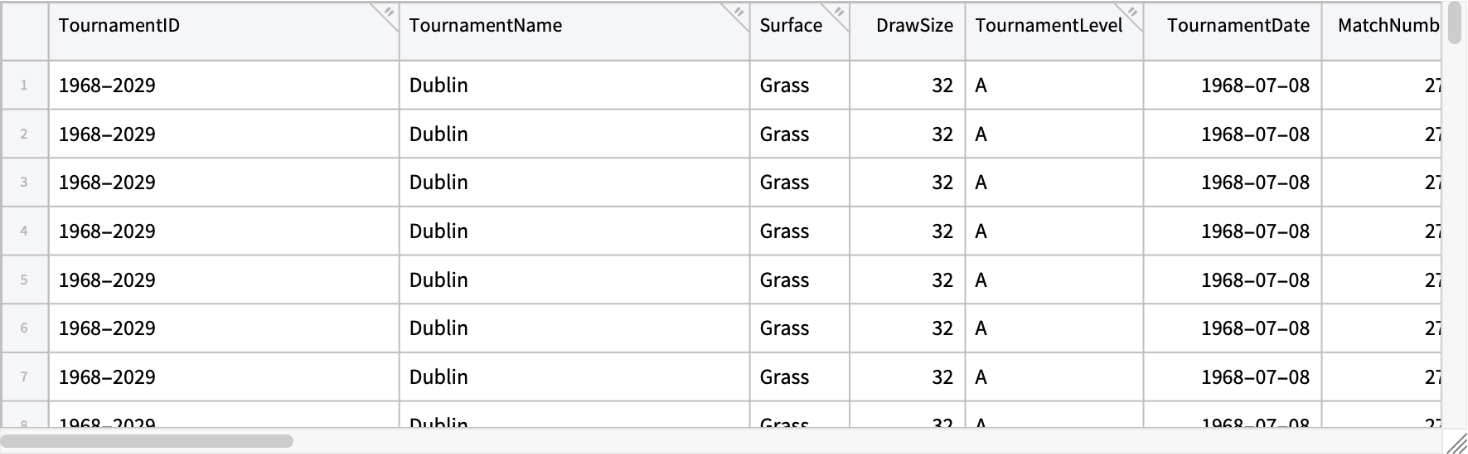 |
Select valid entries:
| In[22]:= | ![validTab = Select[data, And @@ NumericQ /@ {#W1stServeIn, #WServePoints, #L1stServeIn, #LServePoints} && (#WServePoints > 0 && #LServePoints > 0) &]](https://www.wolframcloud.com/obj/resourcesystem/images/911/911f65a5-c2bf-4e4a-8af2-beaa5d33dcf3/51e3a0b0f4764760.png) |
| Out[22]= | 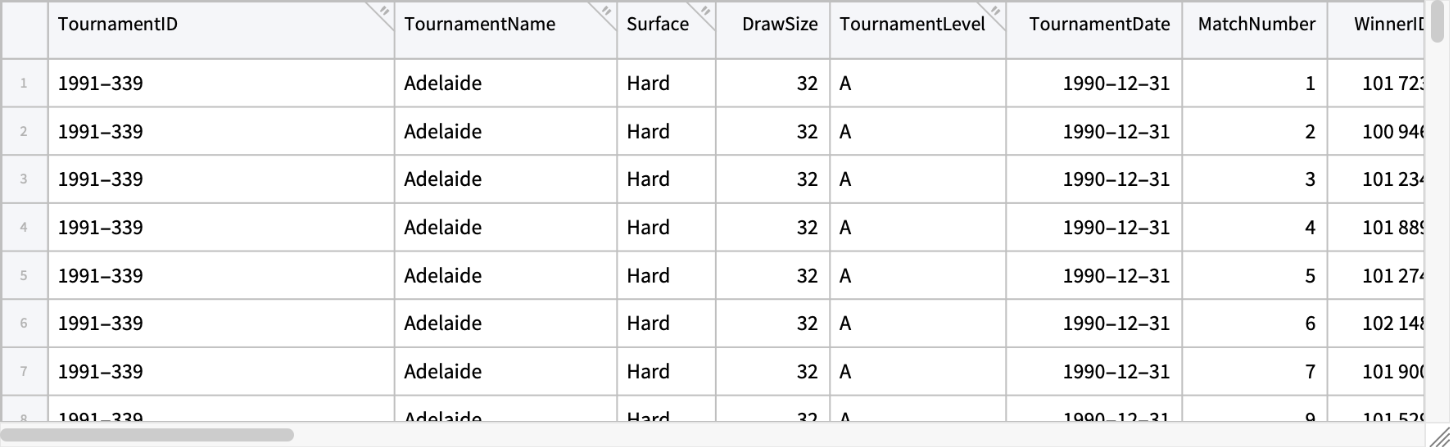 |
Calculate the percentage of first-serves for winners and losers for each match:
| In[23]:= |
| Out[23]= |  |
Check how the winners' first-serve percentage is statistically higher than that of the losers:
| In[24]:= | ![AbsoluteTiming[
ResourceFunction[
"PermutationTest"][{Normal@statWinners, Normal@statLosers}, "PermutationCount" -> 300]]](https://www.wolframcloud.com/obj/resourcesystem/images/911/911f65a5-c2bf-4e4a-8af2-beaa5d33dcf3/19637f5c2224b63d.png) |
| Out[24]= |
Wolfram Language 13.2 (December 2022) or above
This work is licensed under a Creative Commons Attribution 4.0 International License