Wolfram Function Repository
Instant-use add-on functions for the Wolfram Language
Function Repository Resource:
Test if a graph is periodic
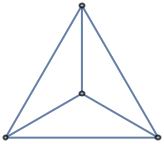 | Periodic |
 | Not periodic |
Test whether a undirected graph is periodic:
| In[1]:= | ![ResourceFunction["PeriodicGraphQ"][\!\(\*
GraphicsBox[
NamespaceBox["NetworkGraphics",
DynamicModuleBox[{Typeset`graph = HoldComplete[
Graph[{1, 2, 3, 4}, {Null,
SparseArray[
Automatic, {4, 4}, 0, {1, {{0, 3, 6, 9, 12}, {{2}, {3}, {4}, {1}, {3}, {4}, {
1}, {2}, {4}, {1}, {2}, {3}}}, Pattern}]}, {GraphLayout -> "StarEmbedding", PerformanceGoal -> "Q", VertexShapeFunction -> {"Name"}}]], Typeset`boxes, Typeset`boxes$s2d = GraphicsGroupBox[{{
Directive[
Opacity[0.7],
Hue[0.6, 0.7, 0.5]],
LineBox[{{
DynamicLocation["VertexID$1", Automatic, Center],
DynamicLocation["VertexID$2", Automatic, Center]}, {
DynamicLocation["VertexID$1", Automatic, Center],
DynamicLocation["VertexID$3", Automatic, Center]}, {
DynamicLocation["VertexID$1", Automatic, Center],
DynamicLocation["VertexID$4", Automatic, Center]}, {
DynamicLocation["VertexID$2", Automatic, Center],
DynamicLocation["VertexID$3", Automatic, Center]}, {
DynamicLocation["VertexID$2", Automatic, Center],
DynamicLocation["VertexID$4", Automatic, Center]}, {
DynamicLocation["VertexID$3", Automatic, Center],
DynamicLocation["VertexID$4", Automatic, Center]}}]}, {
Directive[
Hue[0.6, 0.2, 0.8],
EdgeForm[
Directive[
GrayLevel[0],
Opacity[0.7]]]],
TagBox[
InsetBox[
BoxData[
FormBox[
PaneBox["1", Alignment -> Center, ImageMargins -> 2], TraditionalForm]], {0., 0.}, BaseStyle -> "Graphics"], "DynamicName", BoxID -> "VertexID$1"],
TagBox[
InsetBox[
BoxData[
FormBox[
PaneBox["2", Alignment -> Center, ImageMargins -> 2], TraditionalForm]], {
0.8660254037844389, -0.5000000000000012}, BaseStyle -> "Graphics"], "DynamicName", BoxID -> "VertexID$2"],
TagBox[
InsetBox[
BoxData[
FormBox[
PaneBox["3", Alignment -> Center, ImageMargins -> 2], TraditionalForm]], {1.8369701987210297`*^-16, 1.}, BaseStyle -> "Graphics"], "DynamicName", BoxID -> "VertexID$3"],
TagBox[
InsetBox[
BoxData[
FormBox[
PaneBox["4", Alignment -> Center, ImageMargins -> 2], TraditionalForm]], {-0.8660254037844386, -0.49999999999999917`}, BaseStyle -> "Graphics"], "DynamicName", BoxID -> "VertexID$4"]}}], $CellContext`flag},
TagBox[
DynamicBox[GraphComputation`NetworkGraphicsBox[
3, Typeset`graph, Typeset`boxes, $CellContext`flag], {CachedValue :> Typeset`boxes, SingleEvaluation -> True, SynchronousUpdating -> False, TrackedSymbols :> {$CellContext`flag}},
ImageSizeCache->{{7.105427357601002*^-15, 89.}, {-45.100254825280246`,
38.48697357528026}}],
MouseAppearanceTag["NetworkGraphics"]],
AllowKernelInitialization->False,
UnsavedVariables:>{$CellContext`flag}]],
DefaultBaseStyle->{"NetworkGraphics", FrontEnd`GraphicsHighlightColor -> Hue[0.8, 1., 0.6]},
FrameTicks->None]\)]](https://www.wolframcloud.com/obj/resourcesystem/images/ea8/ea8b2272-6983-41d2-810d-575fee9bf16d/7946eb455a51714a.png) |
| Out[1]= |
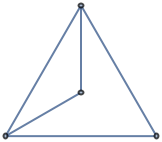
PeriodicGraphQ works with undirected graphs:
| In[2]:= | ![ResourceFunction["PeriodicGraphQ"][\!\(\*
GraphicsBox[
NamespaceBox["NetworkGraphics",
DynamicModuleBox[{Typeset`graph = HoldComplete[
Graph[{1, 2, 3, 4, 5}, {Null,
SparseArray[
Automatic, {5, 5}, 0, {1, {{0, 4, 8, 12, 16, 20}, {{2}, {3}, {4}, {5}, {1}, {
3}, {4}, {5}, {1}, {2}, {4}, {5}, {1}, {2}, {3}, {5}, {
1}, {2}, {3}, {4}}}, Pattern}]}, {GraphLayout -> {"CircularEmbedding", "OptimalOrder" -> False}}]]},
TagBox[GraphicsGroupBox[
GraphicsComplexBox[{{-0.9510565162951538, 0.3090169943749484}, {-0.5877852522924726, -0.8090169943749468}, {0.5877852522924738, -0.8090169943749481}, {
0.9510565162951533, 0.30901699437494634`}, {-7.044813998280222*^-16, 1.}}, {
{Hue[0.6, 0.7, 0.5], Opacity[0.7], Arrowheads[0.], ArrowBox[{{1, 2}, {1, 3}, {1, 4}, {1, 5}, {2, 3}, {2, 4}, {
2, 5}, {3, 4}, {3, 5}, {4, 5}}, 0.021812234931106983`]},
{Hue[0.6, 0.2, 0.8], EdgeForm[{GrayLevel[0], Opacity[0.7]}], DiskBox[1, 0.021812234931106983], DiskBox[2, 0.021812234931106983], DiskBox[3, 0.021812234931106983], DiskBox[4, 0.021812234931106983], DiskBox[5, 0.021812234931106983]}}]],
MouseAppearanceTag["NetworkGraphics"]],
AllowKernelInitialization->False]],
DefaultBaseStyle->"NetworkGraphics",
FormatType->TraditionalForm,
FrameTicks->None,
ImageSize->{77.50000000000077, Automatic}]\)]](https://www.wolframcloud.com/obj/resourcesystem/images/ea8/ea8b2272-6983-41d2-810d-575fee9bf16d/3808cc48029e0d1e.png) |
| Out[2]= |
Weighted graphs:
| In[3]:= | ![ResourceFunction["PeriodicGraphQ"][\!\(\*
GraphicsBox[
NamespaceBox["NetworkGraphics",
DynamicModuleBox[{Typeset`graph = HoldComplete[
Graph[{1, 2, 3, 4, 5}, {Null, SparseArray[
Automatic, {5, 5}, 0, {1, {{0, 3, 6, 8, 9, 10}, {{2}, {3}, {4}, {2}, {3}, {
5}, {4}, {5}, {5}, {5}}}, {1, 1, 1, 1, 1, 1, 1, 1, 1, 1}}]}, {FormatType -> TraditionalForm, GraphLayout -> {"Dimension" -> 2}, VertexLabels -> {
Placed[Automatic, Center]}, VertexSize -> {0.25}, VertexStyle -> {
GrayLevel[1]}}]]},
TagBox[GraphicsGroupBox[{
{Hue[0.6, 0.7, 0.5], Opacity[0.7], Arrowheads[0.], ArrowBox[{{0., 0.012484330888018924`}, {
0.011333771416589089`, 1.1666638939968836`}}, 0.10192290483023064`], ArrowBox[{{0., 0.012484330888018924`}, {0.5818822250328072, 0.5841484109973273}}, 0.10192290483023064`], ArrowBox[{{0., 0.012484330888018924`}, {1.1541843168018768`,
0.}}, 0.10192290483023064`], ArrowBox[
BezierCurveBox[{{0.011333771416589089`, 1.1666638939968836`}, {-0.18684105756379346`, 1.0962815719756591`}, {-0.3663390917212296, 1.1988433261781792`}, {-0.4132538528198191, 1.3309407689787274`}, {-0.14439391571122775`, 1.5944610769823941`}, {-0.013264036975934812`, 1.544906217419994}, {0.08567681402759109, 1.3633871669206583`}, {0.011333771416589089`, 1.1666638939968836`}},
SplineDegree->7], 0.10192290483023064`], ArrowBox[{{0.011333771416589089`, 1.1666638939968836`}, {
0.5818822250328072, 0.5841484109973273}}, 0.10192290483023064`], ArrowBox[{{0.011333771416589089`, 1.1666638939968836`}, {
1.1666848480058034`, 1.1548334540590575`}}, 0.10192290483023064`], ArrowBox[{{0.5818822250328072, 0.5841484109973273}, {
1.1541843168018768`, 0.}}, 0.10192290483023064`], ArrowBox[{{0.5818822250328072, 0.5841484109973273}, {
1.1666848480058034`, 1.1548334540590575`}}, 0.10192290483023064`], ArrowBox[{{1.1541843168018768`, 0.}, {1.1666848480058034`, 1.1548334540590575`}}, 0.10192290483023064`], ArrowBox[
BezierCurveBox[{{1.1666848480058034`, 1.1548334540590575`}, {1.096428457927411, 1.3530529650328658`}, {1.1990740340904533`, 1.532488387080747}, {1.3311868766939918`, 1.579333895788655}, {1.5945558474459913`, 1.3103582119248316`}, {1.5449381846459758`, 1.1792613301726174`}, {1.3633806566239384`, 1.0804177719107293`}, {1.1666848480058034`, 1.1548334540590575`}},
SplineDegree->7], 0.10192290483023064`]},
{GrayLevel[1], EdgeForm[{GrayLevel[0], Opacity[
0.7]}], {
DiskBox[{0., 0.012484330888018924`}, 0.10192290483023064], InsetBox["1", {0., 0.012484330888018924},
BaseStyle->"Graphics"]}, {
DiskBox[{0.011333771416589089`, 1.1666638939968836`}, 0.10192290483023064], InsetBox["2", {0.011333771416589089, 1.1666638939968836},
BaseStyle->"Graphics"]}, {
DiskBox[{0.5818822250328072, 0.5841484109973273}, 0.10192290483023064], InsetBox["3", {0.5818822250328072, 0.5841484109973273},
BaseStyle->"Graphics"]}, {
DiskBox[{1.1541843168018768`, 0.}, 0.10192290483023064], InsetBox["4", {1.1541843168018768, 0.},
BaseStyle->"Graphics"]}, {
DiskBox[{1.1666848480058034`, 1.1548334540590575`}, 0.10192290483023064], InsetBox["5", {1.1666848480058034, 1.1548334540590575},
BaseStyle->"Graphics"]}}}],
MouseAppearanceTag["NetworkGraphics"]],
AllowKernelInitialization->False]],
DefaultBaseStyle->"NetworkGraphics",
FormatType->TraditionalForm,
FrameTicks->None,
ImageSize->{131.4000000000001, Automatic}]\)]](https://www.wolframcloud.com/obj/resourcesystem/images/ea8/ea8b2272-6983-41d2-810d-575fee9bf16d/27b9074da1710043.png) |
| Out[3]= |
Multigraphs:
| In[4]:= | ![ResourceFunction["PeriodicGraphQ"][\!\(\*
GraphicsBox[
NamespaceBox["NetworkGraphics",
DynamicModuleBox[{Typeset`graph = HoldComplete[
Graph[{1, 2, 3, 4, 5}, {Null, {{1, 2}, {1, 2}, {1, 3}, {1, 4}, {1, 5}, {2, 3}, {
2, 4}, {2, 5}, {3, 4}, {3, 5}, {4, 5}}}]]},
TagBox[GraphicsGroupBox[GraphicsComplexBox[CompressedData["
1:eJwBYQKe/SFib1JlAgAAACUAAAACAAAAQi1iQYmM7z/ADbItNhaKPyjvH5ti
Cs8/AAAAAAAAAABYs3s6/j/zPx1e0QO5Lec/AAAAAAAAAAAogh5k6nfmP5xm
MyYp+OI/6L+sk5xm8j91FCedNQ3tPxC0ZPk1eZC/K3gzxyJq7D8Quso6OXOX
v1cFBUeRxOs/kBYBmUhwnb8ApEYk4xzrPwhg4TBsNqG/NdK8pntz6j/gbH1g
+jKjv+NvfRu/yOk/4OIjwKGspL/w0YyZEh3pP1AYxbWCoqW/B0YDxttw6D9I
f9asCxSmv+TKJN3D2d0/qICb5N2vqL9KLduADYHcP5CpSaTLnKi/rOliiNoo
2z/wSUV3KQWovzu7+L720dk/ULYTJVHppr/BmWQpLX3YP4DE5rzqSaW/XpvF
jUcr1z+wjxsy7Cejv2SCGvwN3dU/QAibypiEoL9Os81XRpPUP9AP5b4Aw5q/
Y09DvH4F7T9oC9/qDeejP9nnHOqaYOw/uIsHViYKpz9dW0chfrnrPygTiL15
rak/Ktx3U4sQ6z/4R1NIeM+rP23LrYgmZuo/wDmAsN5urT81tPijtLrpP2DN
sQK3iq4/ZpK8J5sO6T8ALbYvWSKvP5nDl/k/Yug/GAQIcGs1rz8Ixk1EjLzd
P7gCQziZmaw/Nq46nR5k3D/AmzFBECisP1ByWZnFDNs/UGaQSy8yqz+trdqC
TLfZP1Dw6euHuKk/FwrHh31k2D9g4028+bunP2hHSkIhFdc/sA7t17E9pT/A
Ye1B/snVP3Dg0SgqP6I/KikGltiD1D/Quj0QUYSdP1chHV8=
"], {
{Hue[0.6, 0.7, 0.5], Opacity[0.7], Arrowheads[0.], ArrowBox[
BezierCurveBox[{1, {
0.6162994546370129, -0.11587655423888106`}, 2}], 0.015799942848996912`], ArrowBox[
BezierCurveBox[{1, {0.6121102681171386, 0.12861423207006986`}, 2}], 0.015799942848996912`], ArrowBox[{1, 3}, 0.015799942848996912`], ArrowBox[{1, 4}, 0.015799942848996912`], ArrowBox[{1, 5}, 0.015799942848996912`], ArrowBox[{2, 3}, 0.015799942848996912`], ArrowBox[{2, 4}, 0.015799942848996912`], ArrowBox[{2, 5}, 0.015799942848996912`], ArrowBox[{3, 4}, 0.015799942848996912`], ArrowBox[{3, 5}, 0.015799942848996912`], ArrowBox[{4, 5}, 0.015799942848996912`]},
{Hue[0.6, 0.2, 0.8], EdgeForm[{GrayLevel[0], Opacity[0.7]}], DiskBox[1, 0.015799942848996912], DiskBox[2, 0.015799942848996912], DiskBox[3, 0.015799942848996912], DiskBox[4, 0.015799942848996912], DiskBox[5, 0.015799942848996912]}}]],
MouseAppearanceTag["NetworkGraphics"]],
AllowKernelInitialization->False]],
DefaultBaseStyle->"NetworkGraphics",
FormatType->TraditionalForm,
FrameTicks->None,
ImageSize->{73.50000000000031, Automatic}]\)]](https://www.wolframcloud.com/obj/resourcesystem/images/ea8/ea8b2272-6983-41d2-810d-575fee9bf16d/6dd566698315ae8a.png) |
| Out[4]= |
The Foster 42A graph is periodic:
| In[5]:= |
| Out[5]= | 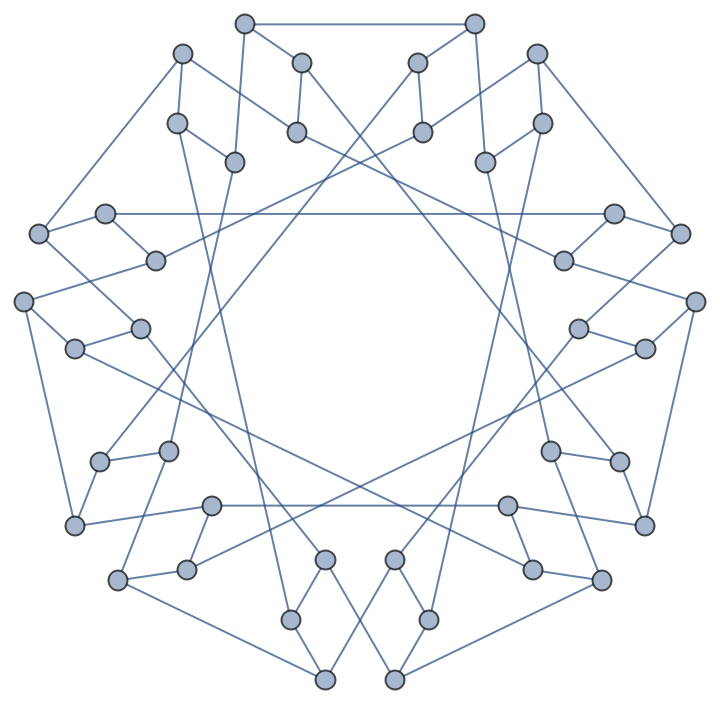 |
| In[6]:= |
| Out[6]= |
Wolfram Language 13.0 (December 2021) or above
This work is licensed under a Creative Commons Attribution 4.0 International License