Wolfram Function Repository
Instant-use add-on functions for the Wolfram Language
Function Repository Resource:
Make Pareto principle adherence plots
ResourceFunction["ParetoPrinciplePlot"][vec] plots the normalized cumulative sum of the reverse-sorted list vec. |
| "ParetoGridLines" | Automatic | show Pareto-specific grid lines. |
| "Tooltip" | True | whether automatic Tooltip wrappers should be used |
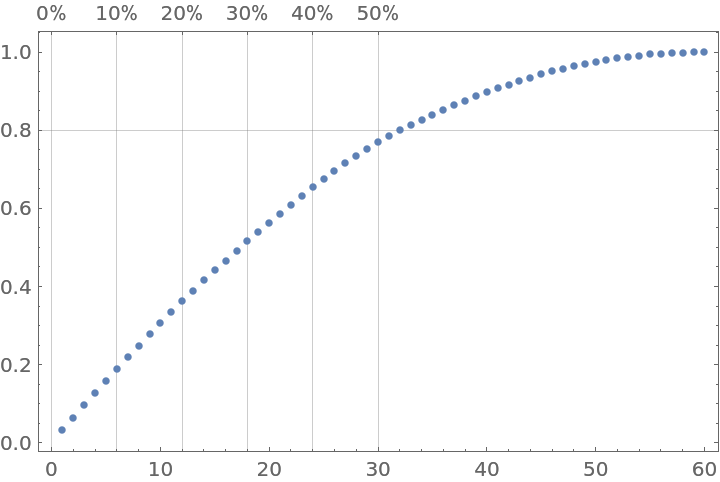
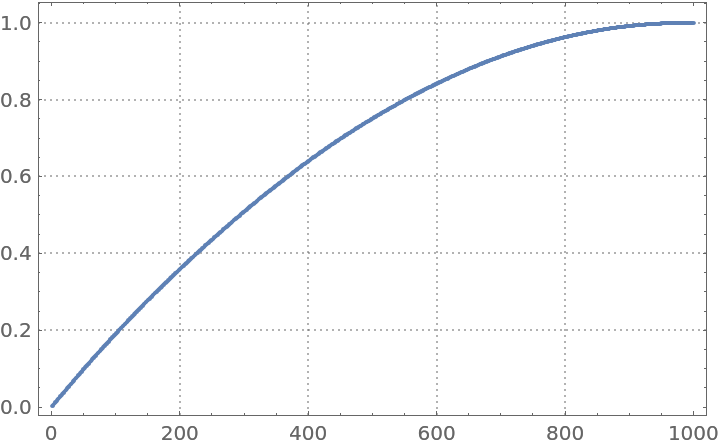
Pareto principle plot for a numerical vector:
| In[1]:= |
|
| Out[2]= |
|
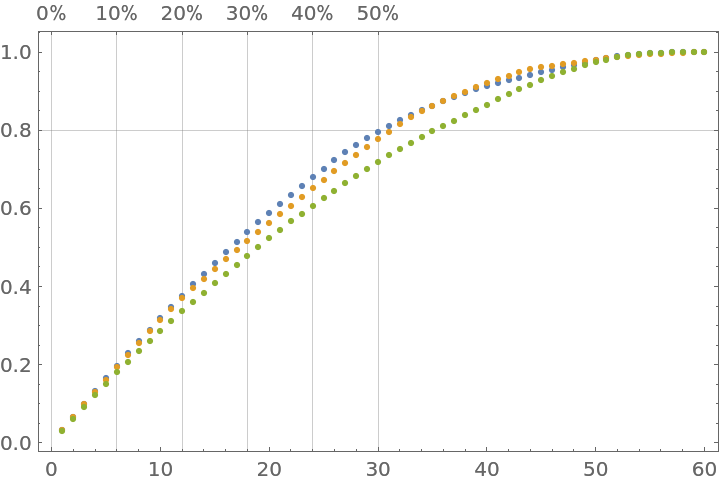
Pareto principle plot for a list of numerical vectors:
| In[3]:= |
|
| Out[4]= |
|
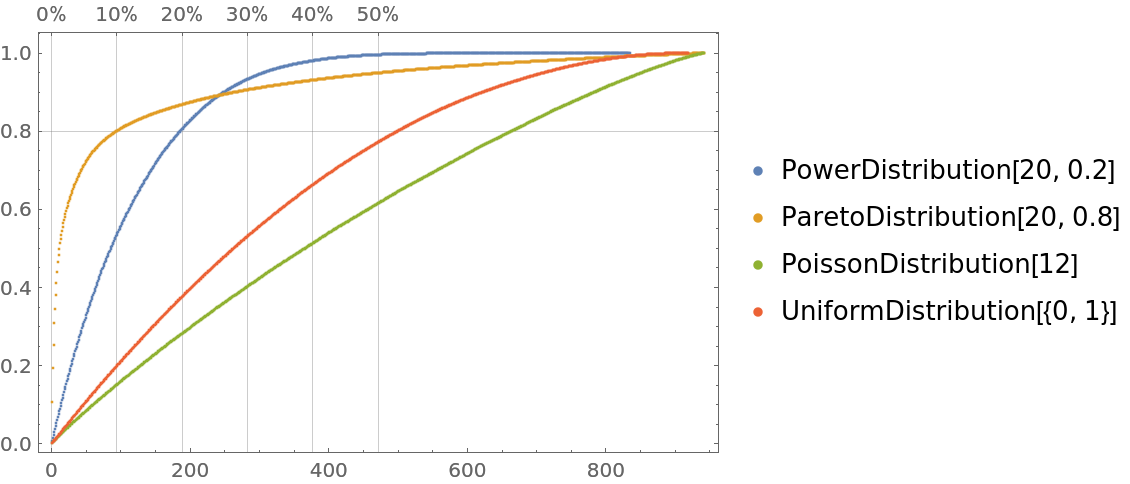
Plot a list of numerical vectors with tooltips:
| In[5]:= |
![dists = {PowerDistribution[20, 0.2], ParetoDistribution[20, 0.8], PoissonDistribution[12], UniformDistribution[]}; ResourceFunction[
"ParetoPrinciplePlot"][
Tooltip[RandomVariate[#, RandomInteger[{800, 1000}]], #] & /@ dists, PlotRange -> All, PlotLegends -> dists]](https://www.wolframcloud.com/obj/resourcesystem/images/874/874eb3ae-2c30-4919-9deb-e91dce200cc4/5593c0467e224e12.png)
|
| Out[5]= |
|
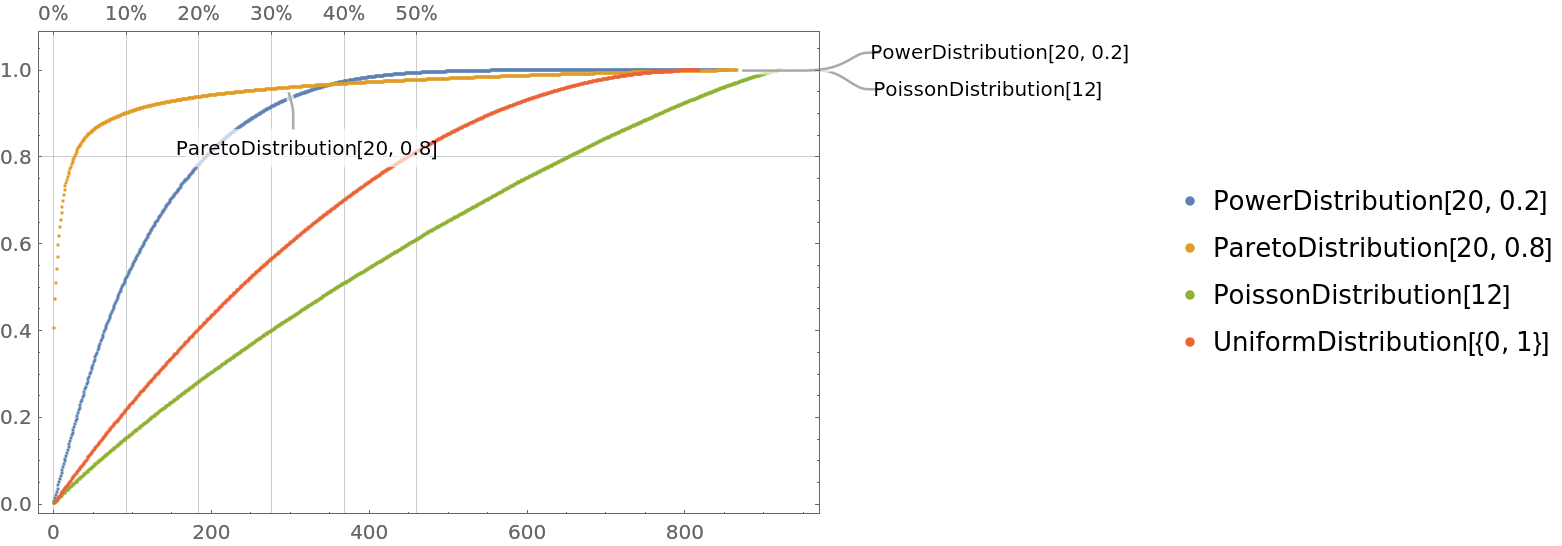
Numerical vectors with nested Tooltip and Callout specifications can be given; "wrapped" and "plain" vectors can be mixed:
| In[6]:= |
![data = Map[
Switch[#,
_ParetoDistribution,
Tooltip[
Callout[RandomVariate[#, RandomInteger[{800, 1000}]], #, {300, Below}], #], _UniformDistribution,
RandomVariate[#, RandomInteger[{800, 1000}]], _,
Callout[
Tooltip[RandomVariate[#, RandomInteger[{800, 1000}]], #], #]
] &,
dists];](https://www.wolframcloud.com/obj/resourcesystem/images/874/874eb3ae-2c30-4919-9deb-e91dce200cc4/129ae8edd4b11e1f.png)
|
| In[7]:= |
![dists = {PowerDistribution[20, 0.2], ParetoDistribution[20, 0.8], PoissonDistribution[12], UniformDistribution[]};
ResourceFunction["ParetoPrinciplePlot"][data, PlotLegends -> dists, ImageSize -> Large, PlotRange -> All]](https://www.wolframcloud.com/obj/resourcesystem/images/874/874eb3ae-2c30-4919-9deb-e91dce200cc4/5e1089ff7a42d752.png)
|
| Out[8]= |
|
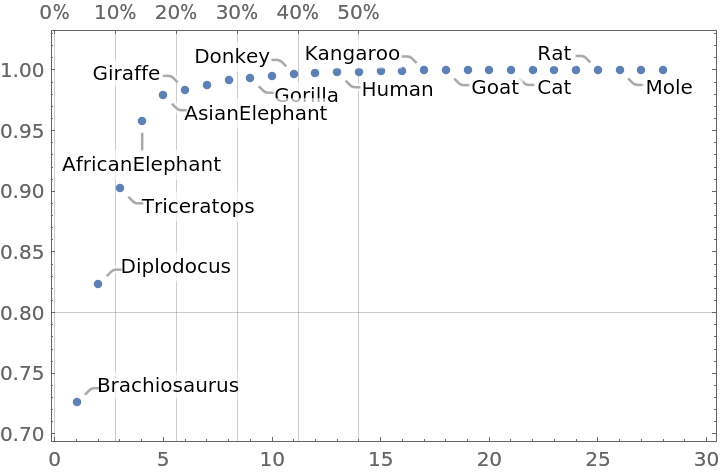
Plot an association with numerical values:
| In[9]:= |
![data = <|"Brachiosaurus" -> 87000, "Diplodocus" -> 11700, "Triceratops" -> 9400, "AfricanElephant" -> 6654, "AsianElephant" -> 2547, "Giraffe" -> 529, "Horse" -> 521, "Cow" -> 465, "Gorilla" -> 207, "Pig" -> 192, "Donkey" -> 187.1`, "Jaguar" -> 100, "Human" -> 62, "Sheep" -> 55.5`, "Chimpanzee" -> 52.16`, "GreyWolf" -> 36.33`, "Kangaroo" -> 35, "Goat" -> 27.66`, "PotarMonkey" -> 10, "RhesusMonkey" -> 6.8`, "Cat" -> 3.3`, "Rabbit" -> 2.5`, "MountainBeaver" -> 1.35`, "GuineaPig" -> 1.04`, "Rat" -> 0.28`, "Mole" -> 0.122`, "GoldenHamster" -> 0.12`, "Mouse" -> 0.023`|>;
ResourceFunction["ParetoPrinciplePlot"][data]](https://www.wolframcloud.com/obj/resourcesystem/images/874/874eb3ae-2c30-4919-9deb-e91dce200cc4/3590d7eb550cd94b.png)
|
| Out[10]= |
|
A data vector:
| In[11]:= |
|
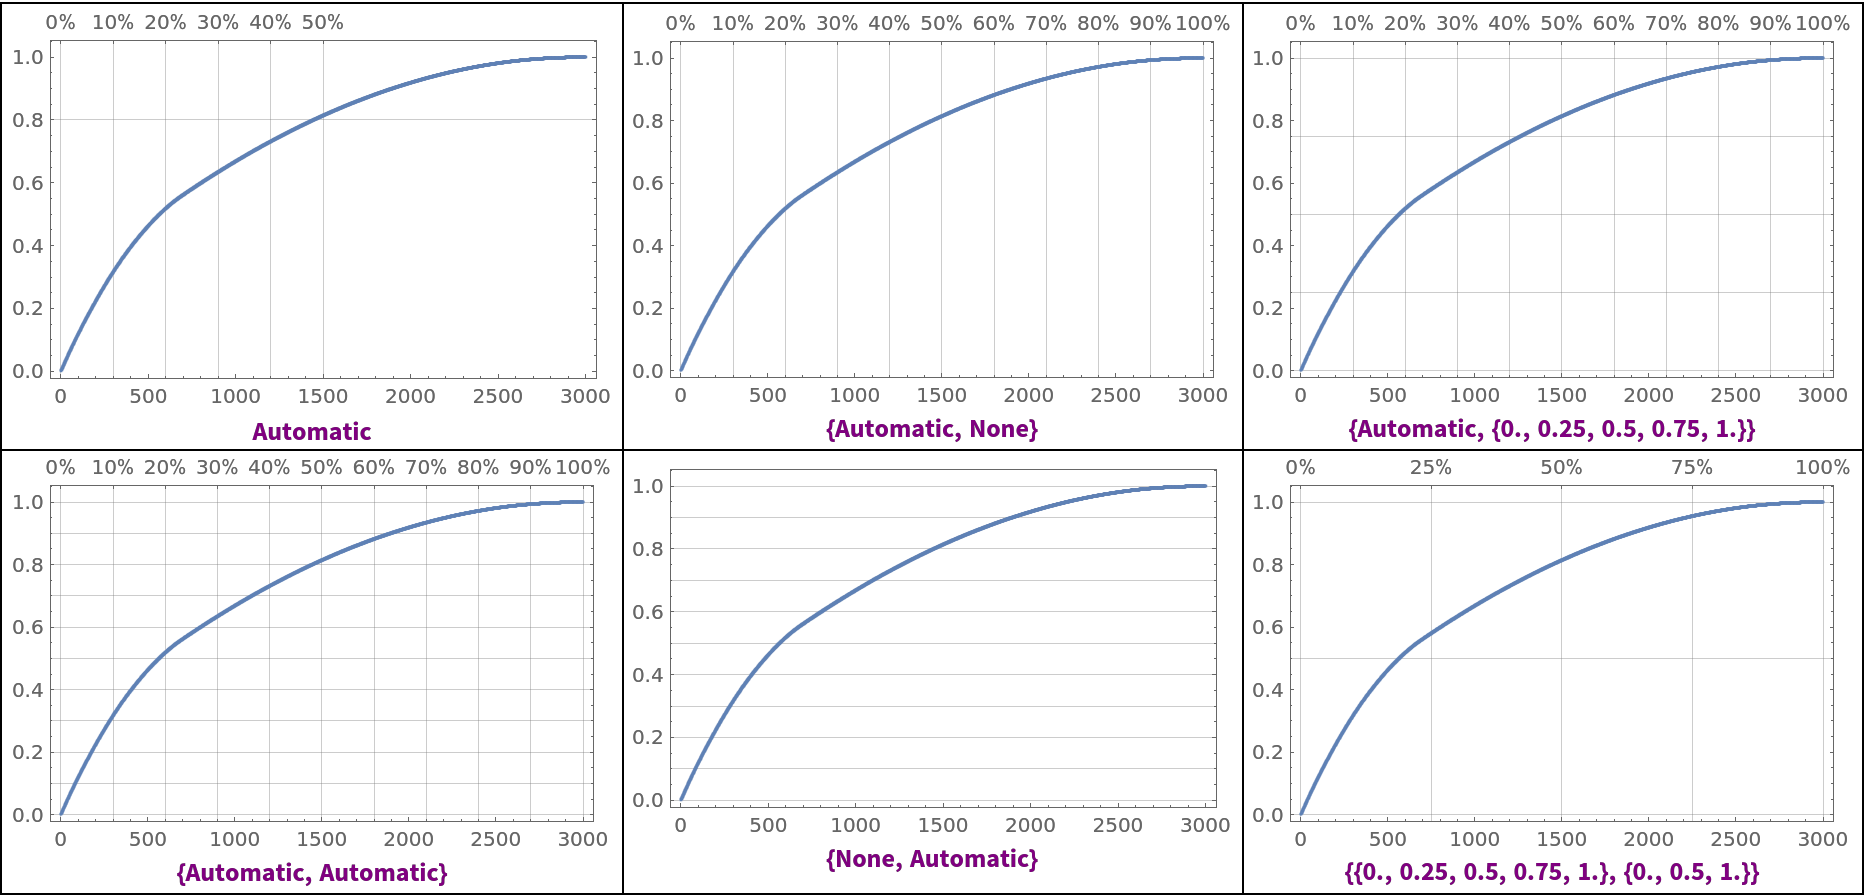
Pareto principle adherence plots with different Pareto grid lines specifications:
| In[12]:= |
![Multicolumn[
Map[Labeled[
ResourceFunction["ParetoPrinciplePlot"][data, ImageSize -> 300, "ParetoGridLines" -> #], Style[#, Purple, Bold]] &, {Automatic, {Automatic, Automatic}, {Automatic, None}, {None, Automatic}, {Automatic, Range[0, 1, 0.25]}, {Range[0, 1, 0.25], Range[0, 1, 0.5]}}], 3, Dividers -> All]](https://www.wolframcloud.com/obj/resourcesystem/images/874/874eb3ae-2c30-4919-9deb-e91dce200cc4/04f8591e437d6be9.png)
|
| Out[12]= |
|
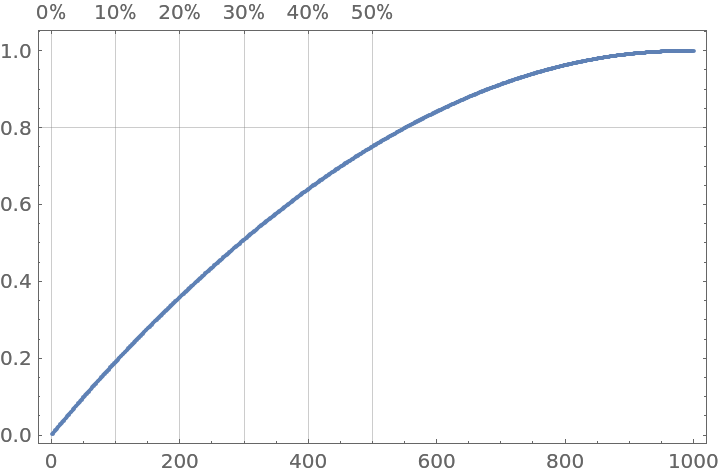
The option "ParetoGridLines" is overridden by the ListPlot option GridLines:
| In[13]:= |
|
| Out[13]= |
|
The option "Tooltip" takes Boolean values:
| In[14]:= |
|
| In[15]:= |
|
| Out[15]= |
|
Get the text of Shakespeare’s play Hamlet:
| In[16]:= |
|
Convert the text to lowercase and split it into words:
| In[17]:= |
![words = Select[
StringSplit[
ToLowerCase[text], {" ", ",", ".", ";", "?", "!", "...", "-"}], StringLength[#] > 0 &];
Length[words]](https://www.wolframcloud.com/obj/resourcesystem/images/874/874eb3ae-2c30-4919-9deb-e91dce200cc4/5b6a54a8be30c3b4.png)
|
| Out[18]= |
|
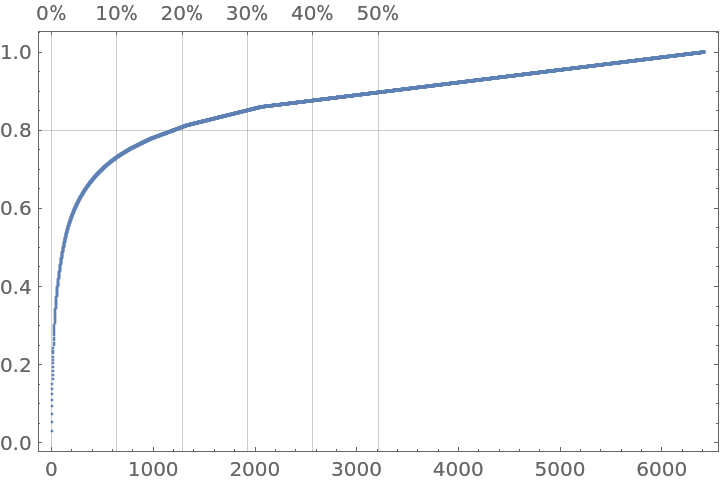
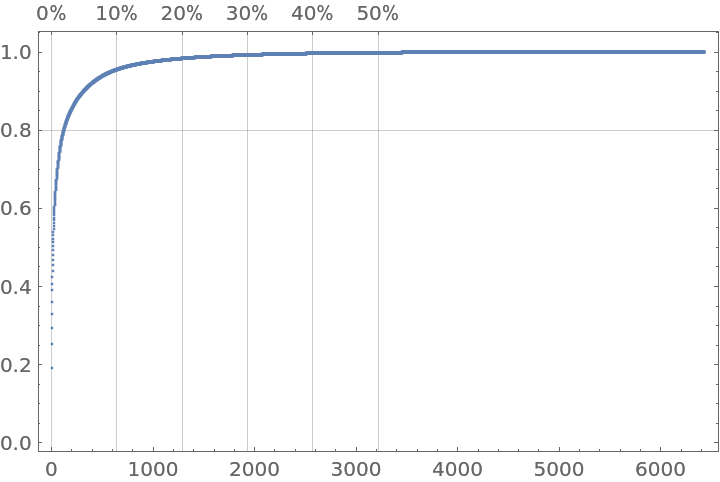
Plot the words' tally values:
| In[19]:= |
|
| Out[19]= |
|
In the preceding Pareto principle adherence plot, you can see a clear Pareto principle manifestation: ≈15% of the words correspond to ≈80% of the text.
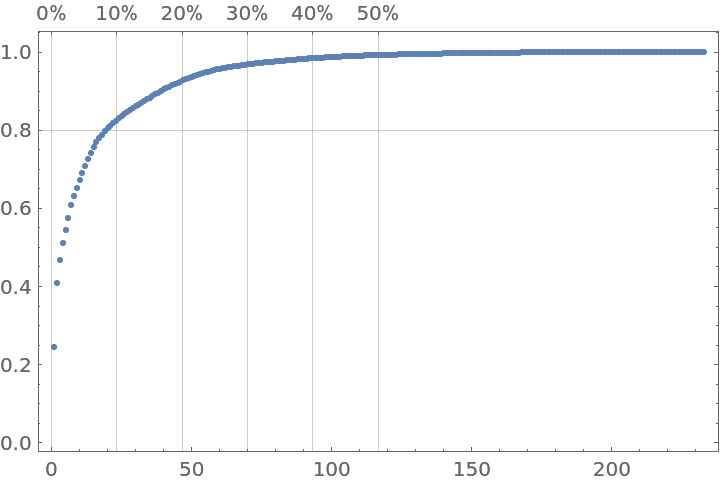
Pareto principle manifestation for countries' GDP, showing that ≈10% of the countries correspond to ≈80% of the total GDP:
| In[20]:= |
|
| Out[20]= |
|
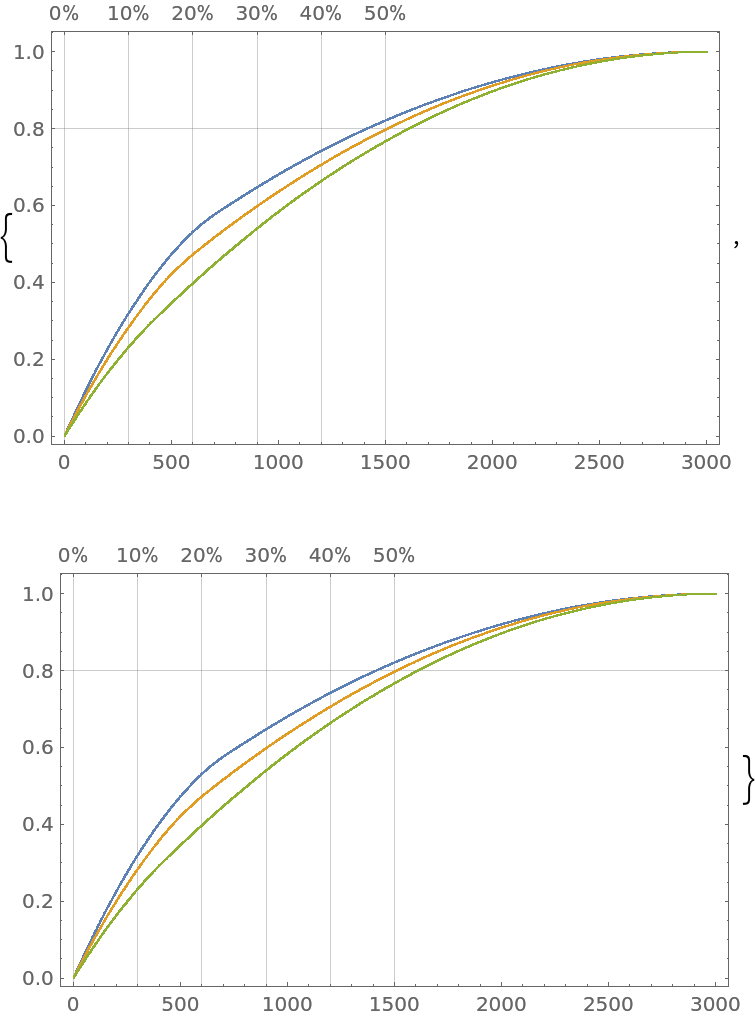
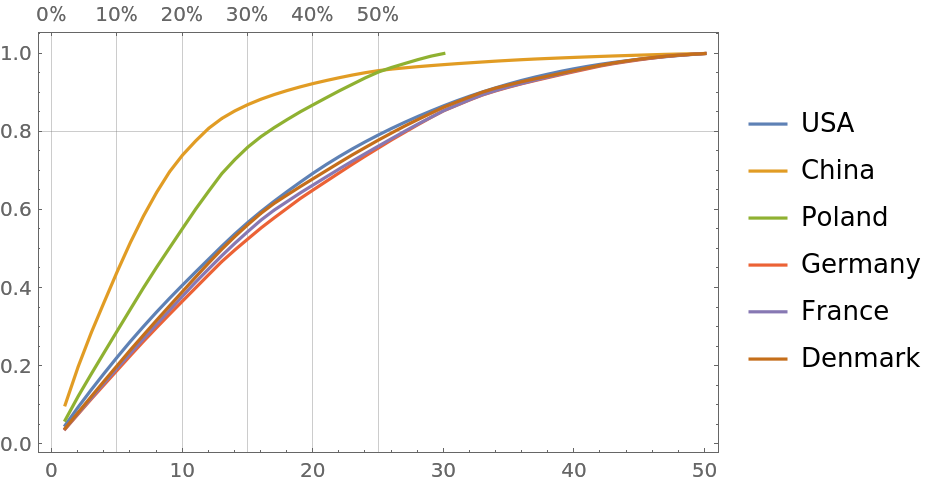
Plot together the curves of GDP changes for different countries in the same time period, demonstrating the rapid growth of China and Poland:
| In[21]:= |
![res = Table[(t = CountryData[countryName, {{"GDP"}, {1970, 2019}}];
t = Reverse@Sort[t["Path"][[All, 2]] /. Quantity[x_, _] :> x];
Tooltip[t, countryName]), {countryName, {"USA", "China", "Poland",
"Germany", "France", "Denmark"}}];
ResourceFunction["ParetoPrinciplePlot"][res, PlotRange -> All, Joined -> True, PlotLegends -> res[[All, 2]]]](https://www.wolframcloud.com/obj/resourcesystem/images/874/874eb3ae-2c30-4919-9deb-e91dce200cc4/016b2faf4a6abe3b.png)
|
| Out[22]= |
|
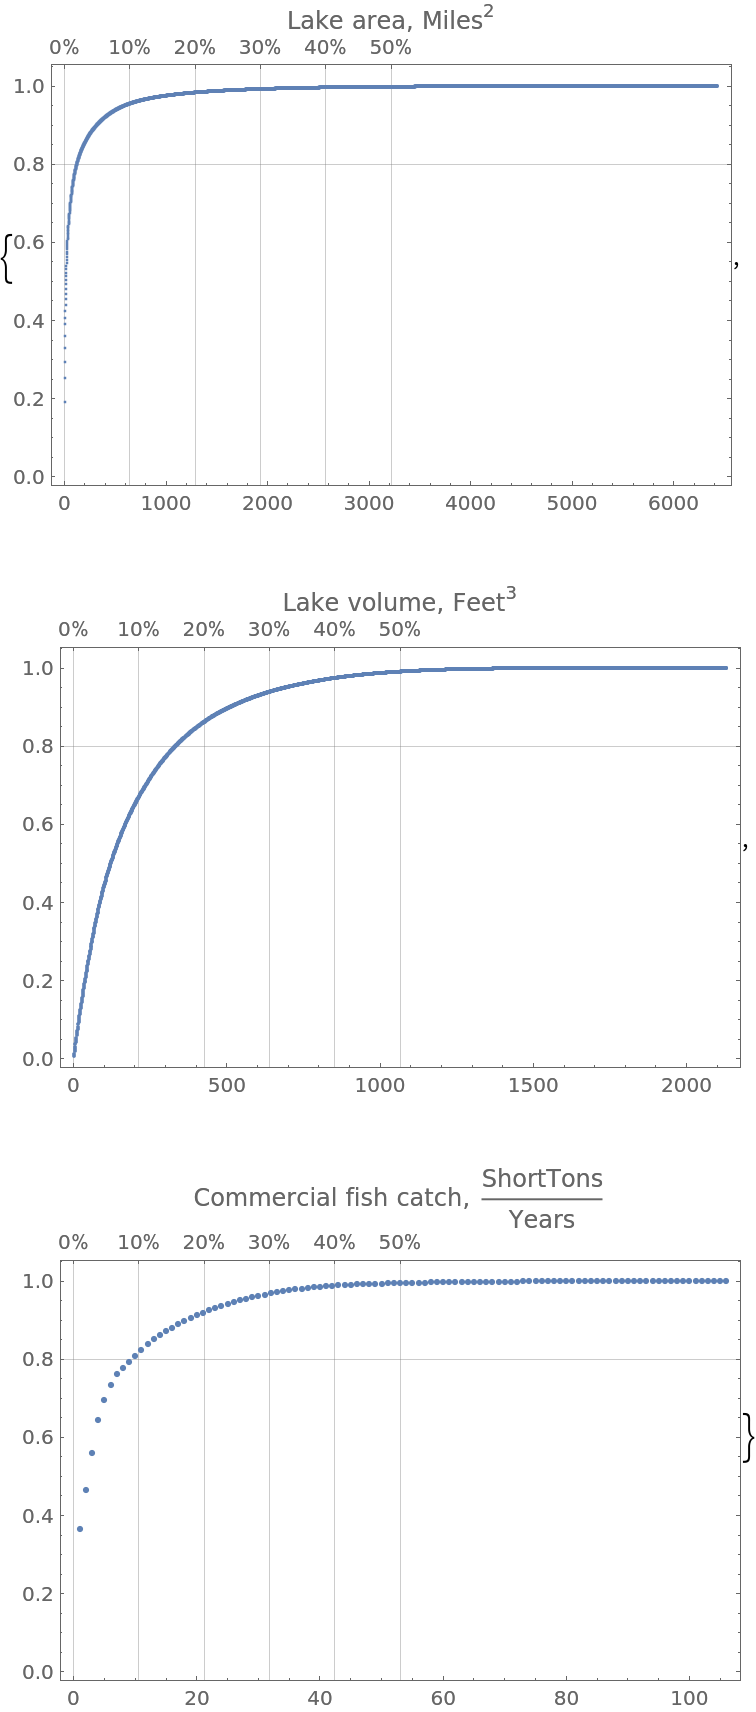
Gather data for lakes and make Pareto principle plots for the lakes' surface areas, volumes and fish catch:
| In[23]:= |
![lakeAreas = LakeData[All, "SurfaceArea"];
lakeVolumes = LakeData[All, "Volume"];
lakeFishCatch = LakeData[All, "CommercialFishCatch"];](https://www.wolframcloud.com/obj/resourcesystem/images/874/874eb3ae-2c30-4919-9deb-e91dce200cc4/3e02acc093ce0ae7.png)
|
| In[24]:= |
|
You can see that the lakes' area data manifests an “exaggerated” Pareto principle adherence; ≈5% of the lakes correspond to ≈90% of the total lake area:
| In[25]:= |
![opts = {PlotRange -> All, ImageSize -> Medium}; MapThread[
ResourceFunction["ParetoPrinciplePlot"][#1, PlotLabel -> Row[{#2, ", ", #3}], opts] &, {t, {"Lake area", "Lake volume", "Commercial fish catch"}, DeleteMissing[#][[1, 2]] & /@ data}]](https://www.wolframcloud.com/obj/resourcesystem/images/874/874eb3ae-2c30-4919-9deb-e91dce200cc4/0493fde3cf2b35c6.png)
|
| Out[25]= |
|
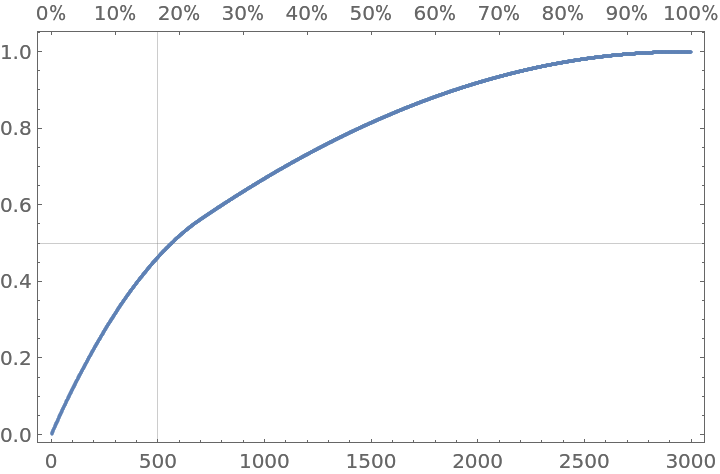
A numeric vector:
| In[26]:= |
|
The Pareto principle plot data is computed using the following formula:
| In[27]:= |
|
Show the corresponding plot:
| In[28]:= |
|
| Out[28]= |
|
Compare with the plot made by ParetoPrinciplePlot:
| In[29]:= |
|
| Out[29]= |
|
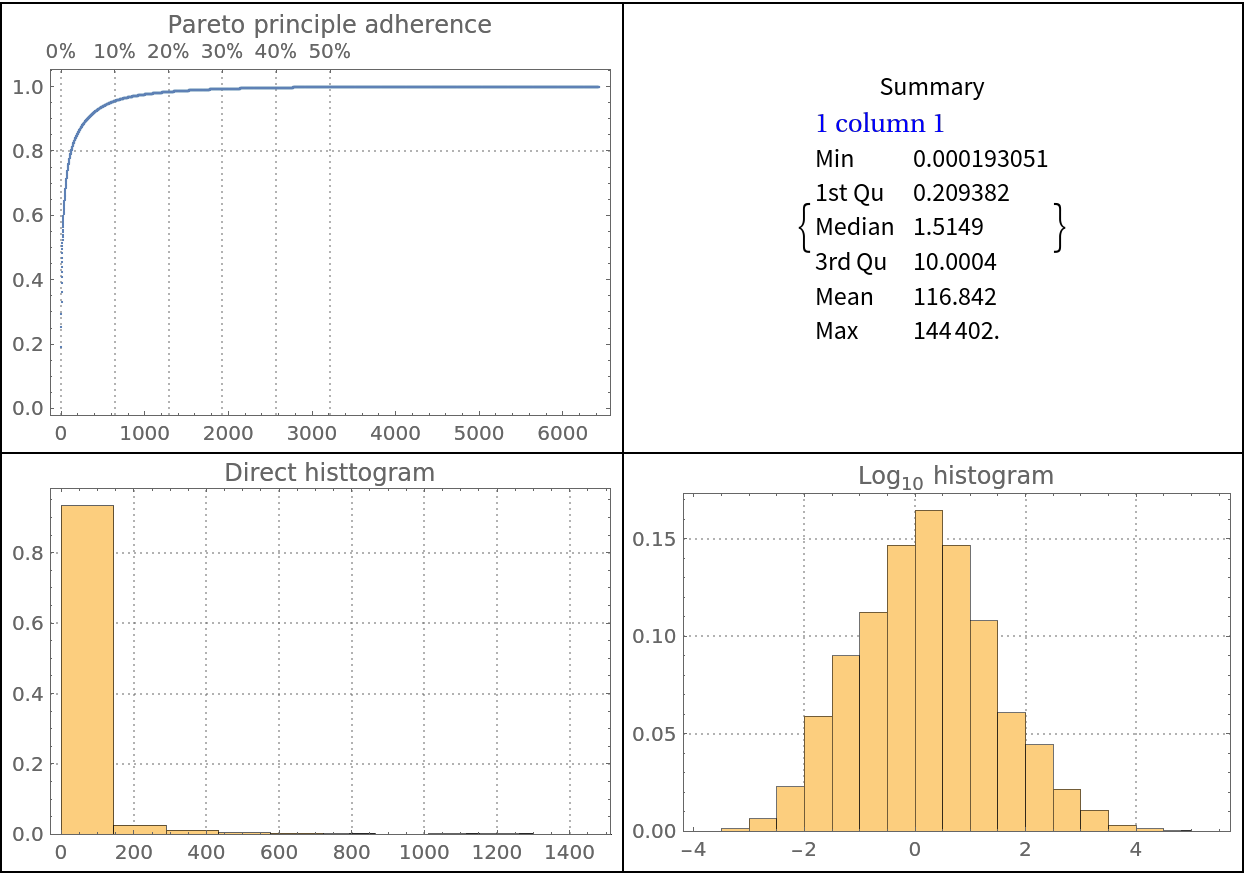
It is beneficial to use Pareto principle adherence plots together with data summaries and histograms:
| In[30]:= |
|
Note that the summary and histograms provide complementary data distribution properties to those given by the Pareto principle adherence plot:
| In[31]:= |
![Grid[{
{ResourceFunction["ParetoPrinciplePlot"][vec, PlotLabel -> "Pareto principle adherence", opts],
Labeled[ResourceFunction["RecordsSummary"][vec], "Summary", Top]},
{Histogram[vec, Automatic, "Probability", PlotLabel -> "Direct histtogram", opts],
Histogram[Log10@vec, Automatic, "Probability", PlotLabel -> "\!\(\*SubscriptBox[\(Log\), \(10\)]\) histogram", opts]}}, Dividers -> All]](https://www.wolframcloud.com/obj/resourcesystem/images/874/874eb3ae-2c30-4919-9deb-e91dce200cc4/4525e324c37ccbb2.png)
|
| Out[31]= |
|
ParetoPrinciplePlot does not work on vectors with missing values:
| In[32]:= |
|
| Out[32]= |
|
Use DeleteMissing to obtain a plot:
| In[33]:= |
|
| Out[33]= |
|
ParetoPrinciplePlot does not work on QuantityArray objects and lists of Quantity objects:
| In[34]:= |
|
| Out[34]= |

|
| In[35]:= |
|
| Out[35]= |
|
Use DeleteMissing and QuantityMagnitude to obtain a plot:
| In[36]:= |
|
| Out[36]= |
|
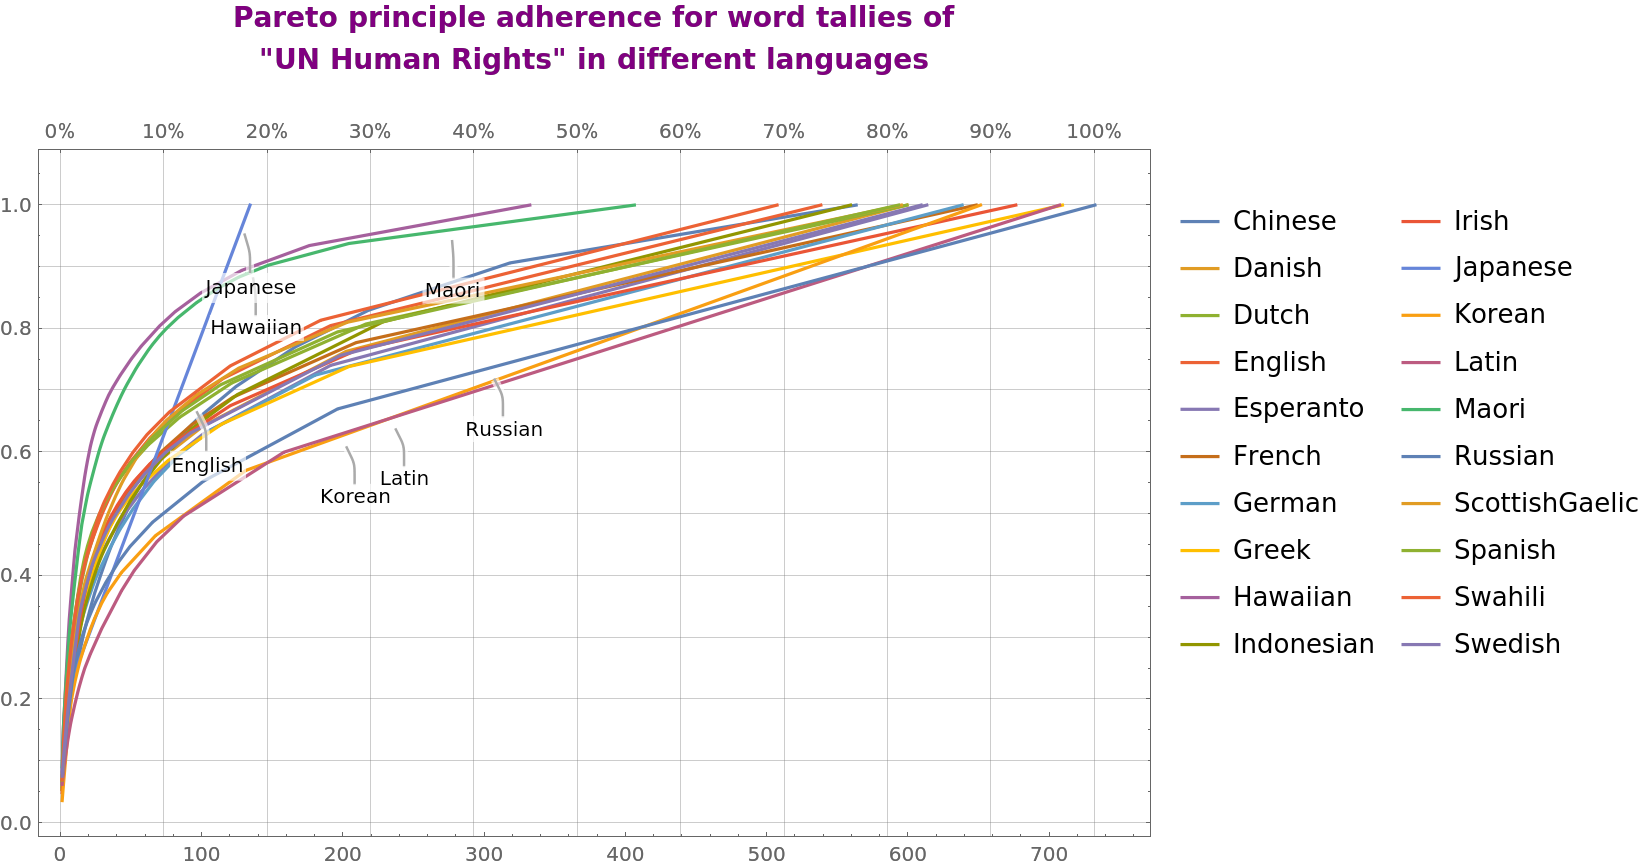
Pareto principle adherence plots for word tallies for different translations of the United Nations’ "Universal Declaration of Human Rights" official document:
| In[37]:= |
![GetWords[text_String] := Select[StringSplit[
ToLowerCase[text], {" ", ",", ".", ";", "?", "!", "...", "-"}], StringLength[#] > 0 &];
textIDs = Select[ExampleData["Text"], StringMatchQ[#[[2]], "UNHuman" ~~ __] &];
textNames = StringTake[#[[2]], {StringLength["UNHumanRights"] + 1, -1}] & /@ textIDs;
textData = MapThread[
Tooltip[Tally[GetWords[ExampleData[#1]]][[All, 2]], #2] &, {textIDs, textNames}];
textK = 0;
textData = Map[If[MemberQ[{"English", "Hawaiian", "Japanese", "Korean", "Latin", "Maori", "Russian"}, #[[2]]], Callout[#, #[[2]], {100 + 35*(textK++), Below}], #] &, textData];
ResourceFunction["ParetoPrinciplePlot"][textData,
"ParetoGridLines" -> {Automatic, Automatic}, PlotLegends -> textNames, Joined -> True, ImageSize -> Large, PlotLabel -> Style["Pareto principle adherence for word tallies of\n\"UN Human Rights\" in different languages\n", Bold, Purple, FontSize -> 14]]](https://www.wolframcloud.com/obj/resourcesystem/images/874/874eb3ae-2c30-4919-9deb-e91dce200cc4/7ba2a6a56988052e.png)
|
| Out[43]= |
|
This work is licensed under a Creative Commons Attribution 4.0 International License