Wolfram Function Repository
Instant-use add-on functions for the Wolfram Language
Function Repository Resource:
Make a pie chart that exceeds the allowed total
ResourceFunction["OverfullPieChart"][{y1,y2,y3,…},max] makes a 3D pie chart of the data yi for which the maximum is max, bending it in 3D to make extra space. | |
ResourceFunction["OverfullPieChart"][{y1,y2,y3,…},max,n] uses a mode-n bending of the surface. |
Make a pie chart for which the total is 140, but the allowed total is only 100:
| In[1]:= |
| Out[1]= | 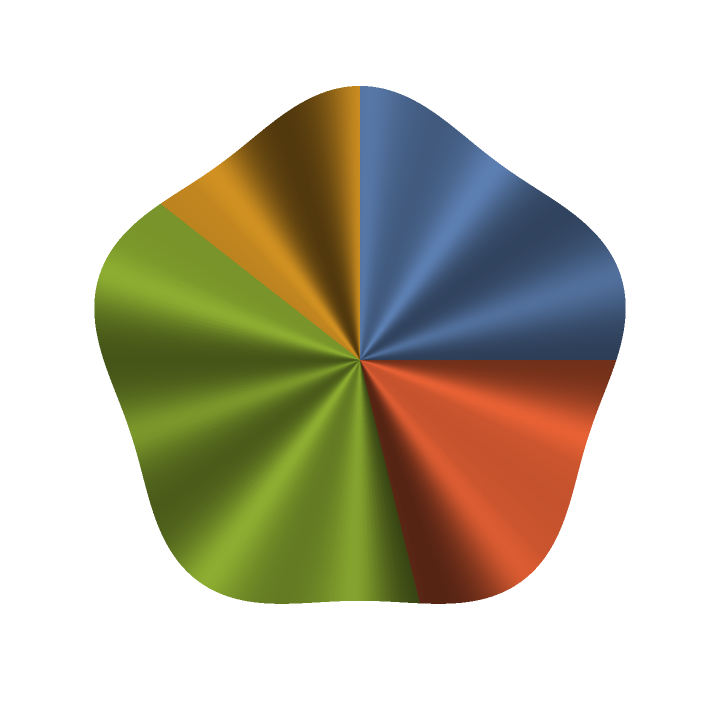 |
Without a maximum given, the maximum is assumed to be 1:
| In[2]:= |
| Out[2]= | 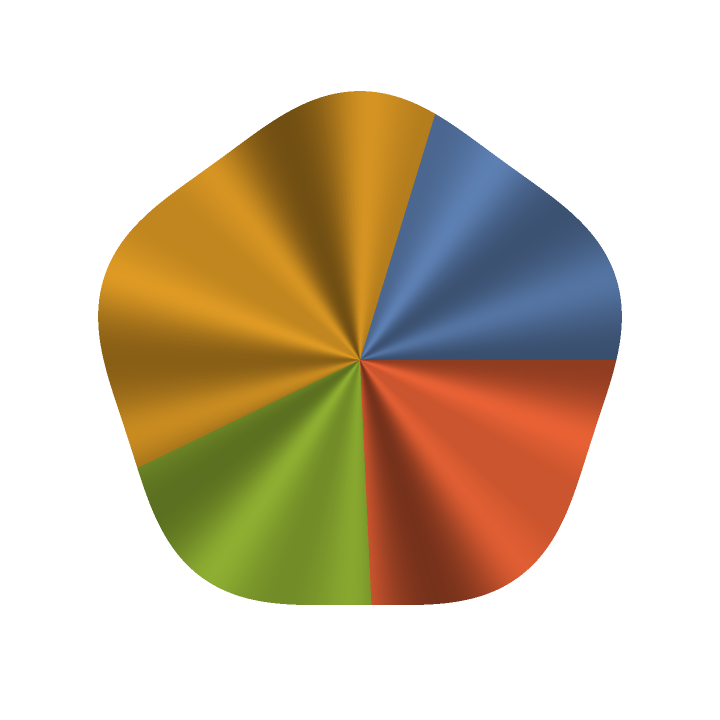 |
Use a higher mode of bending the paper:
| In[3]:= |
| Out[3]= | 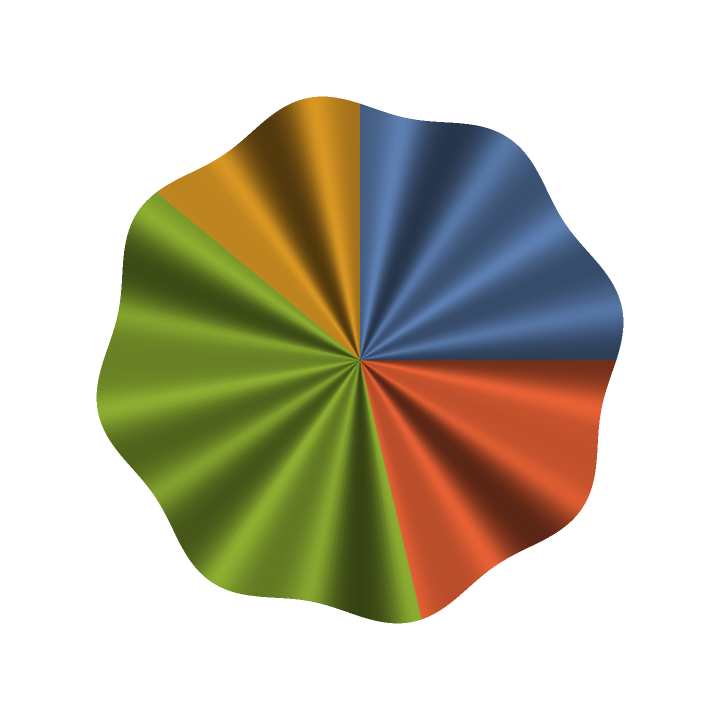 |
Compare a regular pie chart and an overfull pie chart:
| In[4]:= | ![data = {35, 20, 55, 30};
Row[{PieChart[data, ChartStyle -> ColorData[97] /@ Range[4], SectorOrigin -> {0, "Counterclockwise"}, ImageSize -> 300],
Show[ResourceFunction["OverfullPieChart"][data, 100], ImageSize -> 300]}]](https://www.wolframcloud.com/obj/resourcesystem/images/967/967b8c32-ffd8-4b3c-aca3-105c42349af0/09ba2d49ce1d46af.png) |
| Out[5]= | 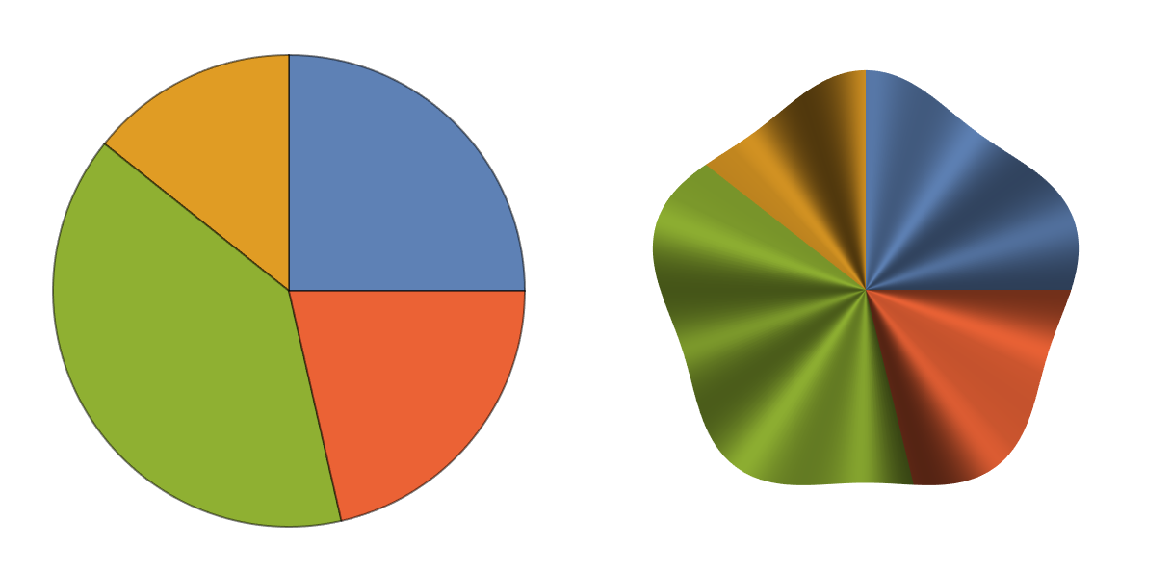 |
If the total is less than the maximum, the paper cannot bend without ripping:
| In[6]:= |
See how the sheet bends in 3D:
| In[7]:= | ![Show[ResourceFunction["OverfullPieChart"][{0.25, 0.45, 0.23, 0.3}], ViewPoint -> {3.1, -3.71, 1.5}, ViewAngle -> 14 Degree]](https://www.wolframcloud.com/obj/resourcesystem/images/967/967b8c32-ffd8-4b3c-aca3-105c42349af0/7e2055803fd985ad.png) |
| Out[7]= | 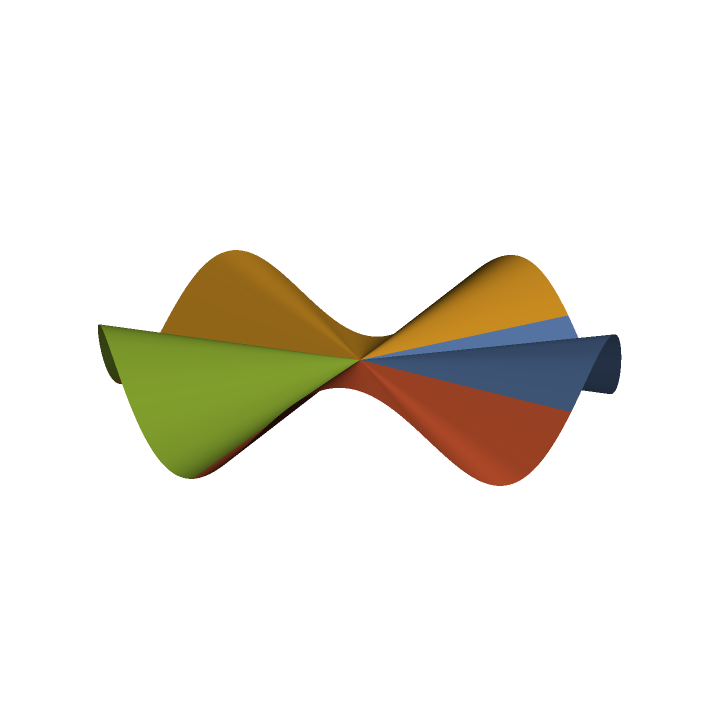 |
For higher modes, the amplitude is obviously smaller:
| In[8]:= | ![Row[{Show[
ResourceFunction["OverfullPieChart"][{20, 30, 40, 70}, 100, 5], ViewPoint -> {3, 3, 2}, ViewAngle -> 14 Degree, ImageSize -> 300], Show[ResourceFunction["OverfullPieChart"][{20, 30, 40, 70}, 100, 12], ViewPoint -> {3, 3, 2}, ViewAngle -> 14 Degree, ImageSize -> 300]}]](https://www.wolframcloud.com/obj/resourcesystem/images/967/967b8c32-ffd8-4b3c-aca3-105c42349af0/6a0b36f38b46aac0.png) |
| Out[8]= | 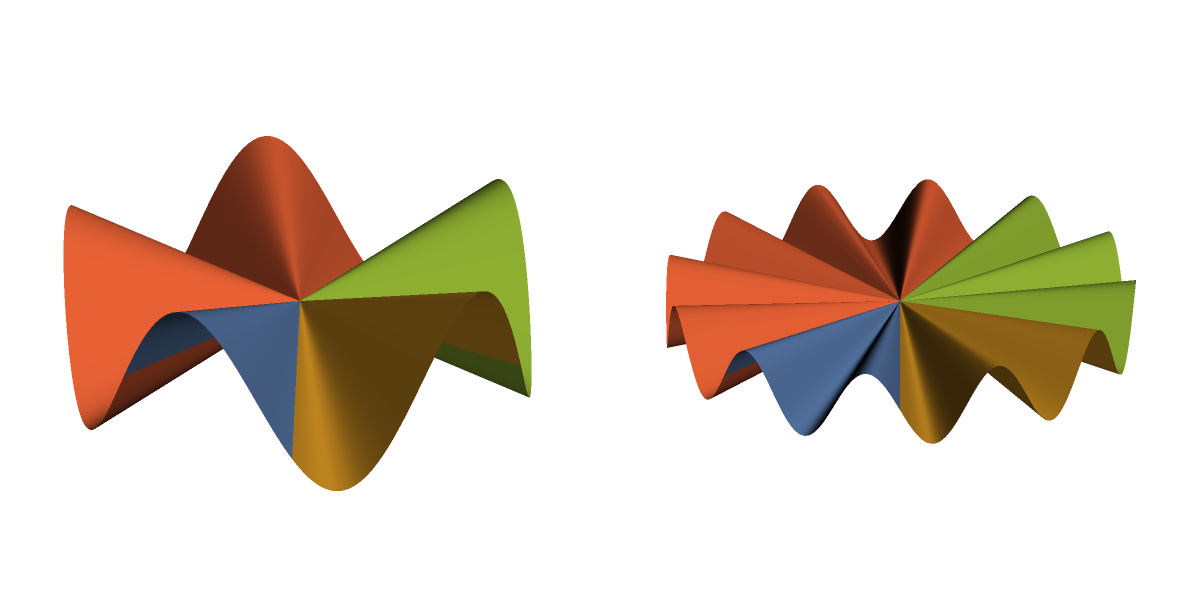 |
This work is licensed under a Creative Commons Attribution 4.0 International License