Wolfram Function Repository
Instant-use add-on functions for the Wolfram Language
Function Repository Resource:
A version of BarChart that accommodates large outlier values
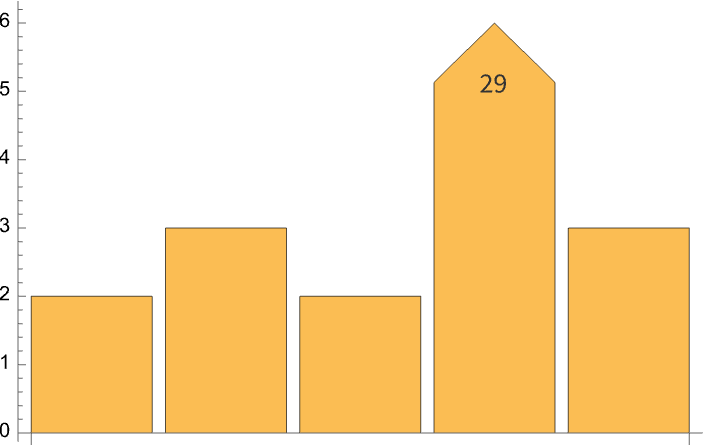
ResourceFunction["OverflowBarChart"][data] creates a BarChart of data with large outliers clipped and styled. |
| "ArrowWidth" | 1 | the width of the overflow bars |
| "ArrowStyle" | Automatic | style primitives to apply to the overflow bars |
| "TaperRatio" | 0 | the proportion of arrows that are tapered |
| "ArrowheadProportion" | Automatic | the proportion of the the overflow bar to be an Arrowhead |
| "LabelFunction" | Automatic | a function for displaying the label in an overflow bar |
| "LabelPosition" | 0.85 | the proportian of the vertical distance where the label is placed |
| PlotRange | Automatic | the range of y-values to include; larger values are clipped |
Multidimensional data is supported:
| In[2]:= |
| Out[2]= | 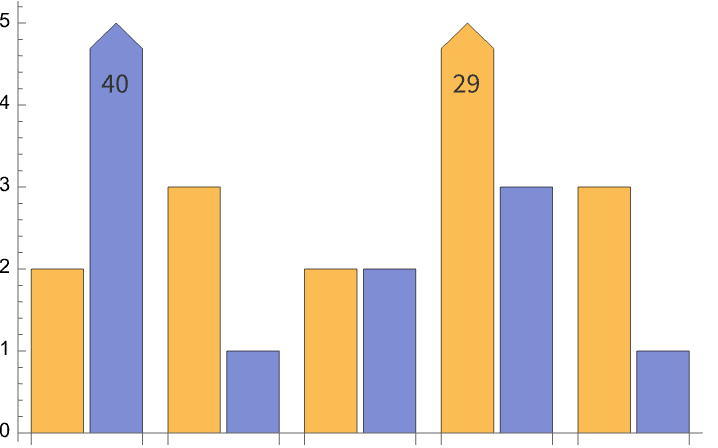 |
By default, bars are clipped at twice the median value:
| In[3]:= |
| Out[3]= | 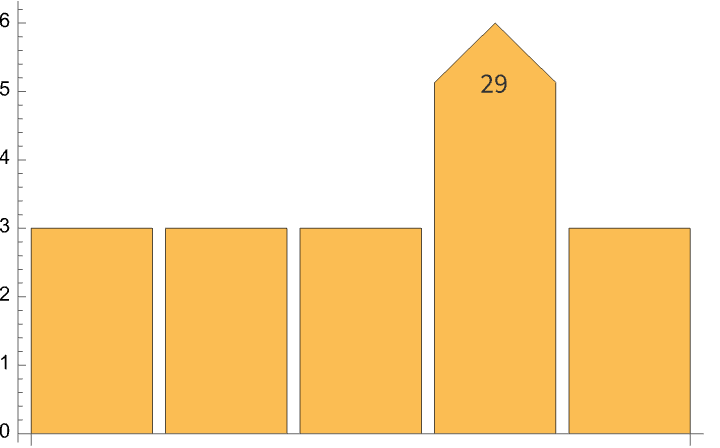 |
If you set the PlotRange, this will be used instead:
| In[4]:= | ![GraphicsGrid[{{ResourceFunction["OverflowBarChart"][{3, 3, 3, 29, 3}, PlotRange -> {0, 20}], ResourceFunction["OverflowBarChart"][{3, 3, 3, 29, 3}, PlotRange -> {0, 30}]}}]](https://www.wolframcloud.com/obj/resourcesystem/images/b43/b432bdff-347b-4f90-afa1-18d0180eddfb/2164026d512cb889.png) |
| Out[4]= | 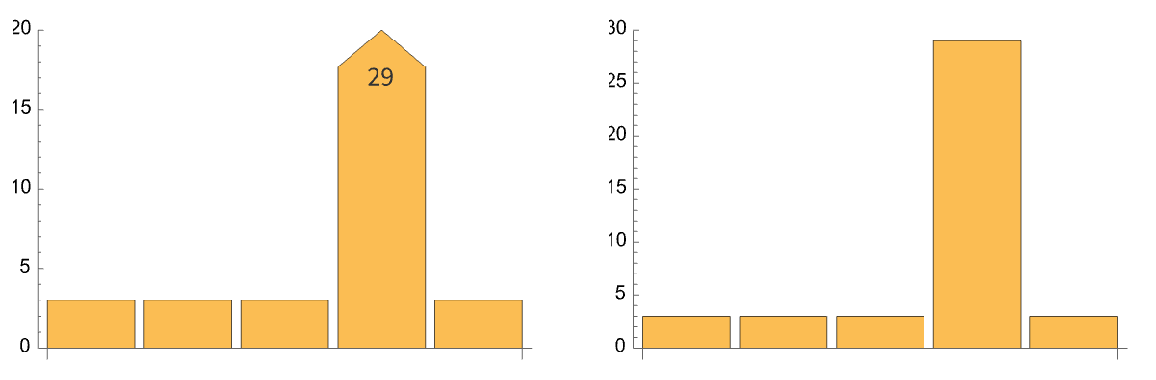 |
"ArrowStyle" allows style primitives to be applied to overflow bars:
| In[5]:= |
| Out[5]= | 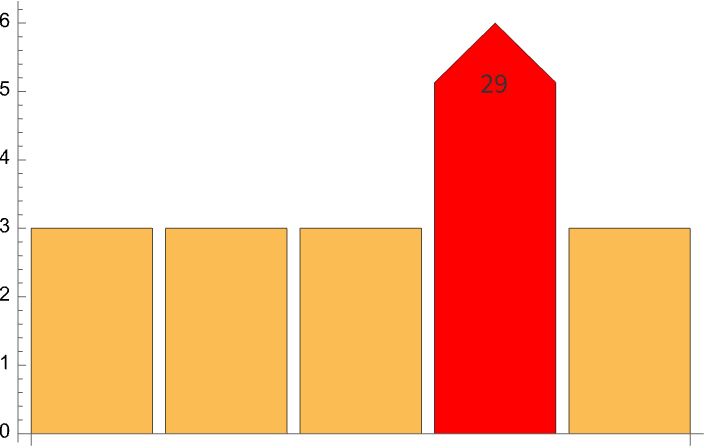 |
"LabelFunction" and "LabelPosition" can be used to control the label on the overflow bar:
| In[6]:= |
| Out[6]= | 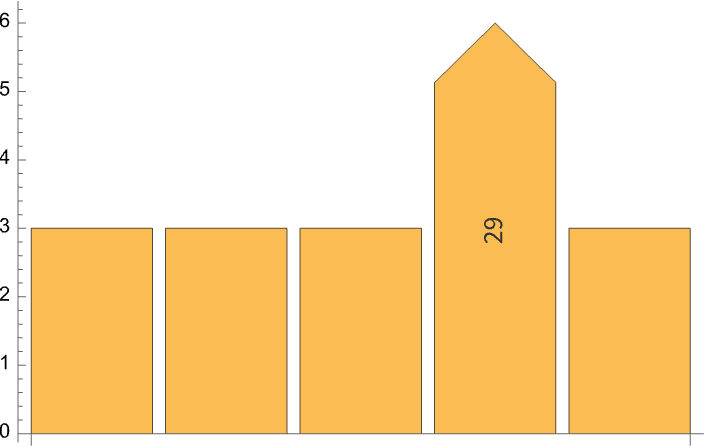 |
The arrow style can be controlled with "TaperRatio", "ArrowheadProportion" and "ArrowWidth":
| In[7]:= |
| Out[7]= | 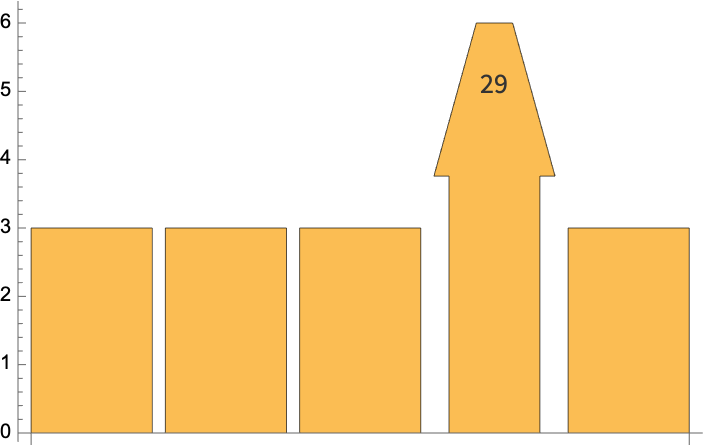 |
This work is licensed under a Creative Commons Attribution 4.0 International License