Wolfram Function Repository
Instant-use add-on functions for the Wolfram Language
Function Repository Resource:
Read energy consumption data from smart meters managed by the UK energy company Octopus Energy
ResourceFunction["OctopusEnergyConsumption"][credentials] reads energy consumption data from the gas or electricity meter described by the Association credentials. |
| "MaxRecords" | 100 | the number of records to attempt to retreive |
| "Interval" | Automatic | the time to aggregate usage over. Automatic is 30 minute periods. Available choices are: “Hour”,”Day”,”Week”,”Quarter” |
| "StartTime" | Automatic | the date and time of the first record to return |
| "EndTime" | Automatic | the date and time of the last record to return ("StartTime" must also be specified). |
Plot the most recent 100 half-hourly records of electricity consumption:
| In[1]:= | ![DateListPlot[
ResourceFunction[
"OctopusEnergyConsumption"][<|"APIKey" -> "XXX", "MPAN" -> "12345678", "SerialNumber" -> "11111111"|>], PlotLabel -> "Electricity consumption"]](https://www.wolframcloud.com/obj/resourcesystem/images/390/3903b88f-fcc3-4138-915e-27be8ca9eab5/52024f263a6a0ade.png) |
| Out[17]= | 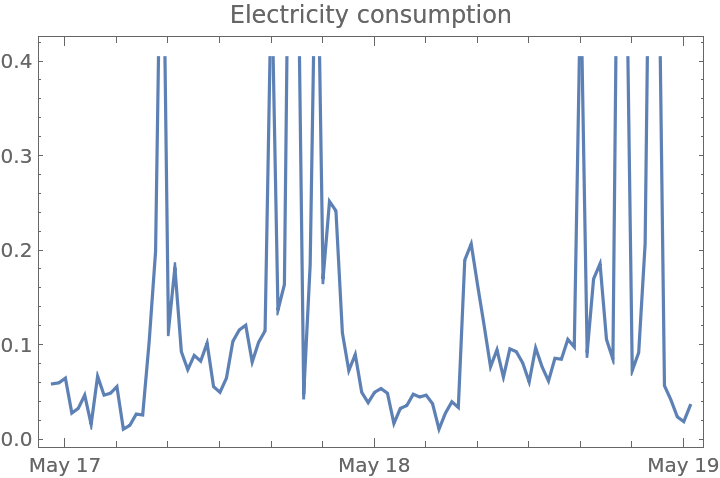 |
An MPRN value is required to retrieve gas usage (note that gas and electricity meters at the same property have different serial numbers):
| In[18]:= | ![DateListPlot[
ResourceFunction[
"OctopusEnergyConsumption"][<|"APIKey" -> "XXX", "MPRN" -> "87654321", "SerialNumber" -> "22222222"|>], PlotLabel -> "Gas consumption"]](https://www.wolframcloud.com/obj/resourcesystem/images/390/3903b88f-fcc3-4138-915e-27be8ca9eab5/127d557fa9d207b8.png) |
| Out[18]= | 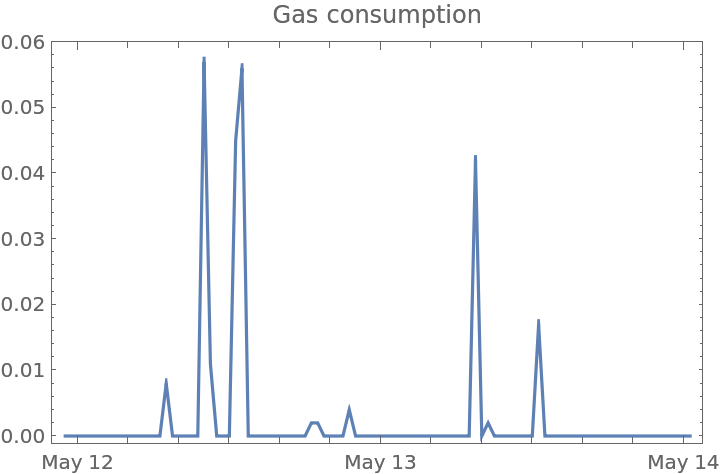 |
The maximum number of records you can request is 25,000:
| In[19]:= | ![DateListPlot[
ResourceFunction[
"OctopusEnergyConsumption"][<|"APIKey" -> "XXX", "MPAN" -> "12345678", "SerialNumber" -> "11111111"|>, "MaxRecords" -> 25000], PlotLabel -> "Electricity consumption", PlotRange -> All]](https://www.wolframcloud.com/obj/resourcesystem/images/390/3903b88f-fcc3-4138-915e-27be8ca9eab5/591f0799758b77bb.png) |
| Out[19]= | 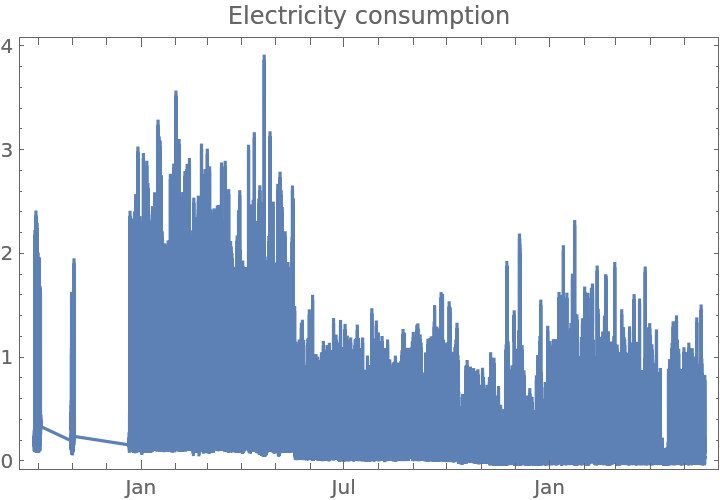 |
You can fetch records for a given period:
| In[20]:= | ![DateListPlot[
ResourceFunction[
"OctopusEnergyConsumption"][<|"APIKey" -> "XXX", "MPAN" -> "12345678", "SerialNumber" -> "11111111"|>, "MaxRecords" -> 25000, "StartTime" -> DateObject[{2022, 1, 1}], "EndTime" -> DateObject[{2022, 1, 31}]], PlotLabel -> "Electricity consumption", PlotRange -> All]](https://www.wolframcloud.com/obj/resourcesystem/images/390/3903b88f-fcc3-4138-915e-27be8ca9eab5/6d44dc1f8fef8adc.png) |
| Out[20]= | 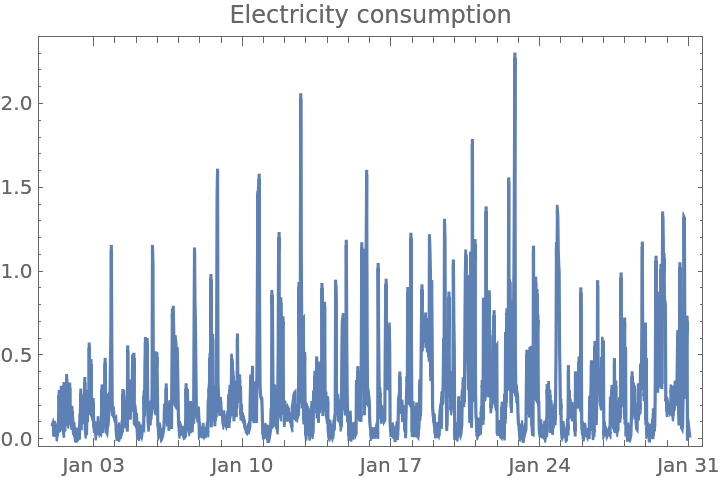 |
Fetch weekly consumption:
| In[21]:= | ![DateListPlot[
ResourceFunction[
"OctopusEnergyConsumption"][<|"APIKey" -> "XXX", "MPAN" -> "12345678", "SerialNumber" -> "11111111"|>, "Interval" -> "Week"], PlotLabel -> "Electricity consumption", PlotRange -> All]](https://www.wolframcloud.com/obj/resourcesystem/images/390/3903b88f-fcc3-4138-915e-27be8ca9eab5/3ecae148ca098b76.png) |
| Out[21]= | 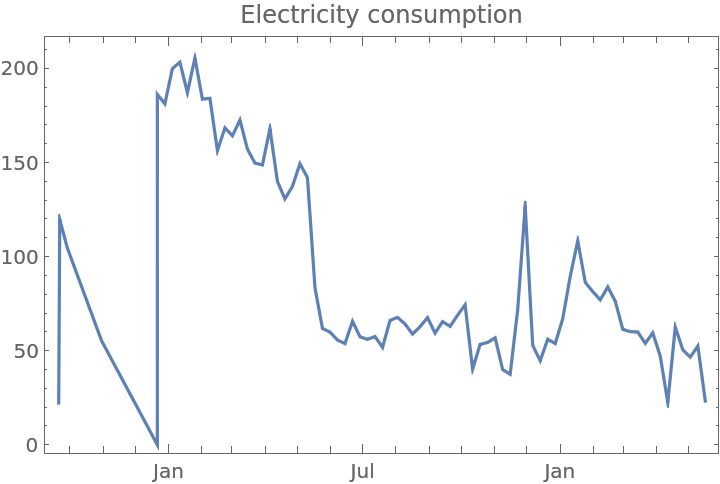 |
This work is licensed under a Creative Commons Attribution 4.0 International License