Wolfram Function Repository
Instant-use add-on functions for the Wolfram Language
Function Repository Resource:
Generate testing and vaccination datasets from the OWID COVID-19 data site
ResourceFunction["OWIDCOVID19Data"][] returns vaccination and testing datasets for countries on the Our World in Data (OWID) site. | |
ResourceFunction["OWIDCOVID19Data"][type] returns either testing or vaccination data, depending on the value of type. | |
ResourceFunction["OWIDCOVID19Data"]["Vaccination","USA"] returns vaccination data for US states and US territories. | |
ResourceFunction["OWIDCOVID19Data"]["CountryMetadata"] returns the vaccination metadata for countries. |
Generate the vaccination dataset:
| In[1]:= |
| Out[1]= |
The column names:
| In[2]:= |
| Out[2]= |  |
Visualize the top 20 countries in terms of people vaccinated:
| In[3]:= |
| Out[3]= |
| In[4]:= |
| Out[4]= |
| In[5]:= | ![With[{asso = Normal[vaccineDT[
KeySelect[MatchQ[#, Entity["Country", _] | _String] &]][
TakeLargestBy[#PeopleVaccinated["LastValue"] &, 20], #PeopleVaccinated["LastValue"] &]]}, BarChart[asso, BarOrigin -> Left, ChartLabels -> Keys[asso], Frame -> True, GridLines -> Automatic, PlotLabel -> "People Vaccinated", ImageSize -> 700]]](https://www.wolframcloud.com/obj/resourcesystem/images/af2/af26bb30-36ab-4624-a758-6e5c9a8ebfa0/2bf8463a6b7d6bca.png) |
| Out[5]= | 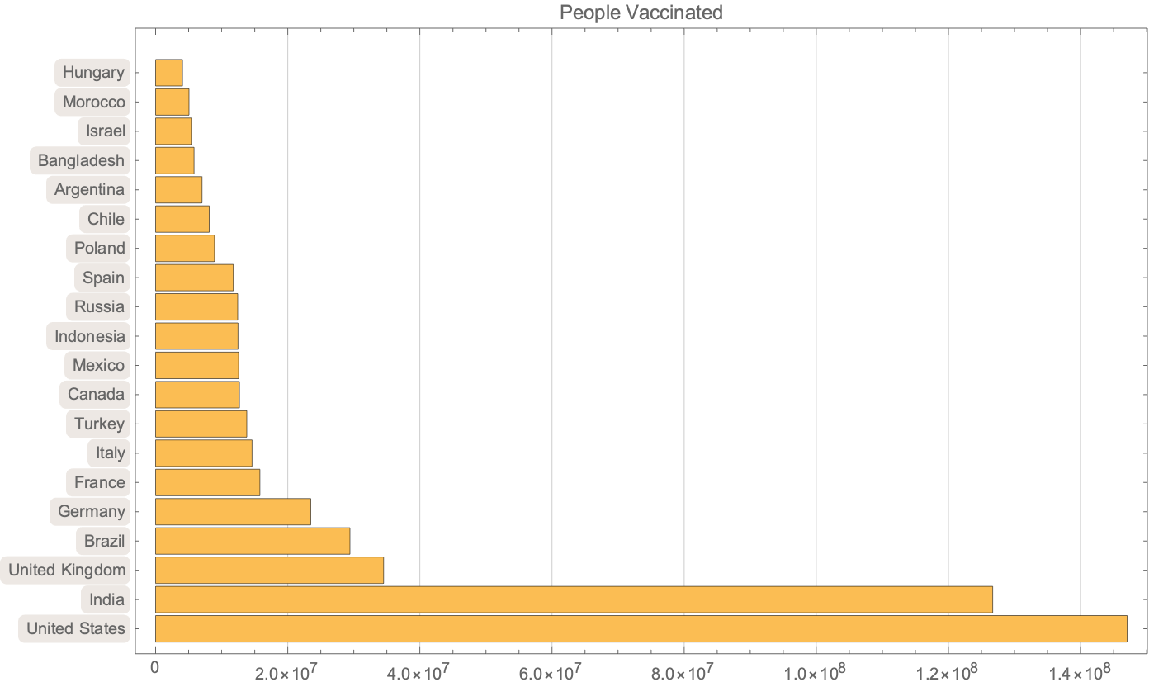 |
Plot the total number of vaccinations for the 10 countries with the highest total number of vaccinations:
| In[6]:= | ![With[{asso = Normal[vaccineDT[
KeySelect[MatchQ[#, Entity["Country", _] | _String] &]][
TakeLargestBy[#TotalVaccinations["LastValue"] &, 10], "TotalVaccinations"]]},
DateListPlot[
KeyValueMap[
Callout[Tooltip[DeleteMissing[#2], CommonName[#1]], #1] &, asso], PlotRange -> All, Frame -> True, GridLines -> Automatic, PlotLabel -> "Total Vaccinations of Time", ImageSize -> 700]]](https://www.wolframcloud.com/obj/resourcesystem/images/af2/af26bb30-36ab-4624-a758-6e5c9a8ebfa0/0e925563d368daea.png) |
| Out[6]= | 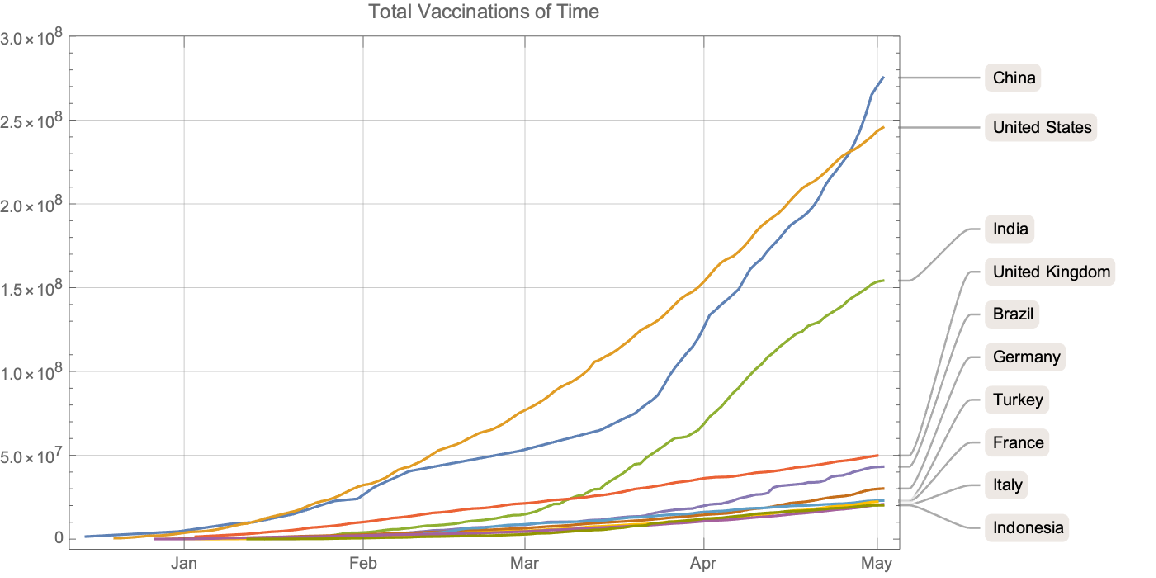 |
Visualize the fully vaccinated people in the continental US:
| In[7]:= | ![ResourceFunction["OWIDCOVID19Data"]["Vaccination", "USA"][
KeySelect[
MemberQ[EntityList@
EntityClass["AdministrativeDivision", "ContinentalUSStates"], #] &]][
GeoRegionValuePlot[#, GeoProjection -> "Mercator", PlotLabel -> "Fully Vaccinated People per US States"] &, #PeopleFullyVaccinated["LastValue"] &]](https://www.wolframcloud.com/obj/resourcesystem/images/af2/af26bb30-36ab-4624-a758-6e5c9a8ebfa0/7dd3e902cf67fa09.png) |
| Out[7]= | 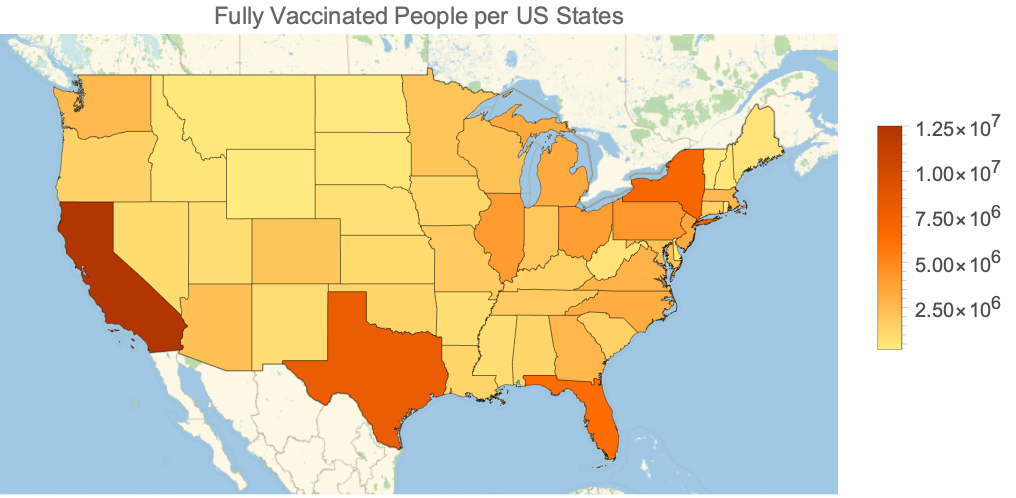 |
Generate the vaccination dataset:
| In[8]:= |
| Out[8]= |
Visualize the top 20 countries in terms of percentage of fully-vaccinated people:
| In[9]:= | ![With[{asso = Normal[vaccineDT[
KeySelect[MatchQ[#, Entity["Country", _] | _String] &]][
TakeLargestBy[#PeopleFullyVaccinatedPerHundred["LastValue"] &, 20], #PeopleFullyVaccinatedPerHundred["LastValue"] &]]}, BarChart[asso, BarOrigin -> Left, ChartLabels -> Keys[asso], Frame -> True, GridLines -> Automatic, AspectRatio -> 1/2, PlotLabel -> "People Fully Vaccinated (%)", ImageSize -> 700]]](https://www.wolframcloud.com/obj/resourcesystem/images/af2/af26bb30-36ab-4624-a758-6e5c9a8ebfa0/5ec1468cf8d5b27a.png) |
| Out[9]= | 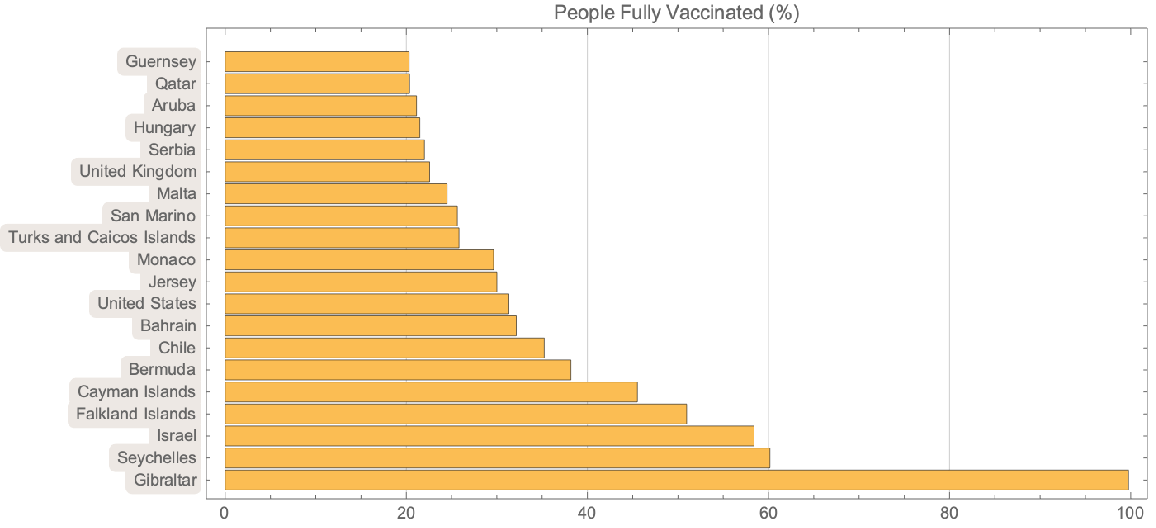 |
Generate the testing dataset:
| In[10]:= |
| Out[10]= |
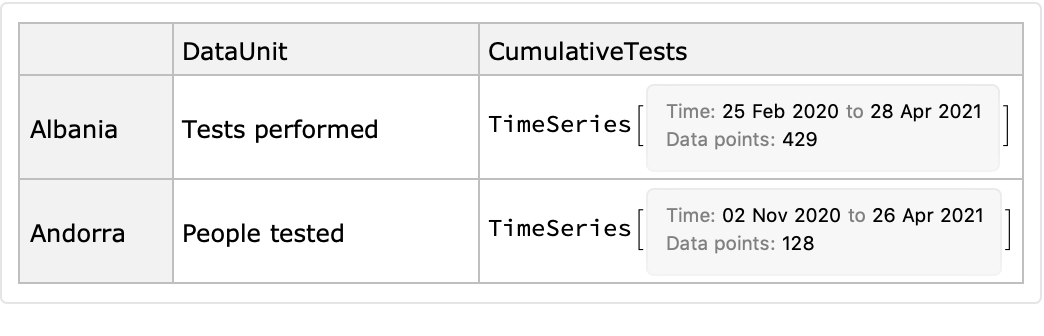
Columns of the dataset:
| In[11]:= |
| Out[11]= |
Visualize the testing units done so far:
| In[12]:= |
| Out[12]= | 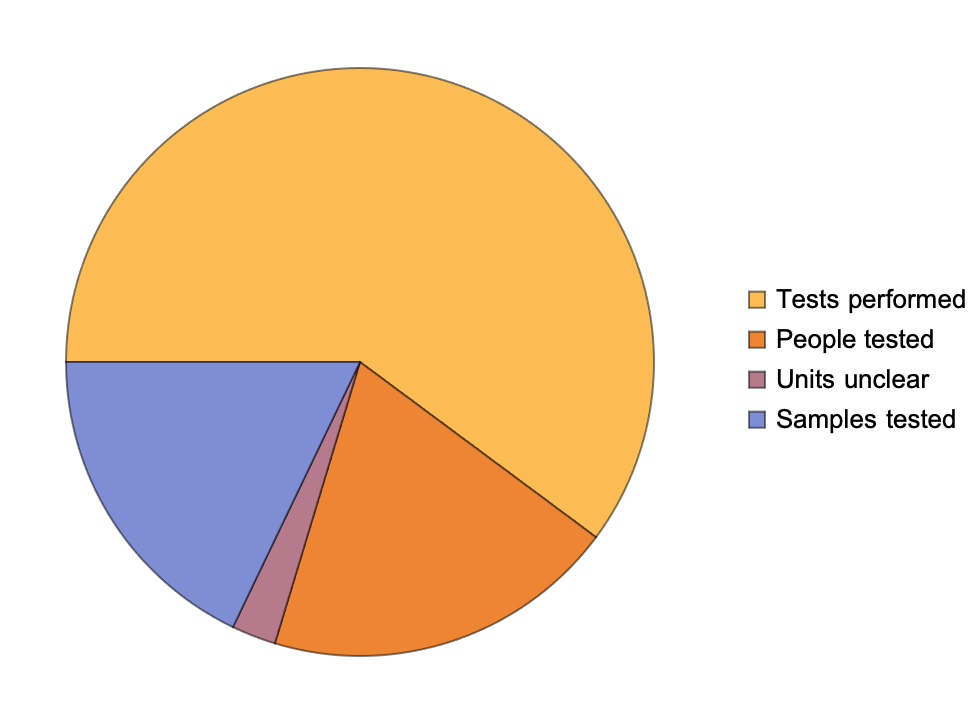 |
Visualize the cumulative tests performed across countries:
| In[13]:= | ![With[{asso = Normal[testingDT[
TakeLargestBy[#CumulativeTests["LastValue"] &, 20], #CumulativeTests["LastValue"] &]]}, BarChart[asso, BarOrigin -> Left, ChartLabels -> Keys[asso], Frame -> True, GridLines -> Automatic, AspectRatio -> 1/2, PlotLabel -> "Cumulative Tests Performed", ImageSize -> 700]]](https://www.wolframcloud.com/obj/resourcesystem/images/af2/af26bb30-36ab-4624-a758-6e5c9a8ebfa0/30b700647e70a605.png) |
| Out[13]= | 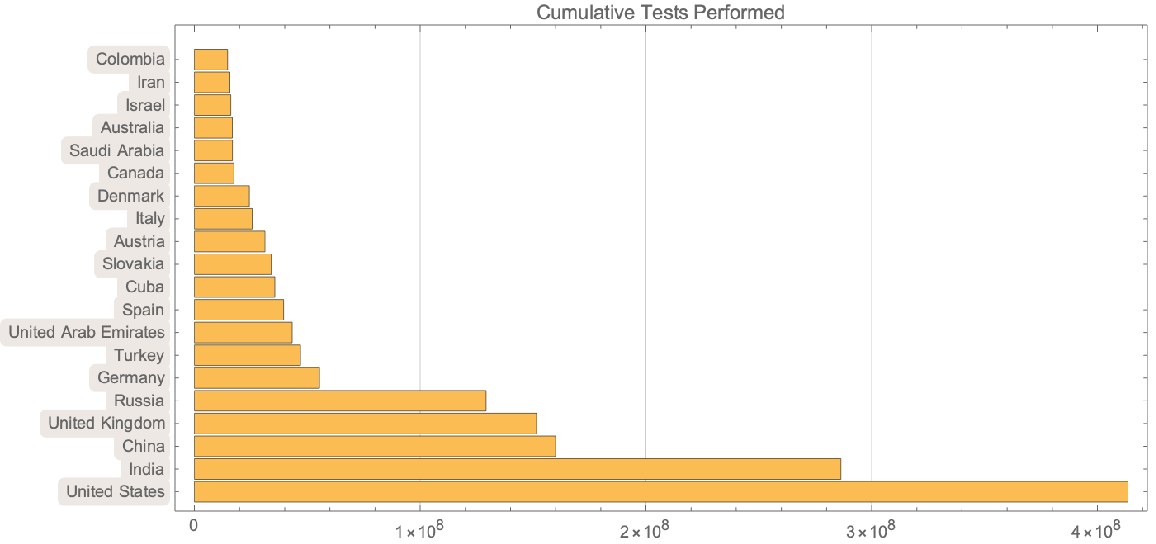 |
Generate the "CountryMetadata" dataset:
| In[14]:= |
| Out[14]= |
Show which vaccines are being applied worldwide:
| In[15]:= | ![vaccineNames = Union @@ Normal[metadataDT[All, "Vaccines"]];
vaccinesByCountry = metadataDT[
KeySelect[! MissingQ[#] && Head[#] == Entity && EntityTypeName[#] == "Country" &],
<|"Vaccines" -> "Vaccines"|>
];
Manipulate[
GeoListPlot[
Keys@Normal@vaccinesByCountry[Select[MemberQ[#Vaccines, vacc] &]],
GeoLabels -> (Tooltip[#1, #2] &), PlotLabel -> vacc, GeoRange -> "World"],
{{vacc, "Pfizer/BioNTech", "Vaccine: "}, vaccineNames}
, SaveDefinitions -> True]](https://www.wolframcloud.com/obj/resourcesystem/images/af2/af26bb30-36ab-4624-a758-6e5c9a8ebfa0/62b939e708e58fa3.png) |
| Out[15]= | 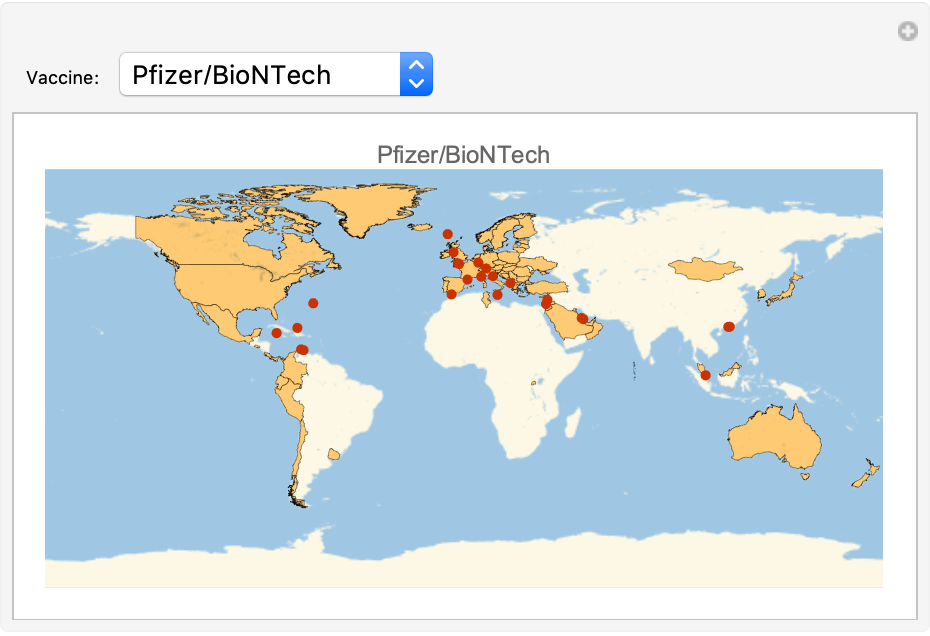 |
This work is licensed under a Creative Commons Attribution 4.0 International License