Basic Examples (3)
Compute the distribution of the amount in excess of 2/3 for a uniform distribution on the interval from 0 to 1:
Compute the mean of the excess:
Compute the distribution of the amount in excess of a point for a uniform distribution in four dimensions:
Compute the mean of the excess:
Compute the distribution of the amount in excess of 10 for a log-normal distribution with a mean of 9 and a median of 3:
Compute the mean and standard deviation:
Scope (2)
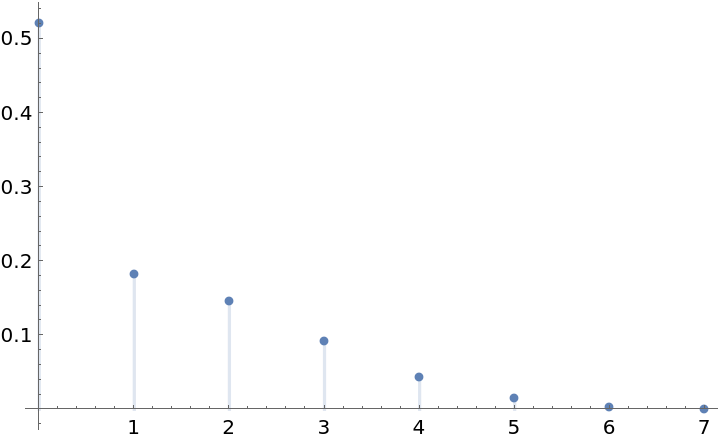
The function works with discrete distributions:
One can compute a symbolic non-negative excess distribution from an underlying symbolic univariate distribution:
Compute various statistics of the resulting distribution:
Calculate for a numeric value:
Properties and Relations (2)
One can nest non-negative excess distributions. Compute the mean amount owed by an insured who has a primary policy that covers up to 2/3 and a secondary policy that will pay any amount remaining (but not exceeding 1/10) after the primary has paid its 2/3:
The result is no different than if there was a primary policy with a limit of 2/3 and 1/10:
Applications (2)
An excess insurer agrees to pay for damages in excess of $250,000 suffered by an insured where the distribution of losses is logarithmic, the mean loss is $10,000, and the median loss is $2,800. What premium would cause the excess insurer to break even:
A reinsurer agrees to pay 80% of the excess insurer's loss that is in turn over $100,000. What premium would cause the reinsurer to break even:
Possible Issues (2)
A mismatch between the dimension of value and the dimension of the distribution dist will gives an invalid distribution:
When one attempts to work with the resulting distribution errors can occur:
Neat Examples (6)
Consider a distribution of judgments in a lawsuit that may be modeled as a log-normal distribution:
Imagine an insurance policy with a limit of 20 and consider the expected positions of the insurer and insured:
Now, consider a second distribution with the same mean but a higher median:
Examine the positions of the insurer and the insured:
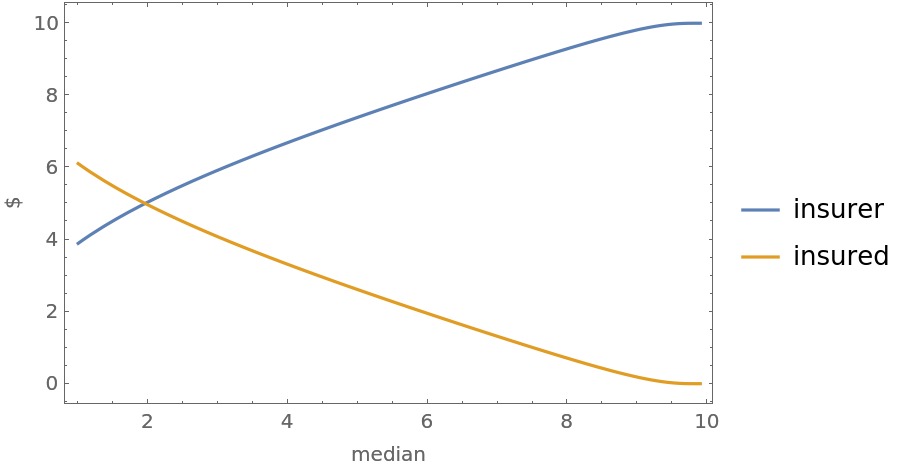
Note the conflict in perspectives. From the perspective of the insurer, the second distribution leaves them in a worse expected position. From the perspective of the insured, the second distribution leaves them in a better position. Plot the difference in case values as the median goes from 1 to 9.9:
Consider how risk aversion alters the analysis. Suppose that when the insured considers two outputs from a distribution, they focus on the worst case:


![ResourceFunction["NonNegativeExcessDistribution"][1/10, ResourceFunction["NonNegativeExcessDistribution"][2/3, UniformDistribution[{0, 1}]]]](https://www.wolframcloud.com/obj/resourcesystem/images/723/7234b8ec-eadf-4a12-8ab3-56ff55ba0dd5/11d58bb661176da6.png)

![NExpectation[d, d \[Distributed] ResourceFunction["NonNegativeExcessDistribution"][250000, ResourceFunction[
ResourceObject[<|"Name" -> "MeanMedianLogNormalDistribution", "ShortName" -> "MeanMedianLogNormalDistribution", "UUID" -> "5af0e61f-890c-4273-8b45-75967c9f256c", "ResourceType" -> "Function", "Version" -> "1.0.0", "Description" -> "Create a lognormal distribution using mean and median as parameters instead of the conventional parameters", "RepositoryLocation" -> URL[
"https://www.wolframcloud.com/obj/resourcesystem/api/1.0"], "SymbolName" -> "FunctionRepository`$99b6a6fd8fd648c4ac9074ef8877525c`MeanMedianLogNormalDistribution", "FunctionLocation" -> CloudObject[
"https://www.wolframcloud.com/obj/da0748d9-6cbb-4132-98fd-fdd3c764b25c"]|>, ResourceSystemBase -> Automatic]][10000, 2800]]]](https://www.wolframcloud.com/obj/resourcesystem/images/723/7234b8ec-eadf-4a12-8ab3-56ff55ba0dd5/0b6f47d282eebd78.png)
![NExpectation[0.8 r, r \[Distributed] ResourceFunction["NonNegativeExcessDistribution"][100000, ResourceFunction["NonNegativeExcessDistribution"][250000, ResourceFunction[
ResourceObject[<|"Name" -> "MeanMedianLogNormalDistribution", "ShortName" -> "MeanMedianLogNormalDistribution", "UUID" -> "5af0e61f-890c-4273-8b45-75967c9f256c", "ResourceType" -> "Function", "Version" -> "1.0.0", "Description" -> "Create a lognormal distribution using mean and median as parameters instead of the conventional parameters", "RepositoryLocation" -> URL[
"https://www.wolframcloud.com/obj/resourcesystem/api/1.0"], "SymbolName" -> "FunctionRepository`$99b6a6fd8fd648c4ac9074ef8877525c`MeanMedianLogNormalDistribution", "FunctionLocation" -> CloudObject[
"https://www.wolframcloud.com/obj/da0748d9-6cbb-4132-98fd-fdd3c764b25c"]|>, ResourceSystemBase -> Automatic]][10000, 2800]]]]](https://www.wolframcloud.com/obj/resourcesystem/images/723/7234b8ec-eadf-4a12-8ab3-56ff55ba0dd5/22f049ca8b700f45.png)
![Plot[{NExpectation[insurer, insurer \[Distributed] CensoredDistribution[{0, 20}, ResourceFunction[
ResourceObject[<|"Name" -> "MeanMedianLogNormalDistribution", "ShortName" -> "MeanMedianLogNormalDistribution", "UUID" -> "5af0e61f-890c-4273-8b45-75967c9f256c", "ResourceType" -> "Function", "Version" -> "1.0.0", "Description" -> "Create a lognormal distribution using mean and median as parameters instead of the conventional parameters", "RepositoryLocation" -> URL[
"https://www.wolframcloud.com/obj/resourcesystem/api/1.0"], "SymbolName" -> "FunctionRepository`$99b6a6fd8fd648c4ac9074ef8877525c`MeanMedianLogNormalDistribution", "FunctionLocation" -> CloudObject[
"https://www.wolframcloud.com/obj/da0748d9-6cbb-4132-98fd-fdd3c764b25c"]|>, ResourceSystemBase -> Automatic]][10, median]]], NExpectation[insured, insured \[Distributed] ResourceFunction["NonNegativeExcessDistribution"][20, ResourceFunction[
ResourceObject[<|"Name" -> "MeanMedianLogNormalDistribution", "ShortName" -> "MeanMedianLogNormalDistribution", "UUID" -> "5af0e61f-890c-4273-8b45-75967c9f256c", "ResourceType" -> "Function", "Version" -> "1.0.0", "Description" -> "Create a lognormal distribution using mean and median as parameters instead of the conventional parameters", "RepositoryLocation" -> URL[
"https://www.wolframcloud.com/obj/resourcesystem/api/1.0"], "SymbolName" -> "FunctionRepository`$99b6a6fd8fd648c4ac9074ef8877525c`MeanMedianLogNormalDistribution", "FunctionLocation" -> CloudObject[
"https://www.wolframcloud.com/obj/da0748d9-6cbb-4132-98fd-fdd3c764b25c"]|>, ResourceSystemBase -> Automatic]][10, median]]]}, {median, 1, 9.9}, Sequence[
PlotLegends -> {"insurer", "insured"}, Frame -> True, FrameLabel -> {"median", "$"}]]](https://www.wolframcloud.com/obj/resourcesystem/images/723/7234b8ec-eadf-4a12-8ab3-56ff55ba0dd5/1dcd0ae4d16cb59c.png)

![{Mean[CensoredDistribution[{0, 20}, j]], Mean@Map[Max, RandomVariate[
ResourceFunction["NonNegativeExcessDistribution"][20, j], {1000, 2}]]} // N](https://www.wolframcloud.com/obj/resourcesystem/images/723/7234b8ec-eadf-4a12-8ab3-56ff55ba0dd5/1d9a38d95b429307.png)
![{Mean[CensoredDistribution[{0, 20}, j2]], Mean@Map[Max, RandomVariate[
ResourceFunction["NonNegativeExcessDistribution"][20, j2], {1000,
2}]]} // N](https://www.wolframcloud.com/obj/resourcesystem/images/723/7234b8ec-eadf-4a12-8ab3-56ff55ba0dd5/5332d9b6351c4a3a.png)