Create a graph by successively applying a function and differently tagging edges corresponding to different outputs
Contributed by:
Nikolay Murzin and Ed Pegg Jr.
Examples
Basic Examples (5)
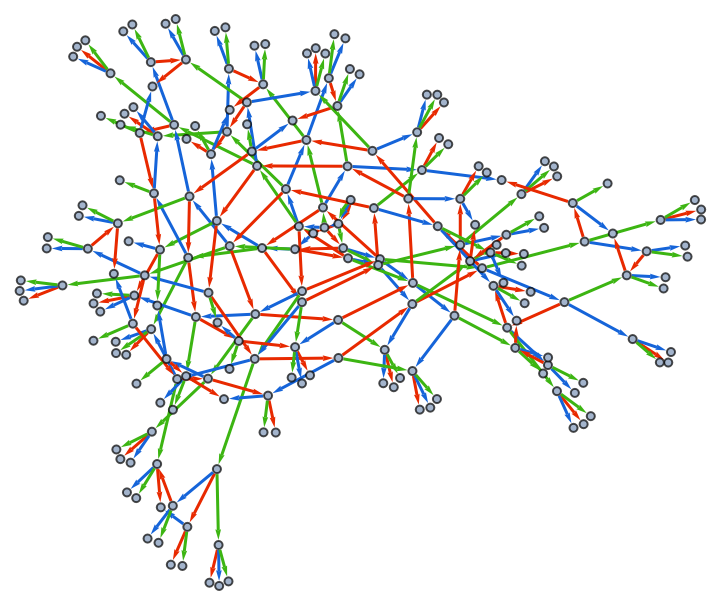
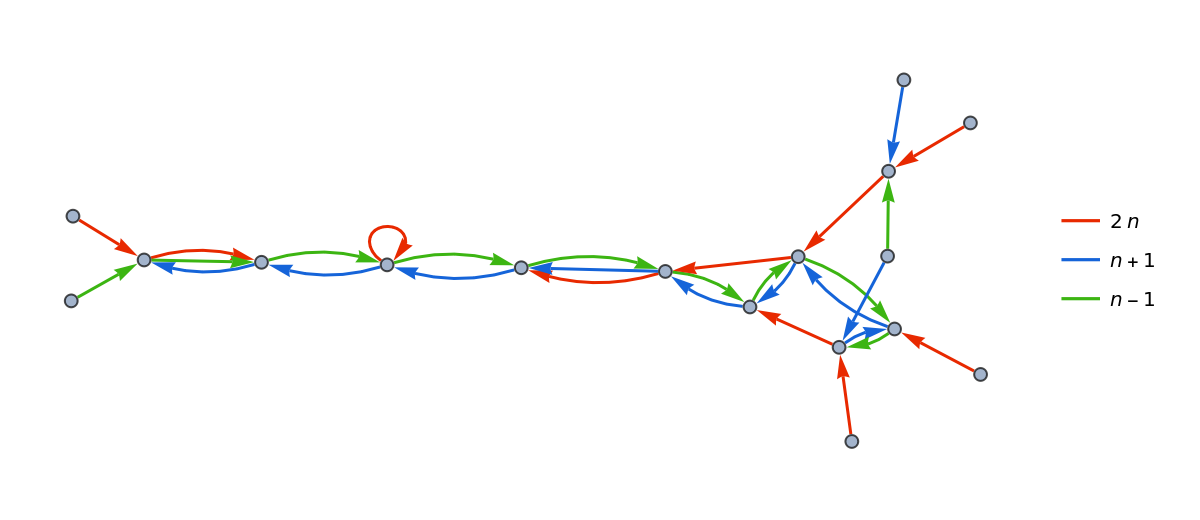
Make a nested graph with edge coloring:
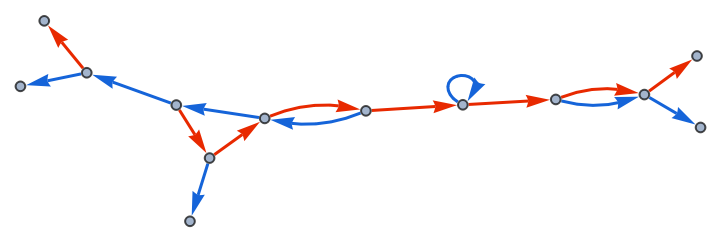
Use a pure function:
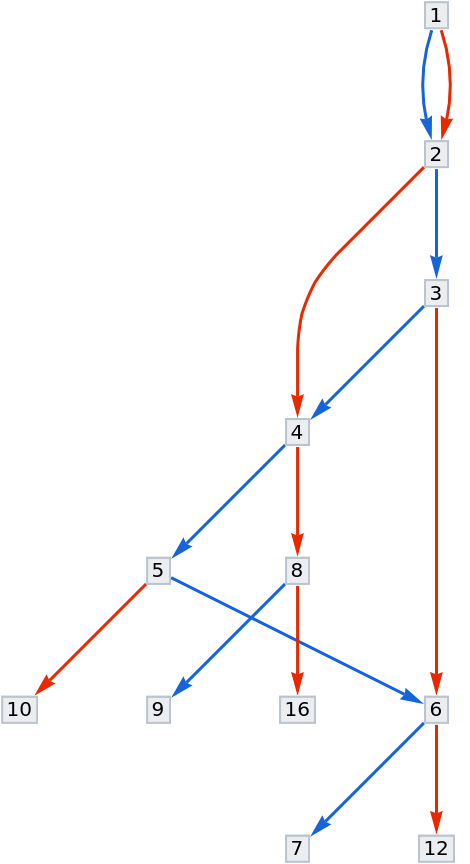
Use a list of initial expressions:
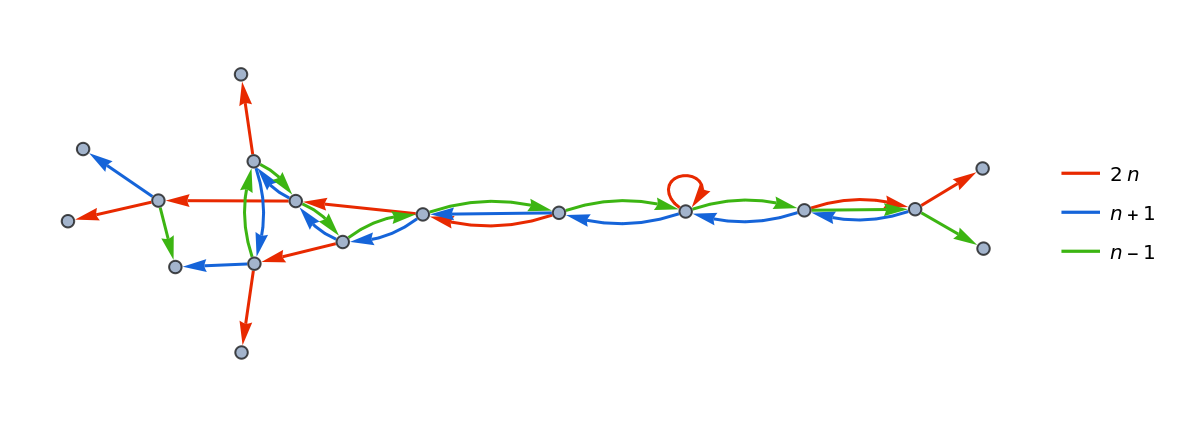
Add a legend to explain colors:
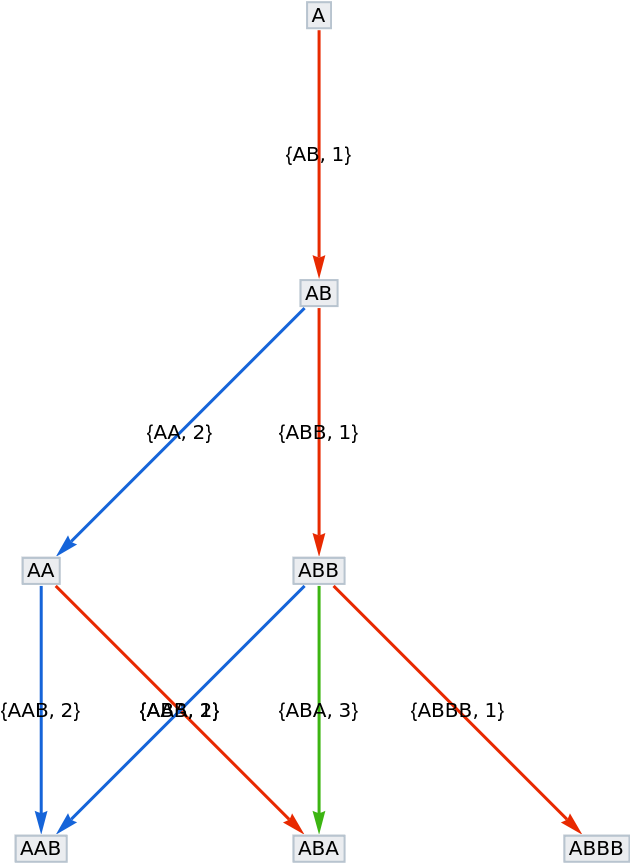
Label the vertex states in a nested graph:
Scope (5)
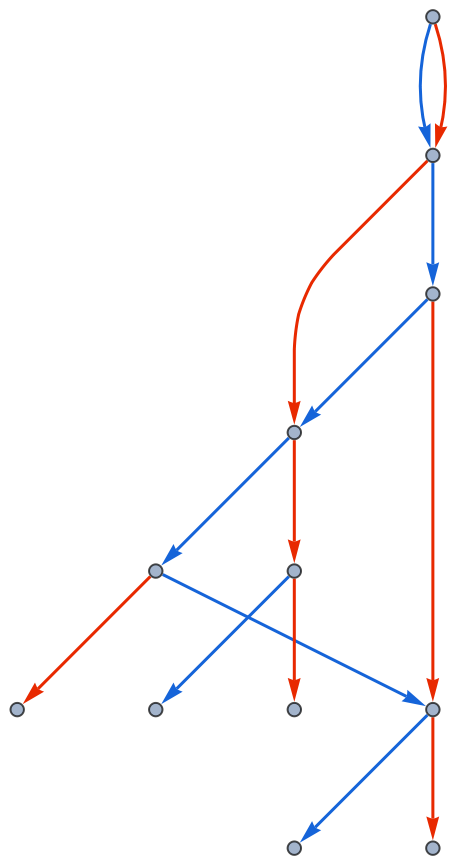
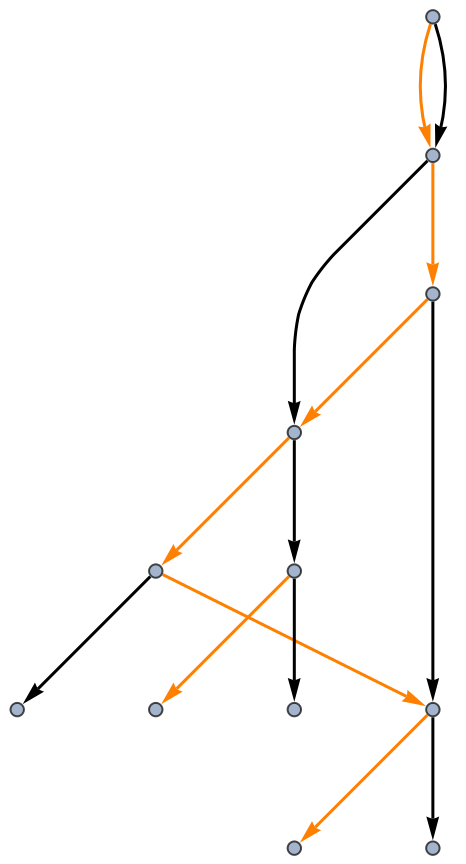
Edge colorings can be overridden:
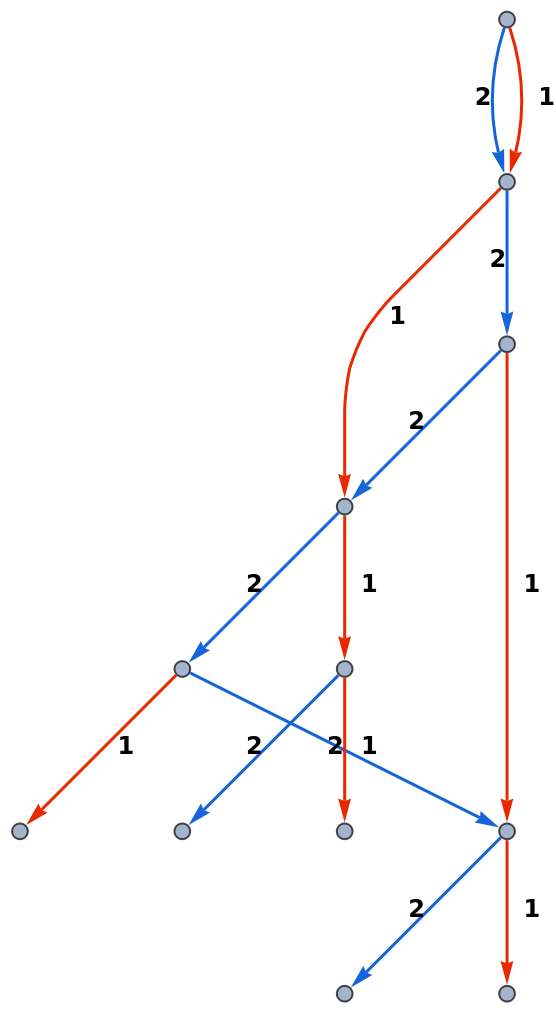
Add labels to edges:
Add tooltips to edges:
An alternate type of edge labeling:
Make custom edge tags by constructing rule values:
Options (5)
StateLabeling (1)
Turn on special vertex shapes:
FormattingFunction (1)
Change the formatting for vertex 31:
RuleStyling (1)
Use custom styles for output values:
PostProcessGraph (1)
If the output is graphics, it is useful to apply some custom function to the graph itself:
TagHead (1)
Instead of Rule, use a custom head to specify edge tags:
Neat Examples (2)
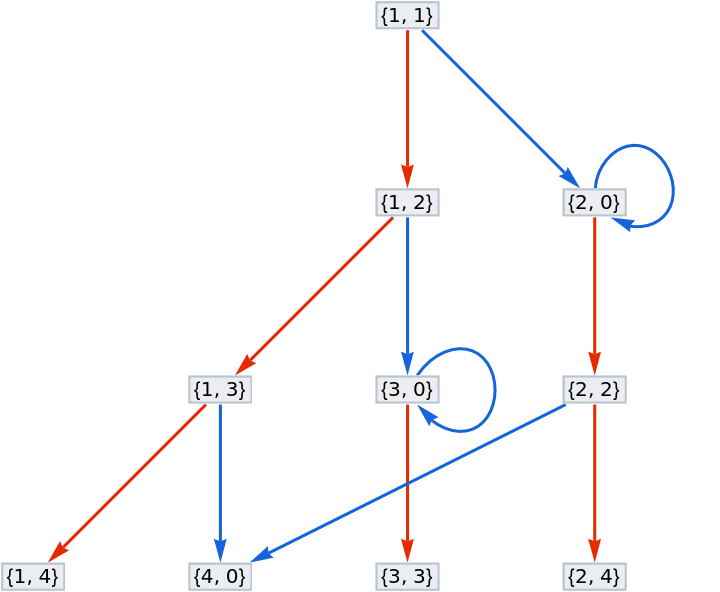
Vertices can be number pairs:
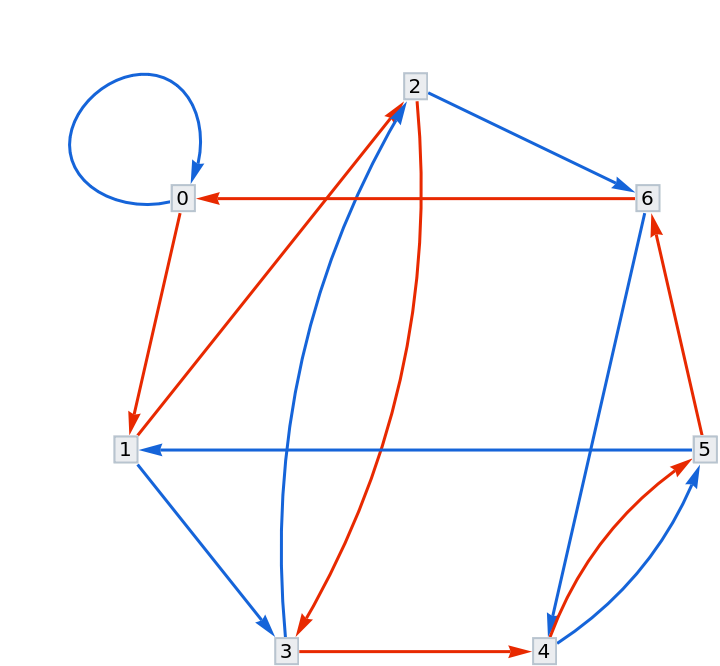
For a remainder graph, to find 2143 (mod 7), start at 0 and follow  (2143) to get remainder 1:
Version History
-
2.0.1
– 03 October 2022
-
2.0.0
– 27 September 2022
-
1.1.0
– 11 January 2022
Related Resources
![ResourceFunction["NestGraphTagged"][n |-> {2 n, n + 1, n - 1}, {1}, 4,
PlotLegends -> TraditionalForm /@ {2 n, n + 1, n - 1}]](https://www.wolframcloud.com/obj/resourcesystem/images/bc9/bc9dac5e-7af2-4317-8e0b-693d5ab67bf4/1-1-0/3b22e722f5140d26.png)
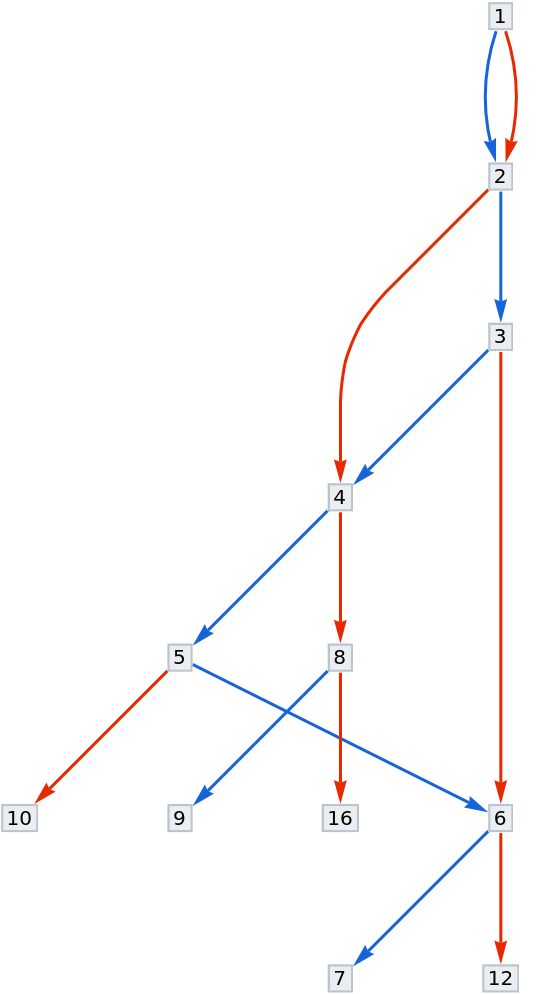

![ResourceFunction["NestGraphTagged"][n |-> {2 n, n + 1}, {1}, 4, EdgeLabels -> {
DirectedEdge[_, _, t_] /; OddQ[t] :> Placed[t, {1/2, {-1, 1/2}}],
DirectedEdge[_, _, t_] /; EvenQ[t] :> Placed[t, {1/2, {1, 1/2}}]}, EdgeLabelStyle -> Directive[12, Bold]]](https://www.wolframcloud.com/obj/resourcesystem/images/bc9/bc9dac5e-7af2-4317-8e0b-693d5ab67bf4/1-1-0/4c51e9e9b2aea923.png)

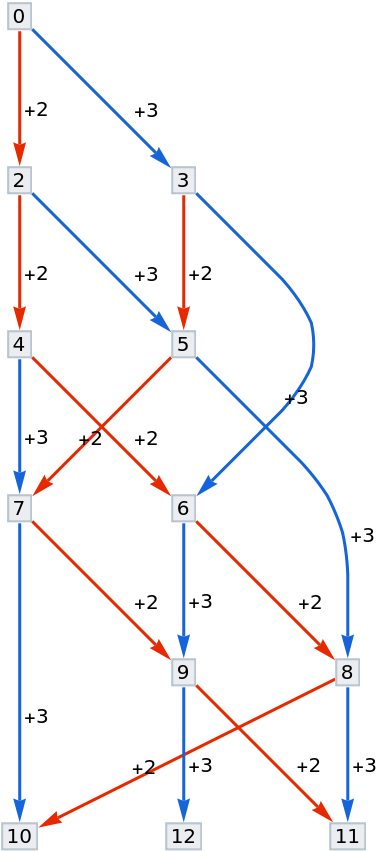
![ResourceFunction["NestGraphTagged"][n |-> {n + 2, n + 3}, 0, 4, "StateLabeling" -> True, EdgeLabels -> {
1 -> Placed["+2", {.7, {-.2, 0}}], 2 -> Placed["+3", {.7, {-.2, 0}}]
}]](https://www.wolframcloud.com/obj/resourcesystem/images/bc9/bc9dac5e-7af2-4317-8e0b-693d5ab67bf4/1-1-0/66d17c613d63be84.png)

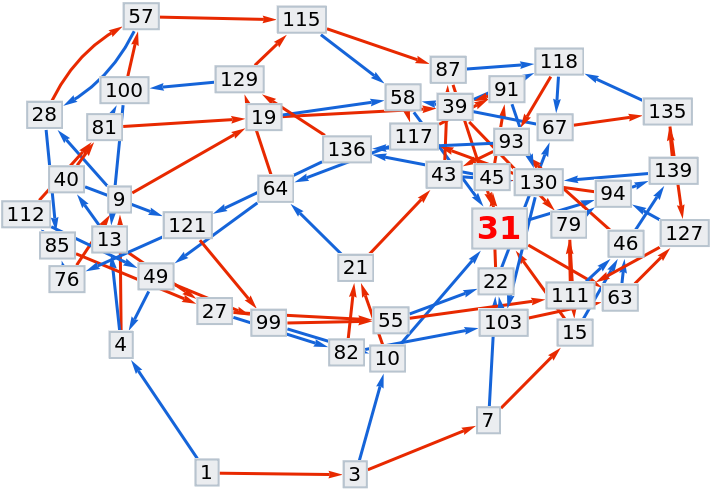
![ResourceFunction["NestGraphTagged"][
n |-> Mod[{2 n + 1, 3 n + 1}, 144], {1}, 200, "StateLabeling" -> True, "FormattingFunction" -> (# /. {31 -> Style[31, Red, Bold, 16], x_ :> Style[x, Black]} &)]](https://www.wolframcloud.com/obj/resourcesystem/images/bc9/bc9dac5e-7af2-4317-8e0b-693d5ab67bf4/1-1-0/23cb9441c6ebcf1d.png)
![ResourceFunction["NestGraphTagged"][n |-> {2 n, n + 1, n - 1}, {1}, 4,
"PostProcessGraph" -> ReverseGraph, PlotLegends -> TraditionalForm /@ {2 n, n + 1, n - 1}]](https://www.wolframcloud.com/obj/resourcesystem/images/bc9/bc9dac5e-7af2-4317-8e0b-693d5ab67bf4/1-1-0/38611927a623d150.png)
![ResourceFunction["NestGraphTagged"][v |-> Mod[{v + 1, 10 v}, 7], Range[1], 10, "StateLabeling" -> True, GraphLayout -> "CircularEmbedding"]](https://www.wolframcloud.com/obj/resourcesystem/images/bc9/bc9dac5e-7af2-4317-8e0b-693d5ab67bf4/1-1-0/341003b77e6d71d5.png)