Wolfram Function Repository
Instant-use add-on functions for the Wolfram Language
Function Repository Resource:
Plot the evolution of a multiway system
ResourceFunction["MultiwayEvolutionPlot"][rules,init,n] plots the first n steps in the evolution of the multiway system with the specified rules starting from initial conditions init. |
| "EvolutionEventRendering" | "SingleArrow" | how to render the events in the evolution |
| "VerticalSpacing" | 2 | vertical spacing between rows |
| "HorizontalSpacing" | 1.5 | horizontal spacing between elements |
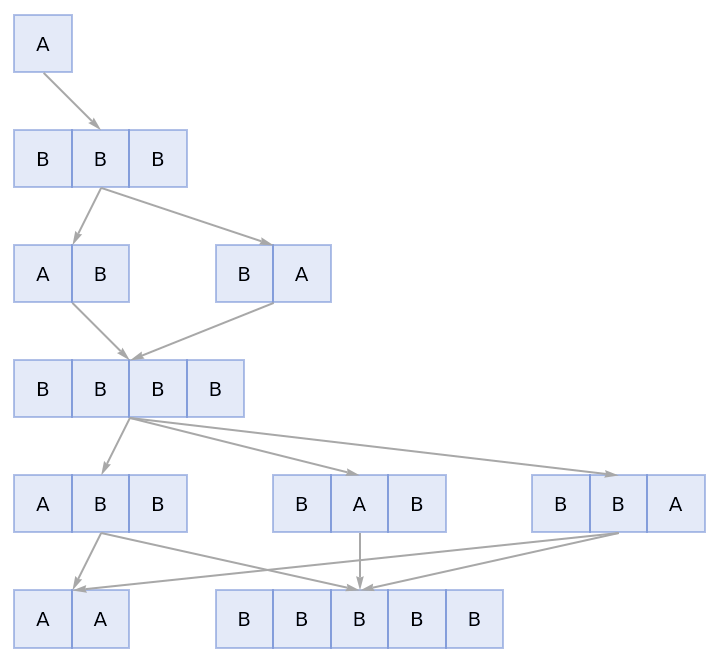
| "SingleArrow" | a single arrow between connected states (as in A New Kind of Science) |
| "PositionalArrows" | arrows indicating the center of each rewrite event |
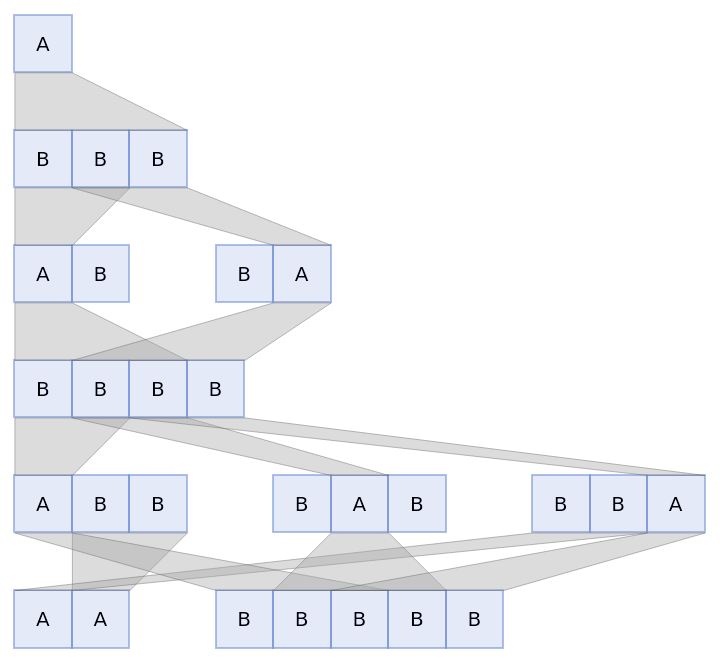
| "PositionalPolygons" | polygons indicating the extent of each rewrite event |
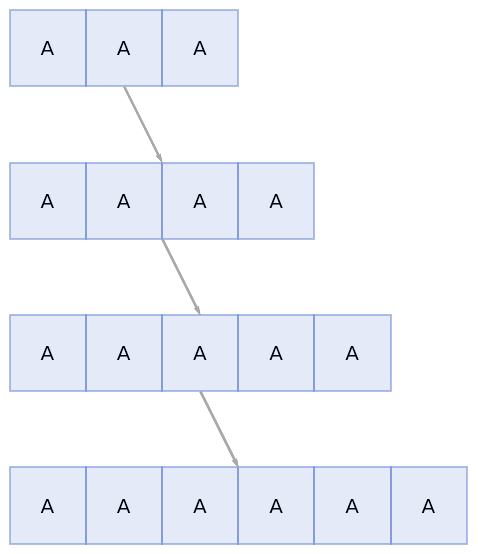
Plot a basic multiway evolution:
| In[1]:= |
|
| Out[1]= |

|
Plot a more complicated multiway evolution with arrows showing the rewrite events:
| In[2]:= |
|
| Out[2]= |

|
Plot the same multiway evolution but with polygons highlighting the rewrite events:
| In[3]:= |
|
| Out[4]= |

|
MultiwayEvolutionPlot accepts both individual rules and lists of rules:
| In[5]:= |
|
| Out[5]= |

|
| In[6]:= |
|
| Out[6]= |

|
Likewise for initial conditions:
| In[7]:= |
|
| Out[7]= |

|
Default plot with single arrows between states:
| In[8]:= |
|
| Out[8]= |

|
Separate arrows indicating the center of the beginning and end of each rewrite event:
| In[9]:= |
|
| Out[9]= |

|
Polygons indicating the extent of the beginning and end of each rewrite event:
| In[10]:= |
|
| Out[10]= |

|
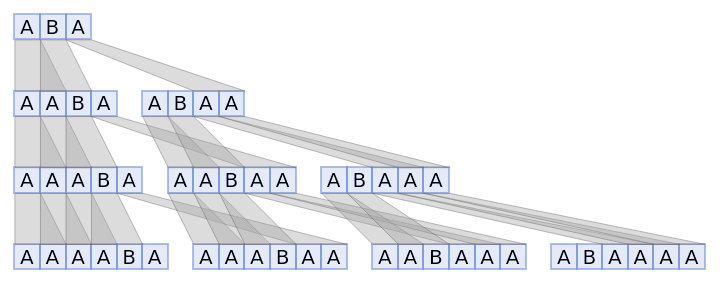
Specify spacings in terms of element sizes:
| In[11]:= |
![ResourceFunction[
"MultiwayEvolutionPlot"][{"A" -> "AA", "B" -> "AB"}, "ABA", 3, "EvolutionEventRendering" -> "PositionalPolygons", "VerticalSpacing" -> 3, "HorizontalSpacing" -> 1]](https://www.wolframcloud.com/obj/resourcesystem/images/a35/a3531c46-0c72-451e-a5e5-ee108d903e11/09ee499309b4e700.png)
|
| Out[11]= |

|
This work is licensed under a Creative Commons Attribution 4.0 International License