Examples
Basic Examples (3)
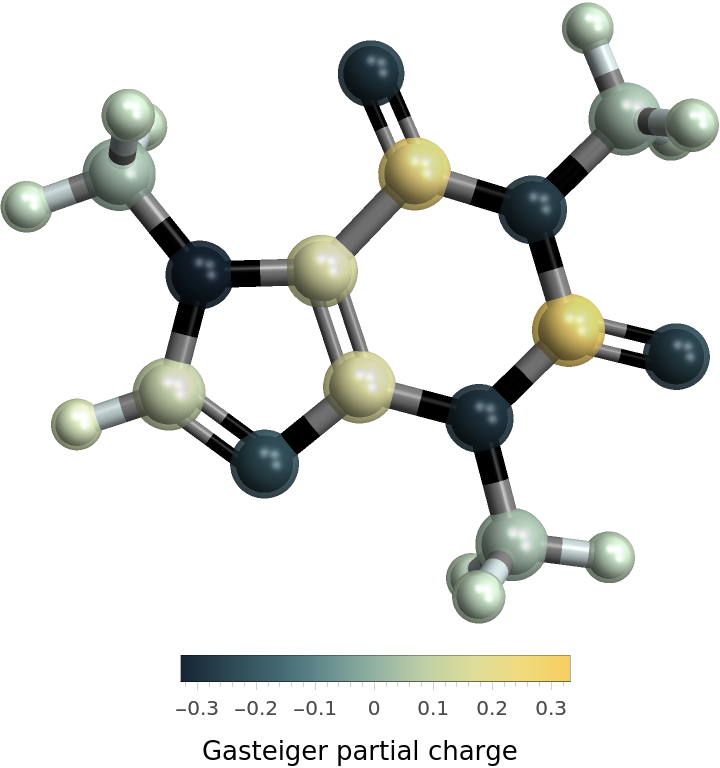
Color each atom according to its partial charge:
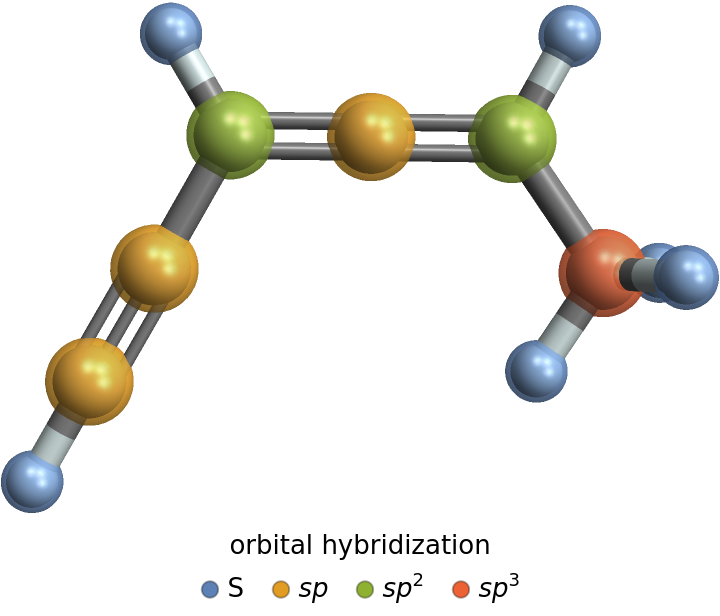
Color atoms according to their hybridization:
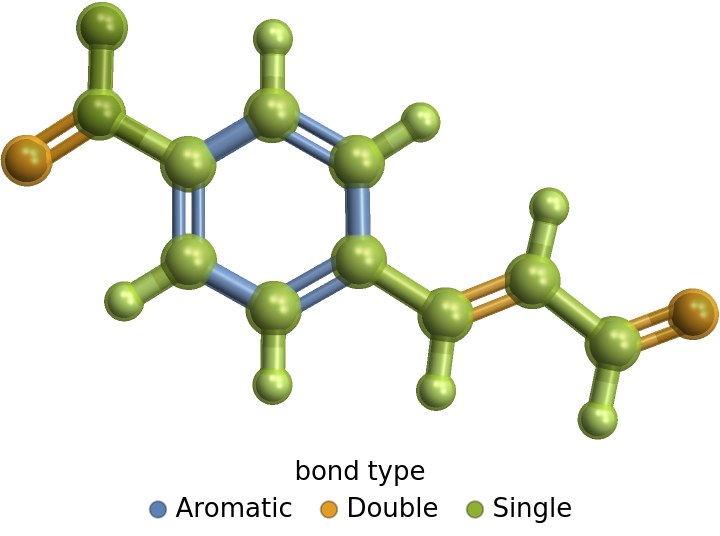
Color bonds according to their bond type:
Scope (2)
The atom and bond properties can be accessed via MoleculeValue and EntityProperties:
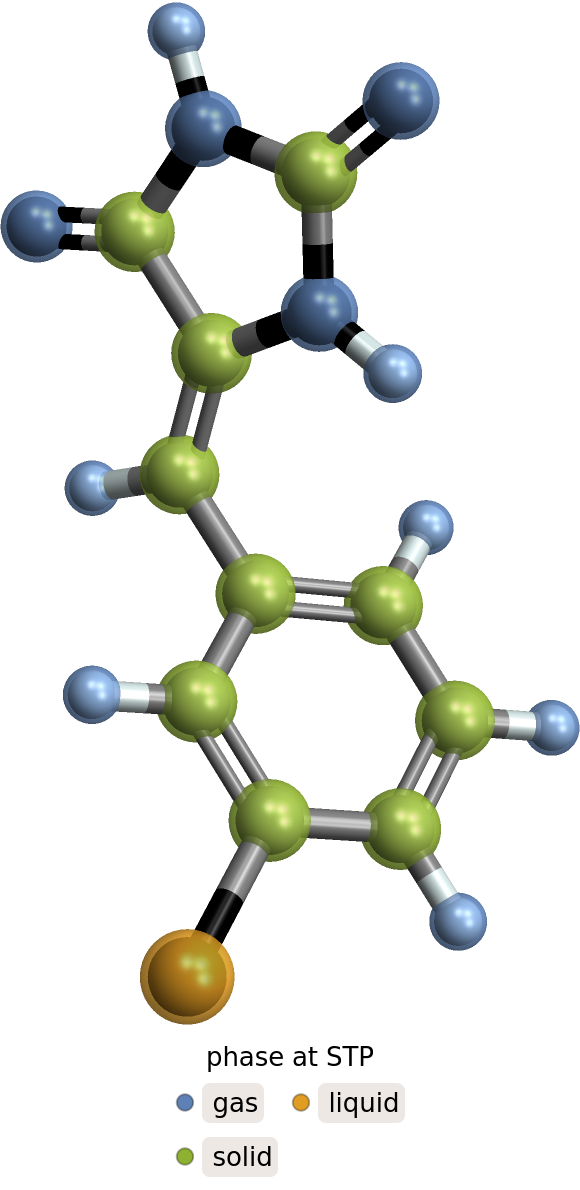
Label atoms by their phase at standard temperature and pressure:
Options (4)
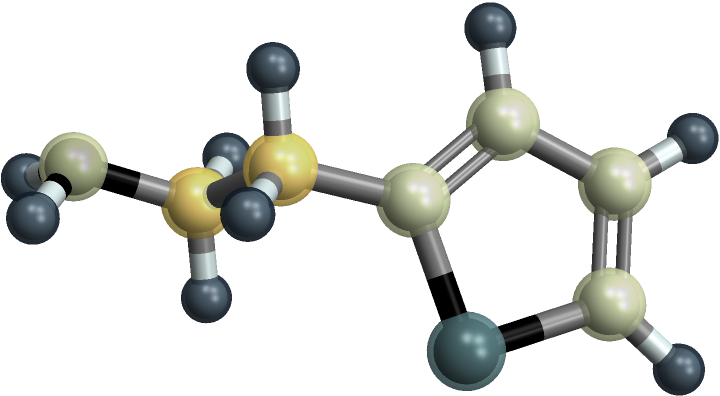
Disable the plot legends using the PlotLegends option:
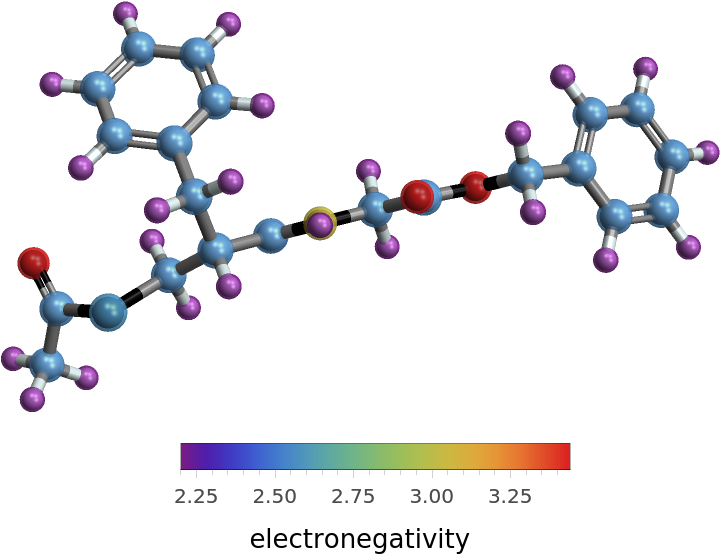
Specify an alternate color function for numeric data:
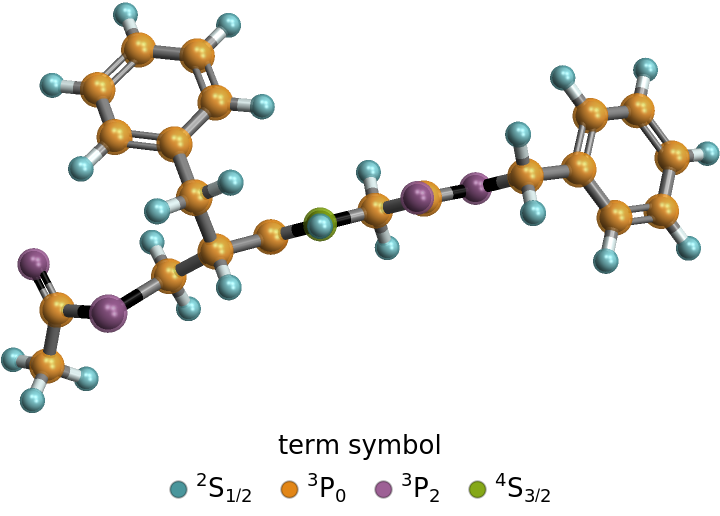
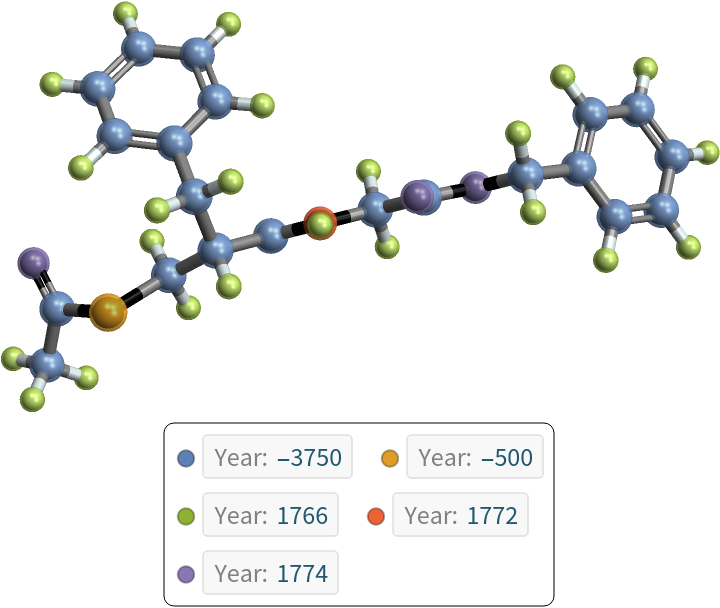
Specify an alternate color function for discrete data:
Pass options directly to the legend:
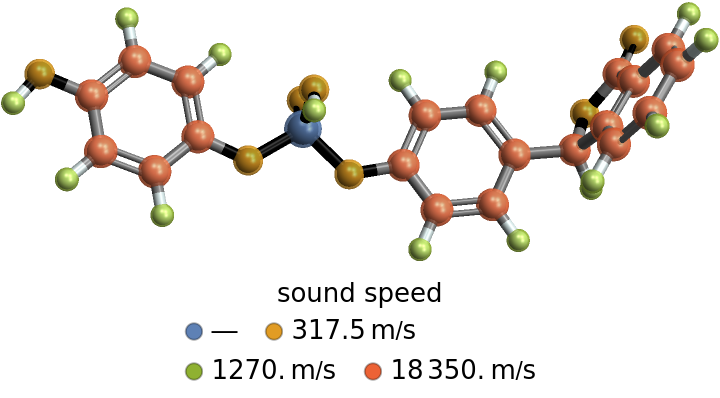
When some values are missing, the data is treated as discrete rather than numeric:
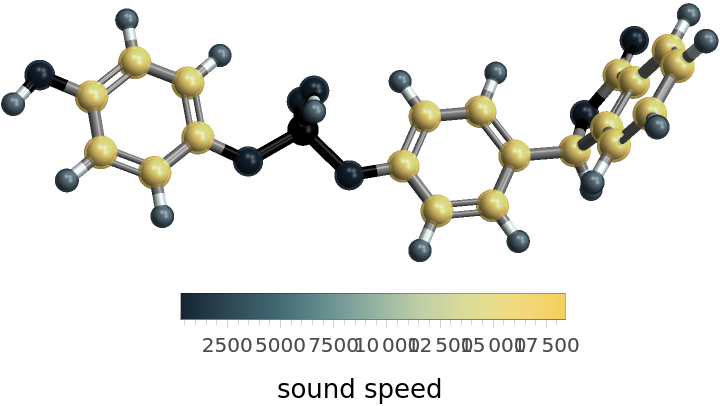
Use MissingQ to exclude missing values:
Neat Examples (1)
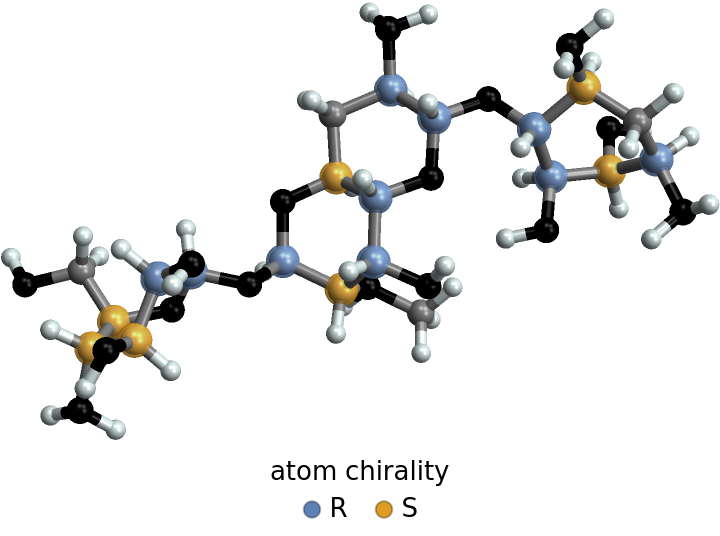
Label atoms by their chirality, using the "ExclusionFunction" option to make sure achiral atoms are not labeled:
Version History
-
1.1.1
– 20 May 2022
-
1.1.0
– 07 March 2022
-
1.0.1
– 09 November 2021
Related Resources


![m = Molecule[
"(5Z)-5-[(3-bromophenyl)methylidene]imidazolidine-2,4-dione"];
ResourceFunction["MoleculeValuePlot3D"][m, EntityProperty["Element", "Phase"]]](https://www.wolframcloud.com/obj/resourcesystem/images/2b7/2b765766-54af-4fcf-af23-717d75167bfe/1-1-0/511ea2d405ef6489.png)
![ResourceFunction["MoleculeValuePlot3D"][
Molecule[Entity["Chemical", "2Thiopheneethylamine"]], "CoordinationNumber", PlotLegends -> None]](https://www.wolframcloud.com/obj/resourcesystem/images/2b7/2b765766-54af-4fcf-af23-717d75167bfe/1-1-0/207f787ae6cb984a.png)
![ResourceFunction["MoleculeValuePlot3D"][
Molecule["O=C(CNC(=O)[C@@H](Cc1ccccc1)CSC(=O)C)OCc1ccccc1"], EntityProperty["Element", "Electronegativity"], ColorFunction -> "Rainbow"]](https://www.wolframcloud.com/obj/resourcesystem/images/2b7/2b765766-54af-4fcf-af23-717d75167bfe/1-1-0/5fd07ea48e1b3e33.png)
![ResourceFunction["MoleculeValuePlot3D"][
Molecule["O=C(CNC(=O)[C@@H](Cc1ccccc1)CSC(=O)C)OCc1ccccc1"], EntityProperty["Element", "TermSymbol"], ColorFunction -> 98]](https://www.wolframcloud.com/obj/resourcesystem/images/2b7/2b765766-54af-4fcf-af23-717d75167bfe/1-1-0/4c1b765080e766a7.png)
![ResourceFunction["MoleculeValuePlot3D"][
Molecule["O=C(CNC(=O)[C@@H](Cc1ccccc1)CSC(=O)C)OCc1ccccc1"], EntityProperty["Element", "DiscoveryYear"], LegendLabel -> None, LegendFunction -> "Frame"]](https://www.wolframcloud.com/obj/resourcesystem/images/2b7/2b765766-54af-4fcf-af23-717d75167bfe/1-1-0/3d65552e53c8a9f0.png)
![ResourceFunction["MoleculeValuePlot3D"][
Molecule["Oc1ccc(cc1)O[P@](=O)(Oc1ccc(cc1)[C@H]1OC(=O)c2c1cccc2)O"], EntityProperty["Element", "SoundSpeed"]]](https://www.wolframcloud.com/obj/resourcesystem/images/2b7/2b765766-54af-4fcf-af23-717d75167bfe/1-1-0/40f471d713699770.png)
![ResourceFunction["MoleculeValuePlot3D"][
Molecule["Oc1ccc(cc1)O[P@](=O)(Oc1ccc(cc1)[C@H]1OC(=O)c2c1cccc2)O"], EntityProperty["Element", "SoundSpeed"], "ExclusionFunction" -> MissingQ]](https://www.wolframcloud.com/obj/resourcesystem/images/2b7/2b765766-54af-4fcf-af23-717d75167bfe/1-1-0/51944d50922bac2d.png)
![(* Evaluate this cell to get the example input *) CloudGet["https://www.wolframcloud.com/obj/b2676015-29c0-4ca9-9f17-67bbd34aee3d"]](https://www.wolframcloud.com/obj/resourcesystem/images/2b7/2b765766-54af-4fcf-af23-717d75167bfe/1-1-0/6150f4adf5fbb995.png)
