Wolfram Function Repository
Instant-use add-on functions for the Wolfram Language
Function Repository Resource:
Show a molecule in 3D together with its symmetry elements
ResourceFunction["MoleculeSymmetryPlot3D"][mol] returns a Manipulate combining a 3D plot of the Molecule mol together with graphical depictions of its symmetry elements. |
| Tube | rotation axes |
| Sphere | inversion centers |
| Hyperplane | reflection panes |
Tetramethyl ammonium has Td symmetry:
| In[1]:= |
| Out[2]= |
Visualize the symmetry elements present:
| In[3]:= |
| Out[3]= | 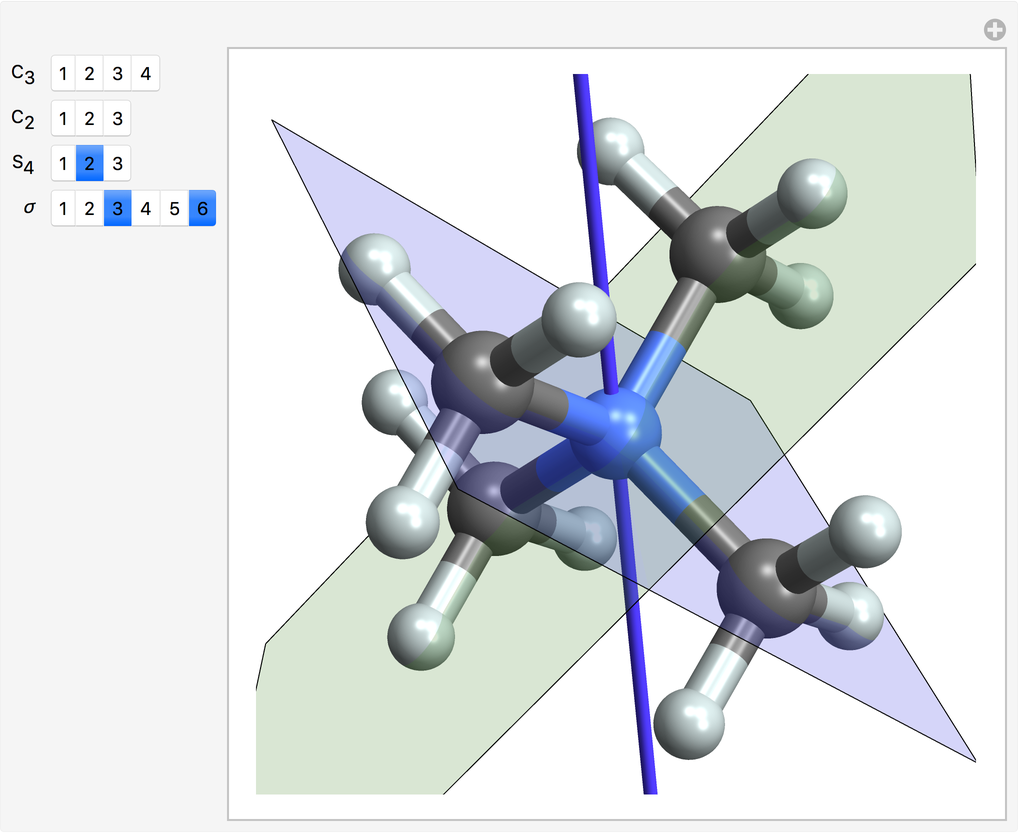 |
Visualize the C2 rotation axes in benzene:
| In[4]:= |
| Out[4]= | 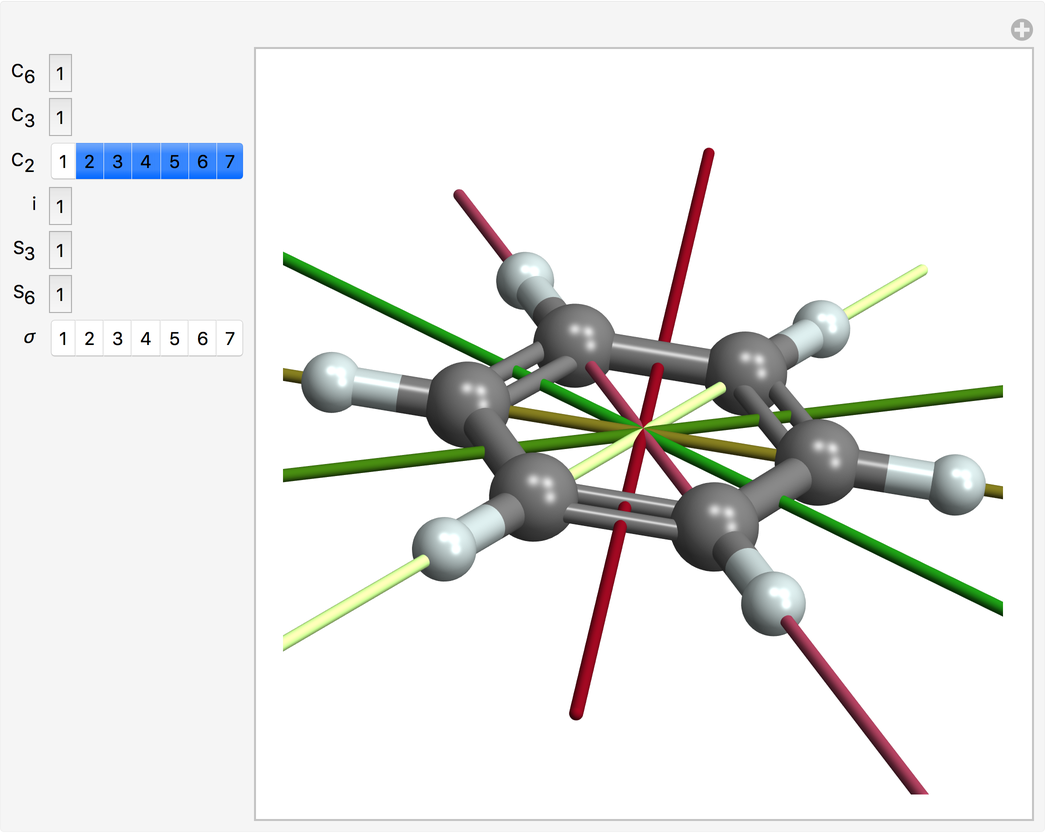 |
If a molecule's coordinates are not symmetric, no symmetry elements will be found:
| In[5]:= | ![SeedRandom[12];
mol = Fold[
MoleculeModify[#1, {"SetBondLength", #2 -> RandomReal[{.9, 1.2}]}] &, Molecule["methane"], BondList[m1]]](https://www.wolframcloud.com/obj/resourcesystem/images/7ee/7ee202ec-c4a8-40d0-86ed-615aa2cab37d/0ca1bac3047af5b7.png) |
| Out[6]= |
| In[7]:= |
| Out[7]= | 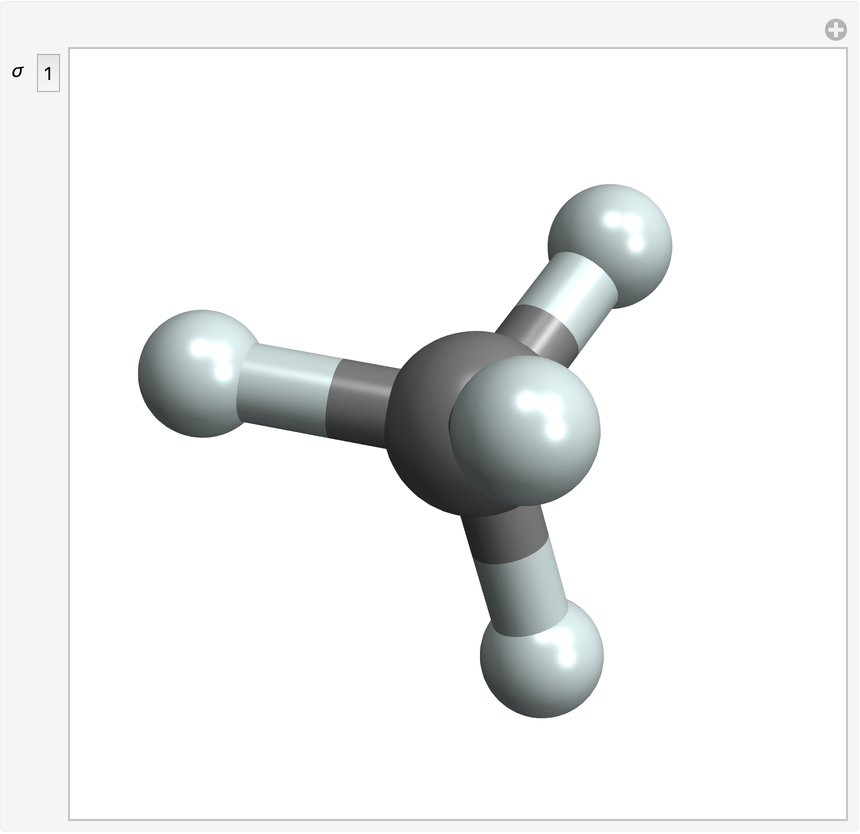 |
Use the Merck molecular force field to find coordinates with higher symmetry:
| In[8]:= |
| Out[8]= | 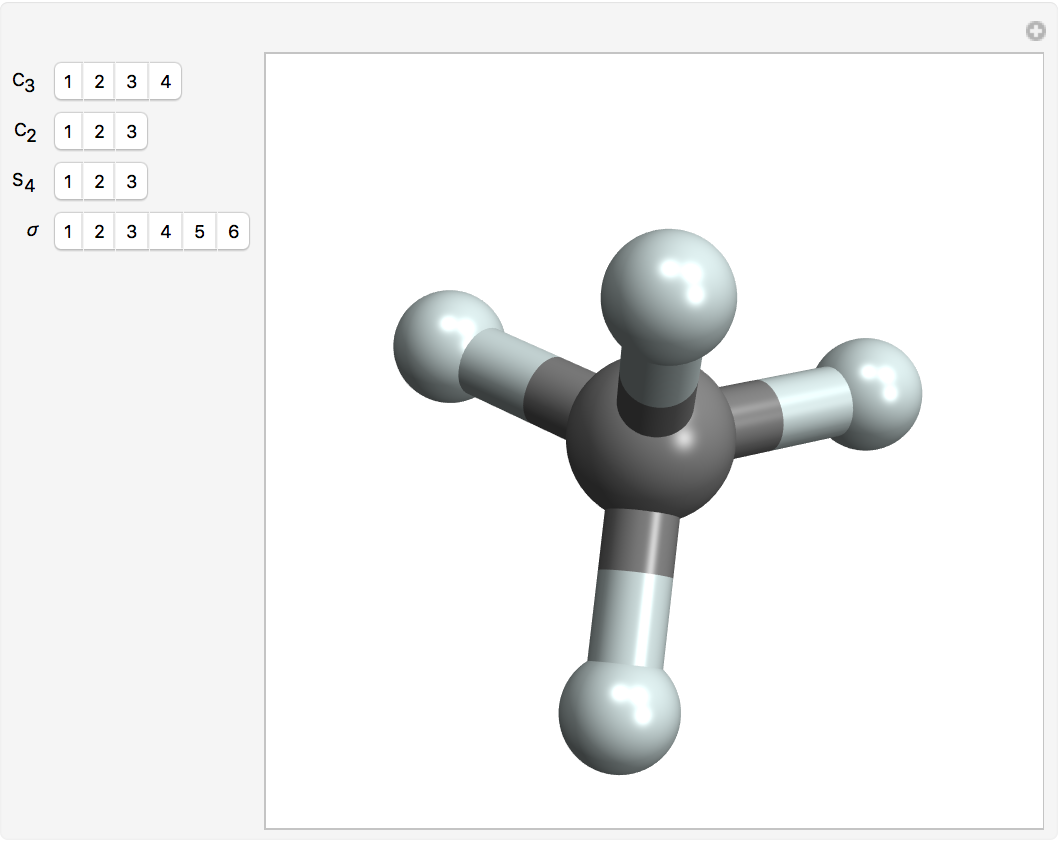 |
This work is licensed under a Creative Commons Attribution 4.0 International License