Wolfram Function Repository
Instant-use add-on functions for the Wolfram Language
Function Repository Resource:
Visualize the distribution of molecule shapes in a 2D scatter plot
ResourceFunction["MoleculePrincipalMomentPlot"][mols] returns a ternary scatter plot for mols using the normalized principal moments ratios as coordinates. |
Create 300 molecules from SMILES strings and generate a principal moments plot:
| In[1]:= |
| In[2]:= |
| Out[2]= | 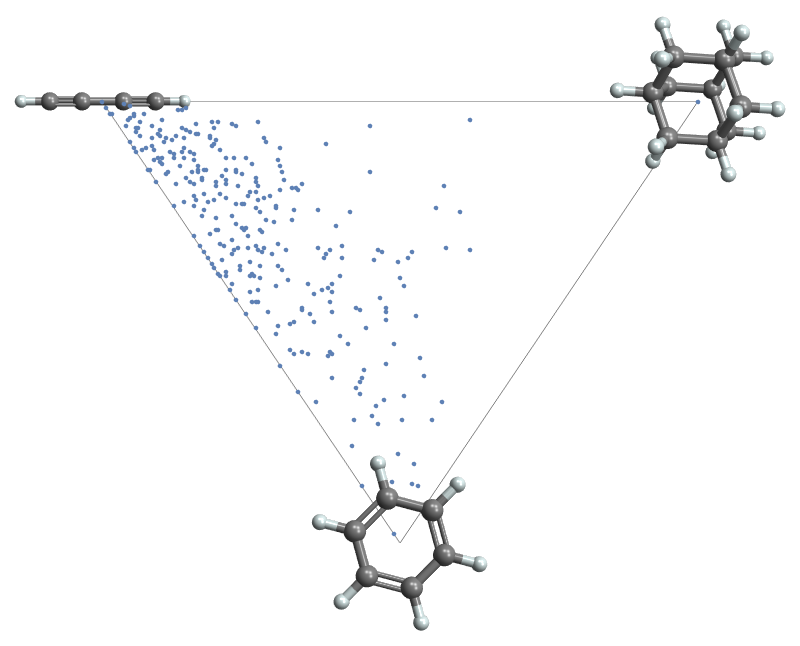 |
Points in the scatter plot have tooltips showing the corresponding molecule as a 3D graphic:
| In[3]:= |
| In[4]:= |
| Out[4]= |
Use the option "Tooltips"→False to eliminate the tooltips:
| In[5]:= |
| Out[5]= |
MoleculePrincipalMomentPlot will take options for MoleculePlot3D and apply them to the insets and tooltips:
| In[6]:= |
| Out[6]= | 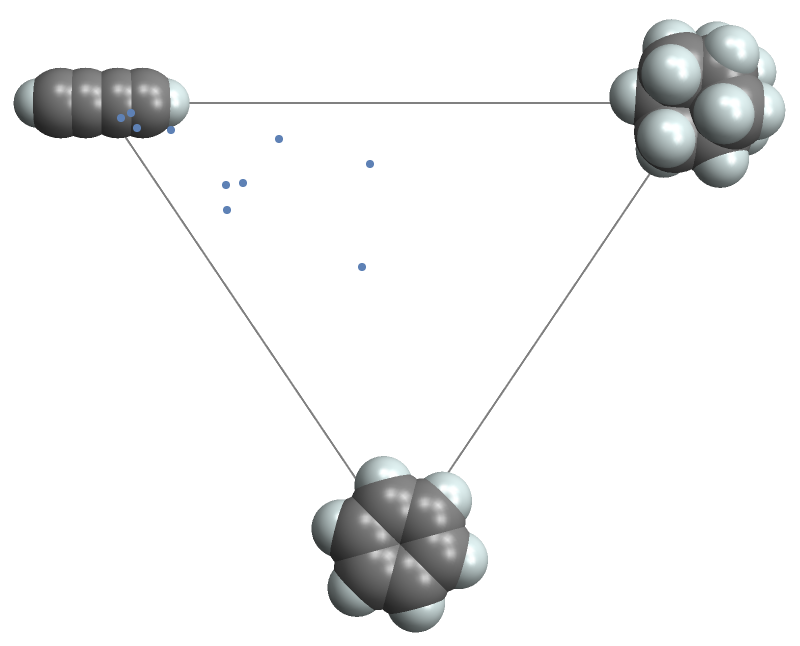 |
Display the plot without vertex labels:
| In[7]:= |
| Out[7]= | 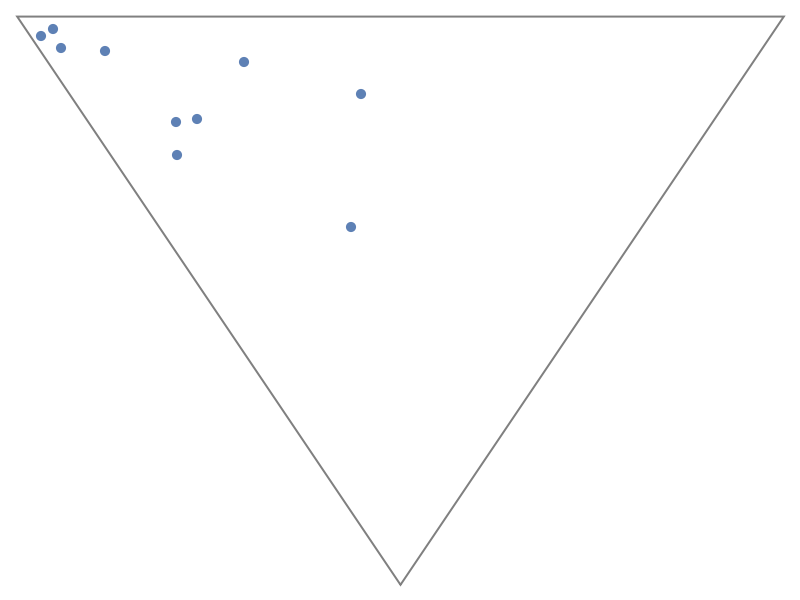 |
It is possible to use different images for the vertex labels. First create a list of three expressions:
| In[8]:= |
| Out[8]= | 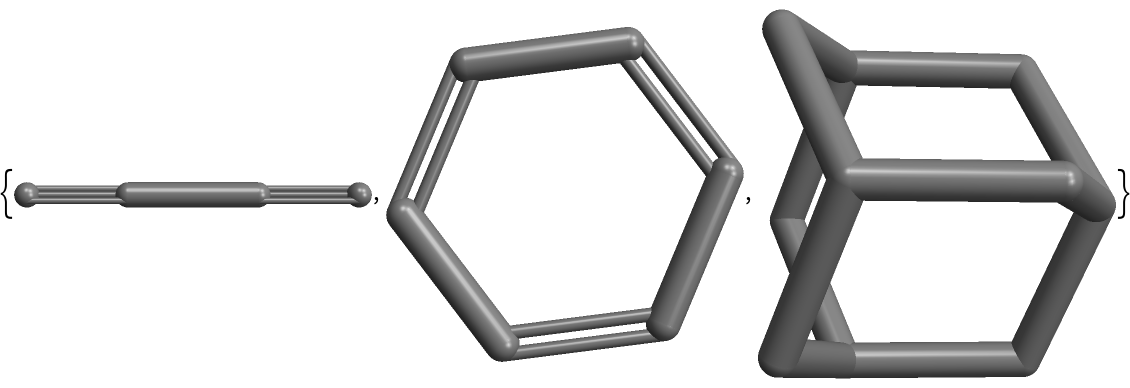 |
Then give these to the VertexLabels option:
| In[9]:= |
| Out[9]= | 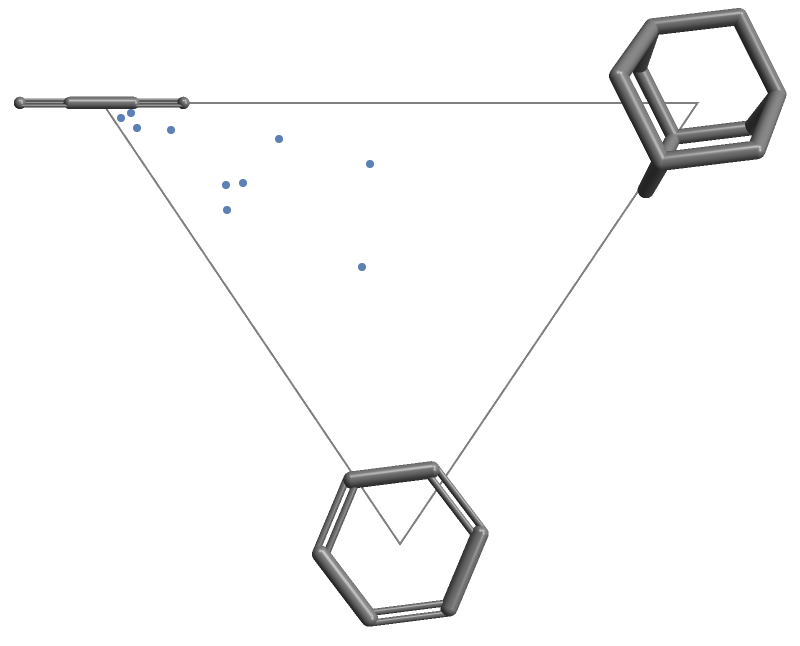 |
Import the GDB-9 molecular database as an EntityStore:
| In[10]:= |
| Out[10]= |
Write a helper function to convert these entities to Molecule objects:
| In[11]:= | ![gdbMolecule[ent_] := Quiet[Molecule@
DeleteMissing@
EntityValue[
ent, {"VertexTypes", "EdgeRules", "EdgeTypes", "FormalCharges", "IsomericSMILES", "NonStandardIsotopeNumbers", "VertexCoordinates", "AtomPositions"}, "PropertyAssociation"], Molecule::valenc]](https://www.wolframcloud.com/obj/resourcesystem/images/fb5/fb52ac89-87d5-426a-aa61-630cb6d985fe/1979eea7ba032700.png) |
| In[12]:= |
| In[13]:= |
| Out[13]= | 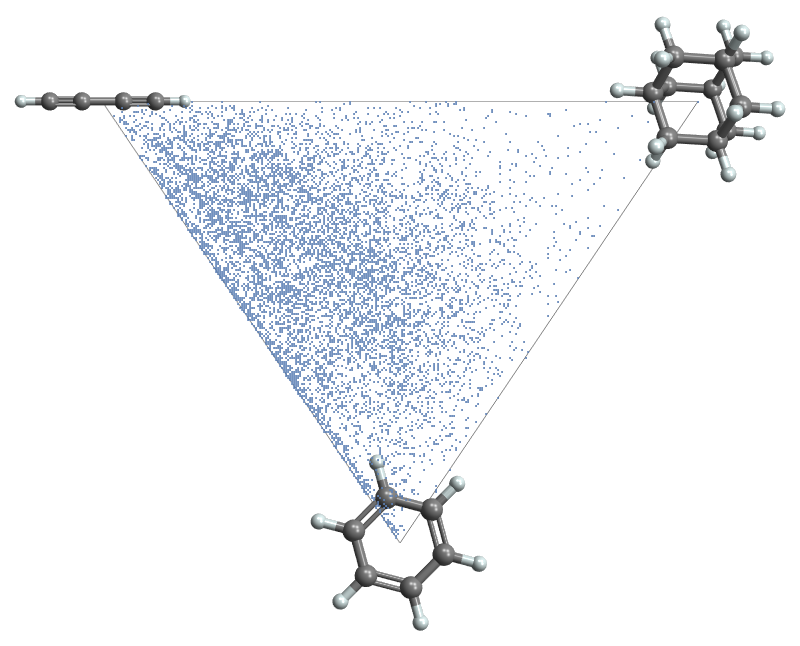 |
This work is licensed under a Creative Commons Attribution 4.0 International License