Wolfram Function Repository
Instant-use add-on functions for the Wolfram Language
Function Repository Resource:
Import data from the Dirección General de Epidemiología website
ResourceFunction["MexicoCOVID19Data"][] retrieves COVID-19 data from the Dirección General de Epidiemología website. |
Retrieve the dataset:
| In[1]:= |
| Out[1]= | 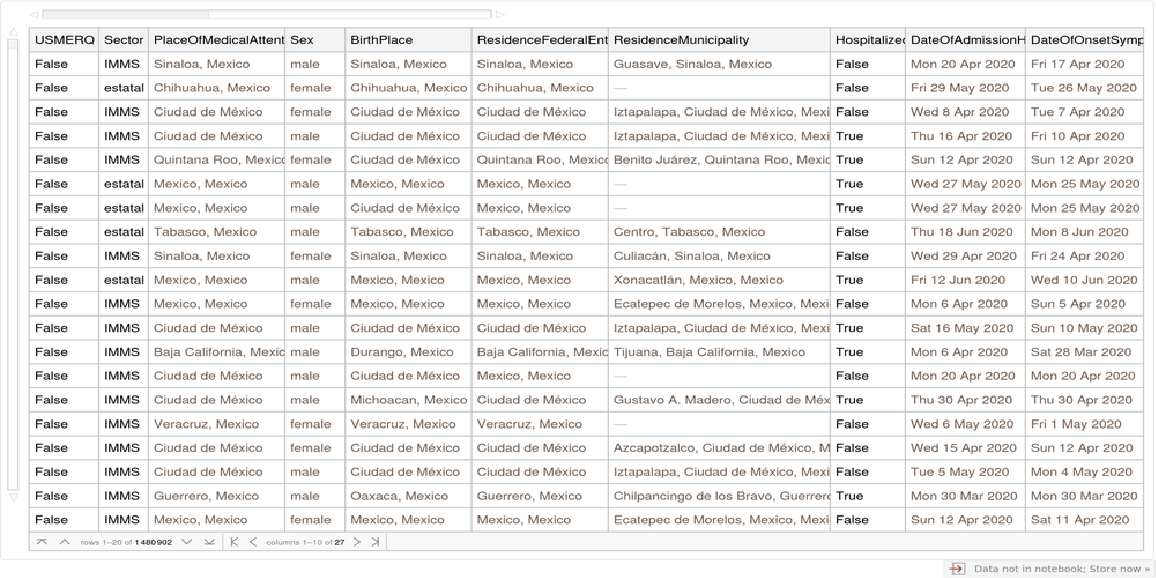 |
Compare the age distributions between male and female cases:
| In[2]:= | ![PairedHistogram[Sequence @@ (Normal@#[Values]), ChartLabels -> Normal@#[Keys], Sequence[PlotLabel -> "age distribution", PlotTheme -> "Business"]] &@
mexicoCOVIDdata[GroupBy["Sex"], Select[! MissingQ[#Age] &], "Age"]](https://www.wolframcloud.com/obj/resourcesystem/images/dbd/dbd4a959-3dd7-4dd9-bc60-ee9681ab4d83/7beb55816b5c9af9.png) |
| Out[2]= | 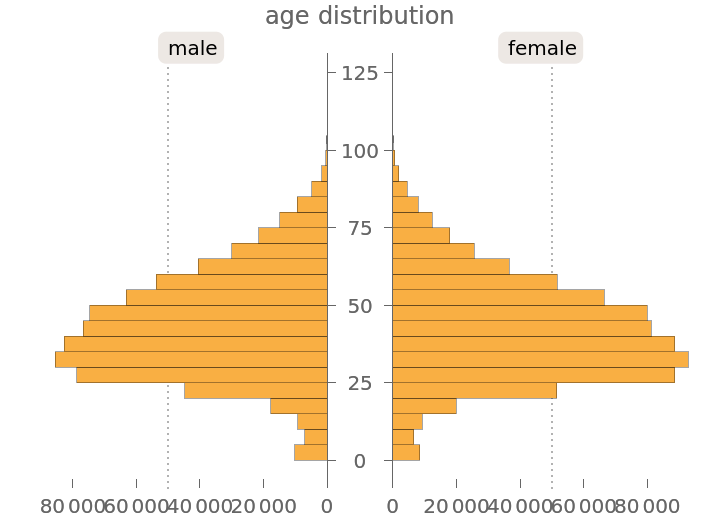 |
Plot a geographical heat map showing the number of cases per federal entity:
| In[3]:= |
| Out[3]= | 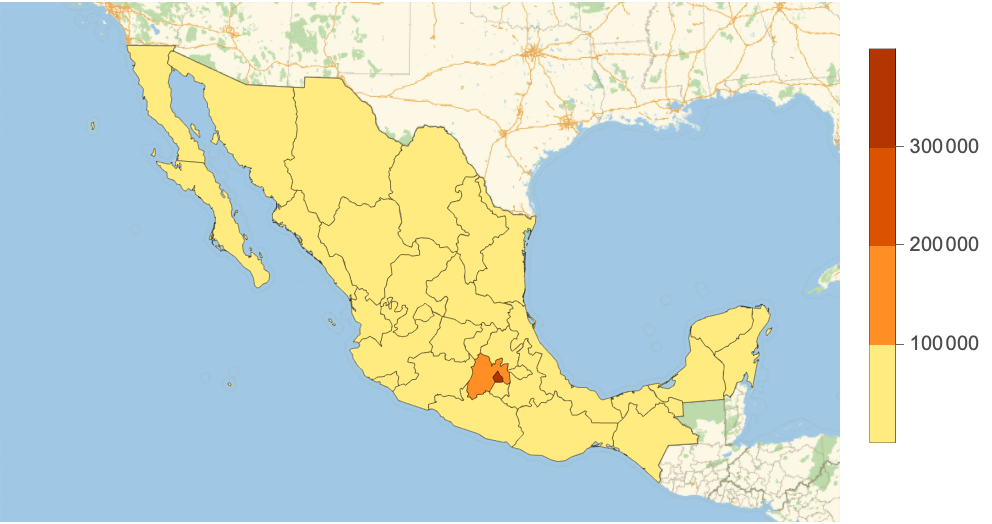 |
Plot the daily number of recorded cases:
| In[4]:= | ![dailyCasesTimeSeries = TimeSeries@
KeyValueMap[{#1, #2} &, Normal@mexicoCOVIDdata[Counts, "DateOfAdmissionHospital"]];
dailyCasesAccumulate = Accumulate@dailyCasesTimeSeries;
dailyCasesMA = MovingAverage[dailyCasesTimeSeries, 7];](https://www.wolframcloud.com/obj/resourcesystem/images/dbd/dbd4a959-3dd7-4dd9-bc60-ee9681ab4d83/33262c8b357a7299.png) |
| In[5]:= | ![DateListPlot[{dailyCasesTimeSeries, dailyCasesMA}, FrameLabel -> {None, "Number of cases per day"}, PlotLegends -> {"time series", "moving average"}]](https://www.wolframcloud.com/obj/resourcesystem/images/dbd/dbd4a959-3dd7-4dd9-bc60-ee9681ab4d83/3819dff2d45a8673.png) |
| Out[5]= | 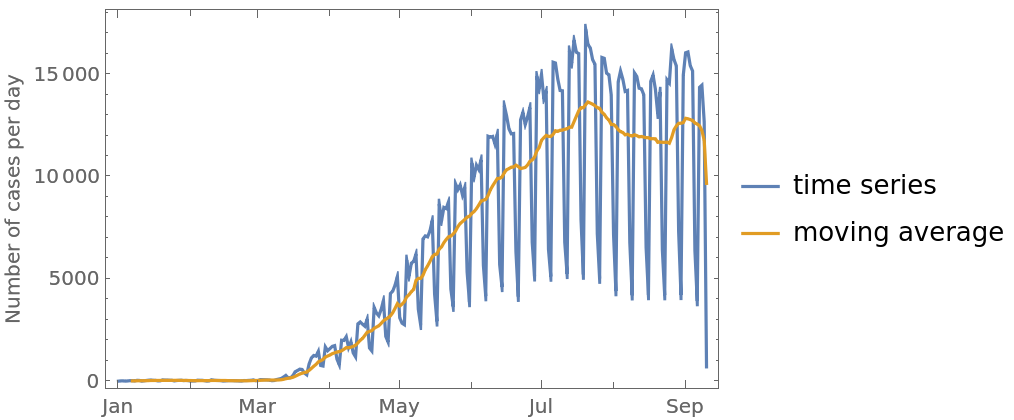 |
Plot the total number of recorded cases over time:
| In[6]:= |
| Out[6]= | 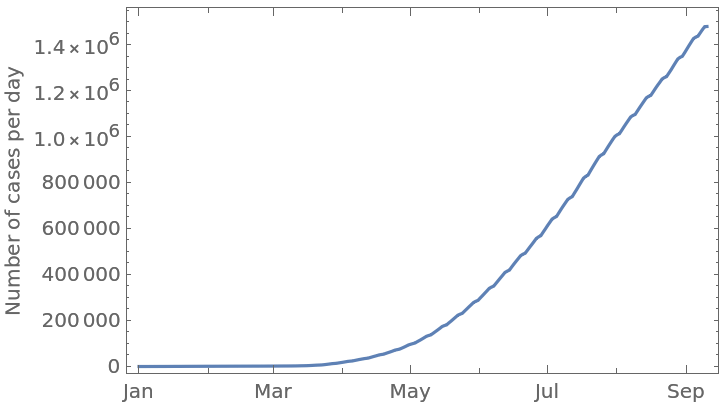 |
Look at and sort by the most common comorbidities:
| In[7]:= |
| Out[7]= | 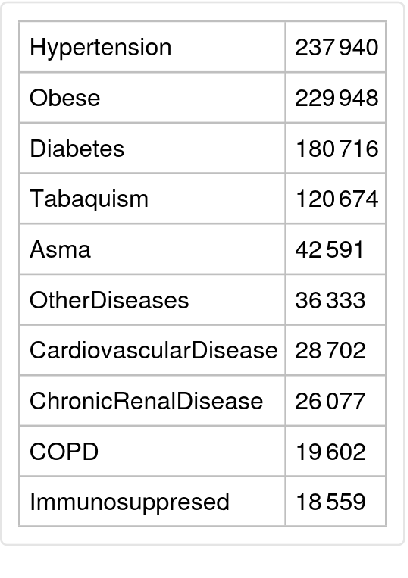 |
Some federal entities have a much larger population and this can make it difficult to see differences between low-population entities. To visualize the number of recorded cases relative to the entity’s population, you can plot the number of COVID-19 cases per 1000 people:
| In[8]:= | ![GeoRegionValuePlot[
KeyValueMap[#1 -> (1000*#2/
QuantityMagnitude[
AdministrativeDivisionData[#1, "Population"]]) &, Normal@mexicoCOVIDdata[Counts, "PlaceOfMedicalAttention"]]]](https://www.wolframcloud.com/obj/resourcesystem/images/dbd/dbd4a959-3dd7-4dd9-bc60-ee9681ab4d83/444ffb09a1944353.png) |
| Out[8]= | 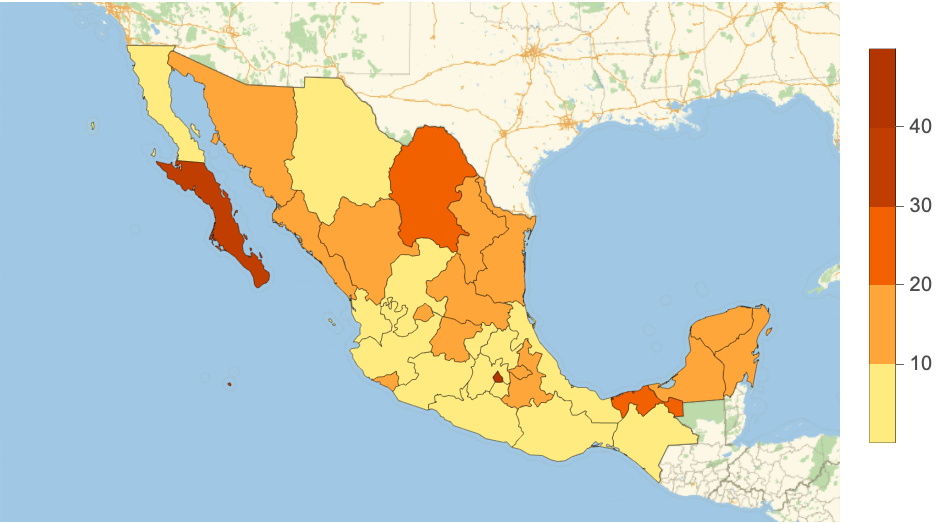 |
Look at the time series of a specific state:
| In[9]:= | ![stateTS = TimeSeries@
KeyValueMap[{#1, #2} &, Normal@mexicoCOVIDdata[
Select[#PlaceOfMedicalAttention == Entity["AdministrativeDivision", {"Oaxaca", "Mexico"}] &]/*
Counts, "DateOfAdmissionHospital"]];
stateTSMA = MovingAverage[stateTS, 7];
DateListPlot[{stateTS, stateTSMA}, FrameLabel -> {None, "Number of cases per day"}, PlotLegends -> {"time series", "moving average"}, PlotLabel -> Entity["AdministrativeDivision", {"Oaxaca", "Mexico"}]]](https://www.wolframcloud.com/obj/resourcesystem/images/dbd/dbd4a959-3dd7-4dd9-bc60-ee9681ab4d83/2711ec5c1b2cb1af.png) |
| Out[4]= | 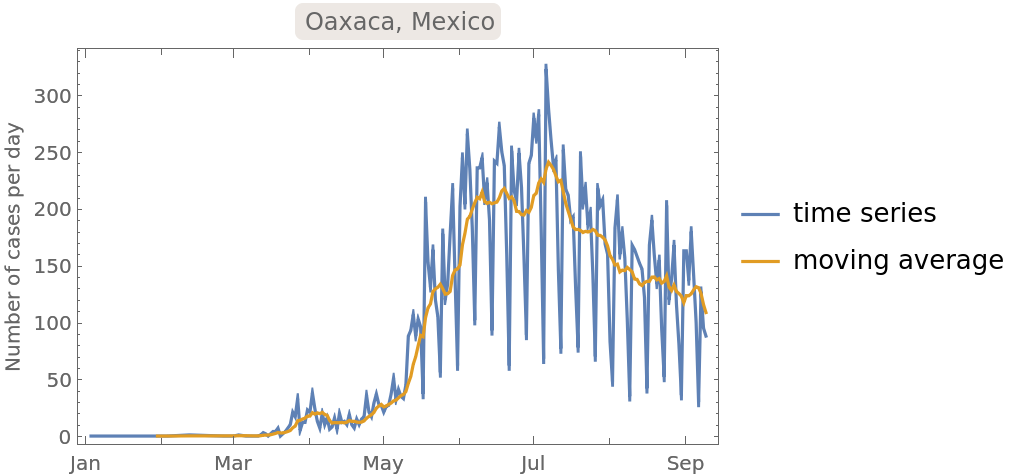 |
See the descriptions of the columns from the original dataset:
| In[10]:= |
| Out[10]= |  |
See the dataset in Spanish instead of English:
| In[11]:= |
| Out[11]= | 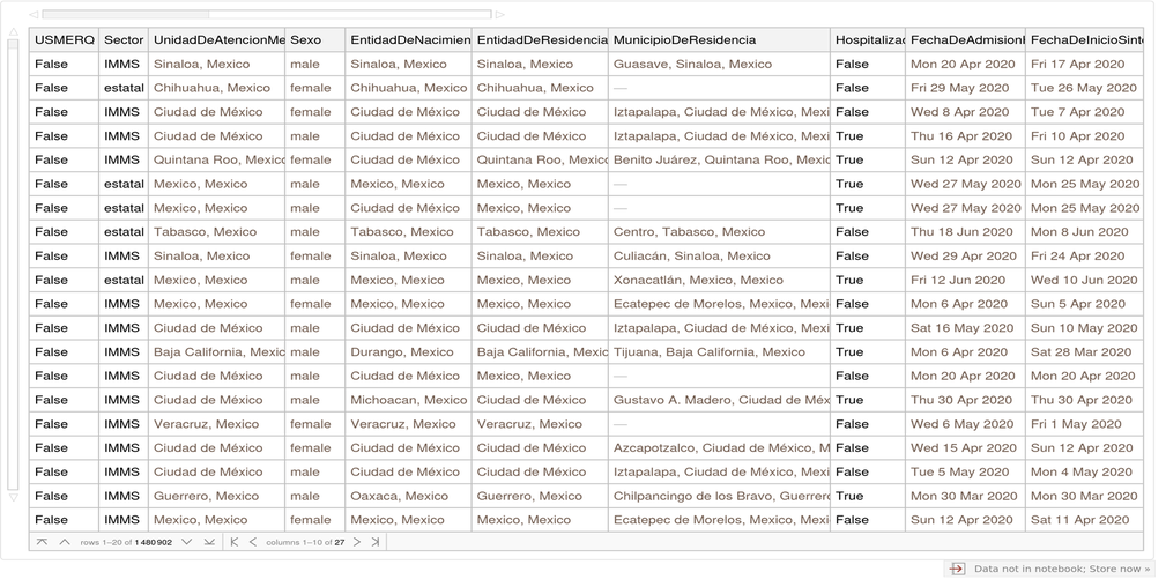 |
This work is licensed under a Creative Commons Attribution 4.0 International License