Wolfram Function Repository
Instant-use add-on functions for the Wolfram Language
Function Repository Resource:
Plot 2D data together with visualizations of the marginal distributions
ResourceFunction["MarginalPlot"][data] produces a ListPlot of 2D data together with visualizations of the marginal distributions. | |
ResourceFunction["MarginalPlot"][data,binspec] uses the bin specification binspec. |
| “MarginalChartType" | Histogram | the chart type used to display the marginal distributions |
| “MarginalChartScale" | 0.3 | proportion of space provided for charts of marginal distributions |
| “MarginalChartOptions" | {} | list of any options supported by the visualization used for the marginal distributions |
See the marginal distributions of 2D data together with the data:
| In[1]:= |
| Out[1]= | 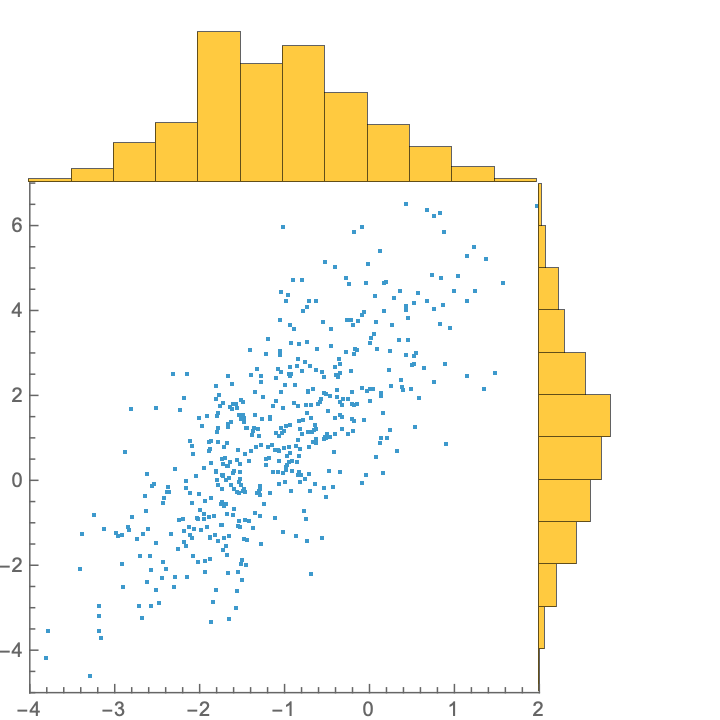 |
Display the marginal distributions using DistributionChart:
| In[2]:= |
| Out[2]= | 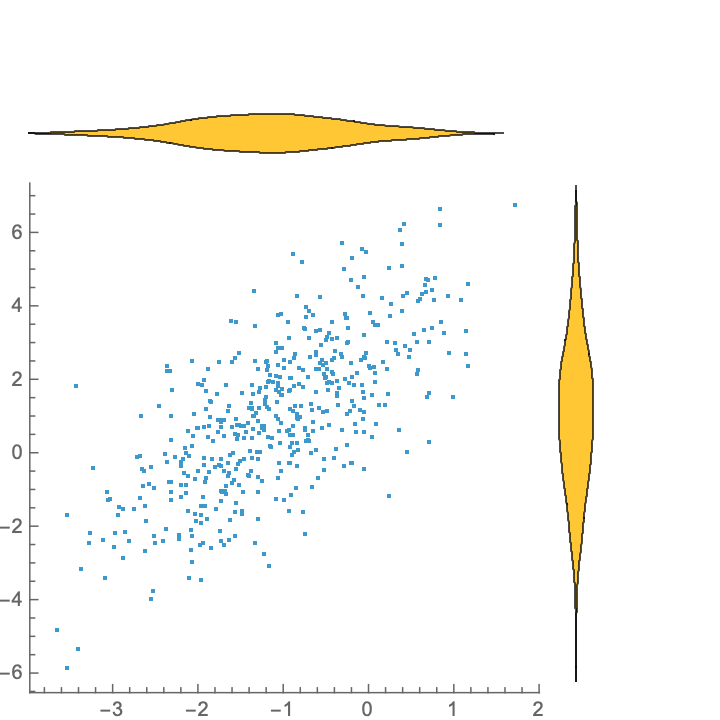 |
Display the marginal distributions using BoxWhiskerChart:
| In[3]:= |
| Out[3]= | 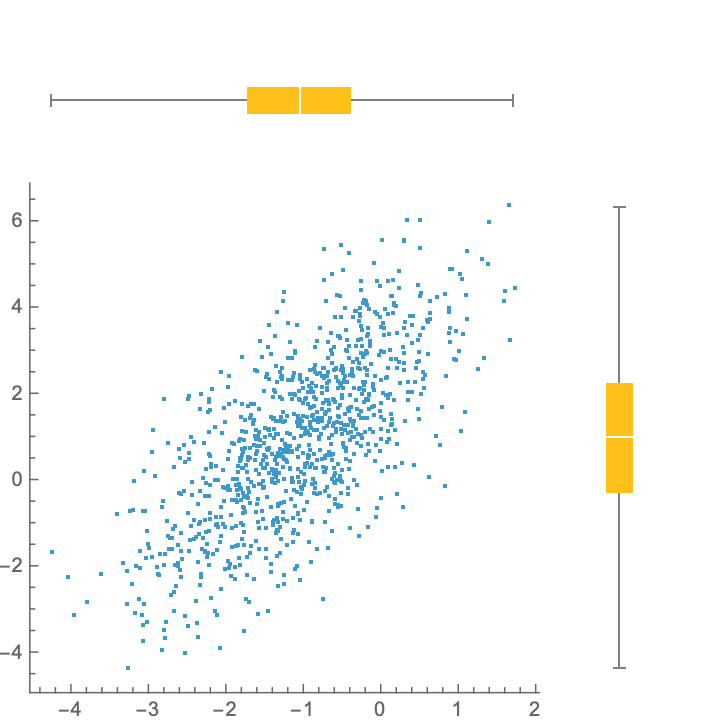 |
Specify the number of bins for Histogram marginal plots:
| In[4]:= |
| Out[5]= | 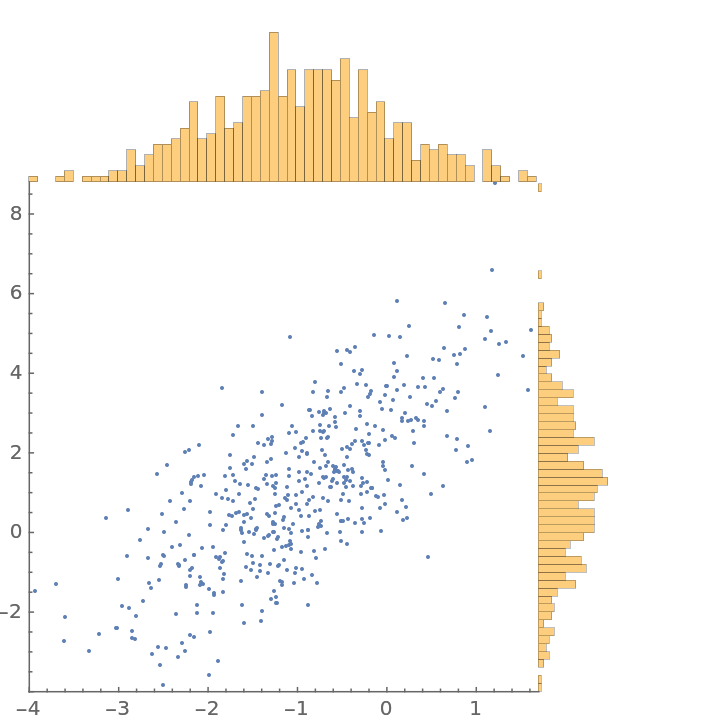 |
Specify the bin widths:
| In[6]:= |
| Out[6]= | 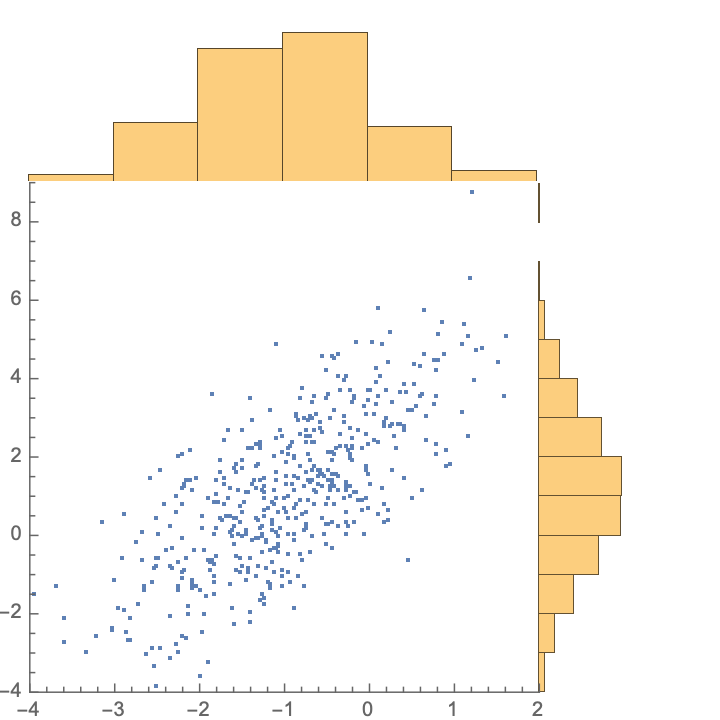 |
Mix different types of visualization for the different marginal distributions:
| In[7]:= |
| Out[8]= | 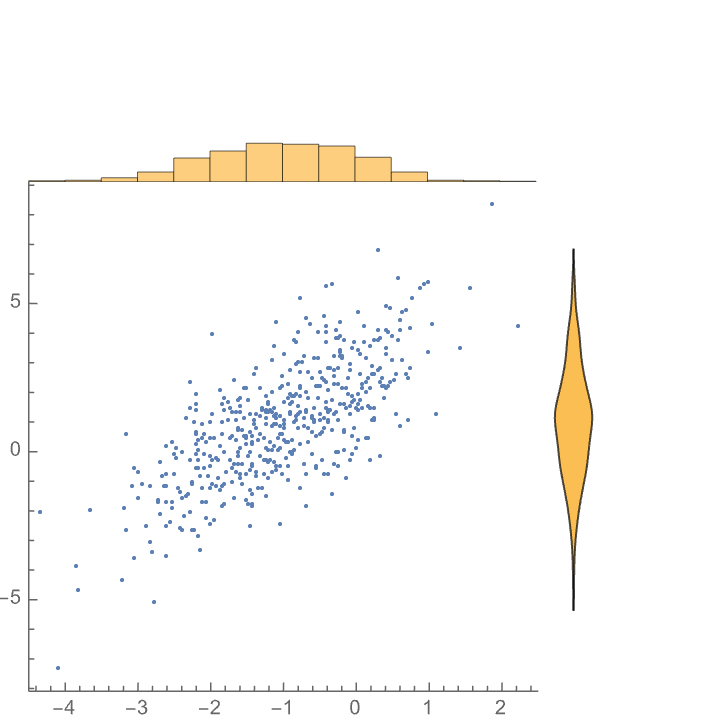 |
| In[9]:= |
| Out[10]= | 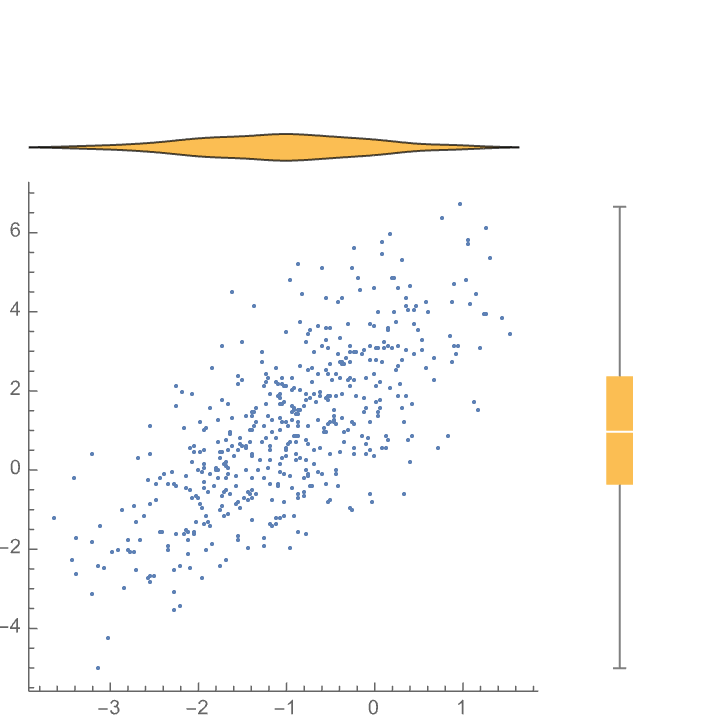 |
The type of chart used to display the marginal distribution is controlled with "MarginalChartType". Choices available are Histogram, DistributionChart and BoxWhiskerChart:
| In[11]:= |
| Out[11]= | 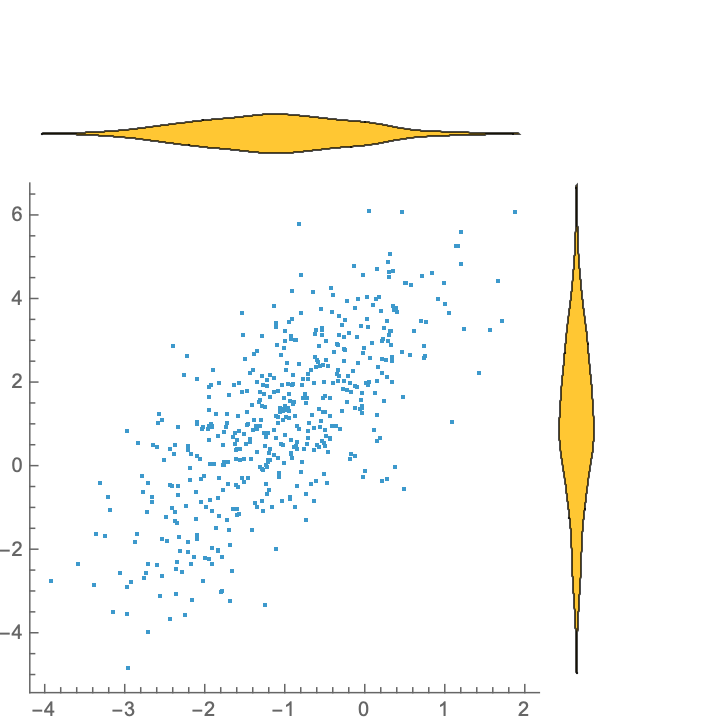 |
A list of two different values can be given for "MarginalChartType":
| In[12]:= |
| Out[12]= | 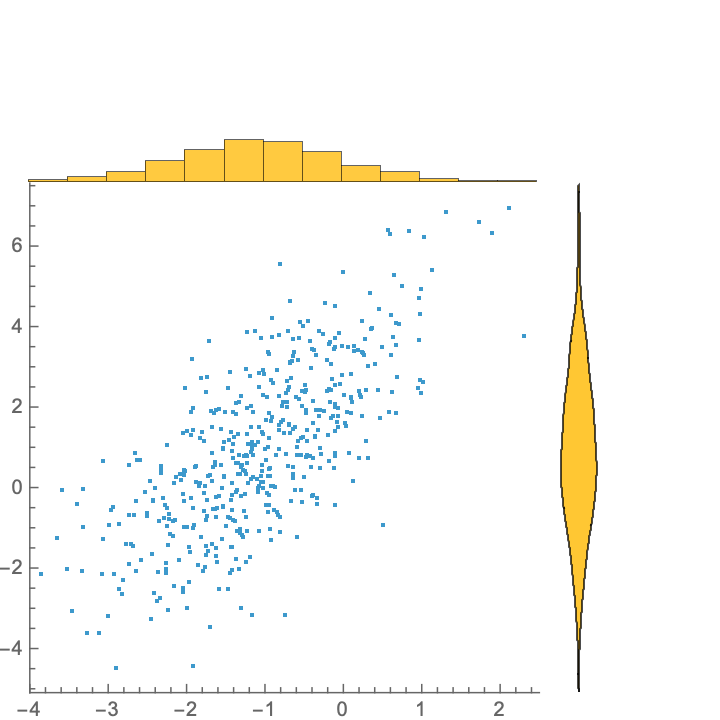 |
The proportion of the plot space occupied by the Histogram elements is controlled by "MarginalChartScale":
| In[13]:= |
| Out[14]= | 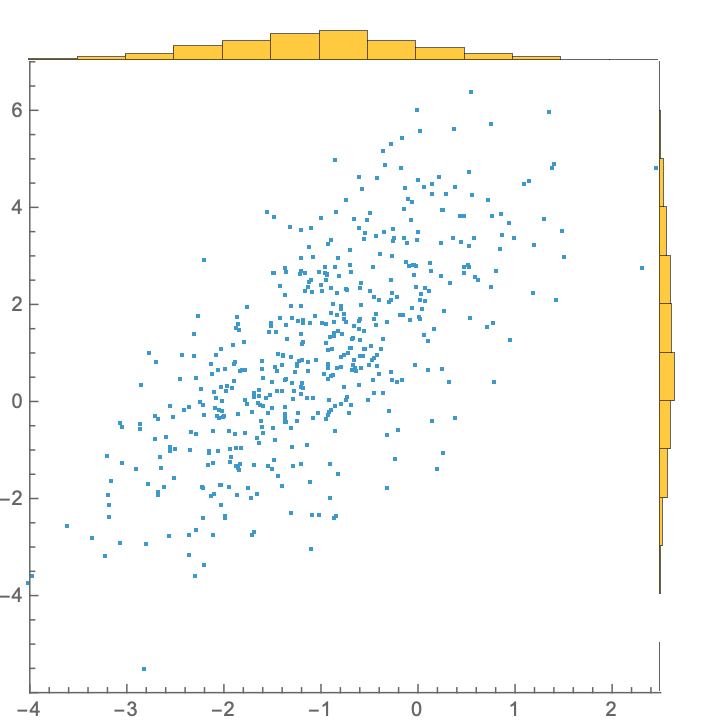 |
Create larger histograms:
| In[15]:= |
| Out[15]= | 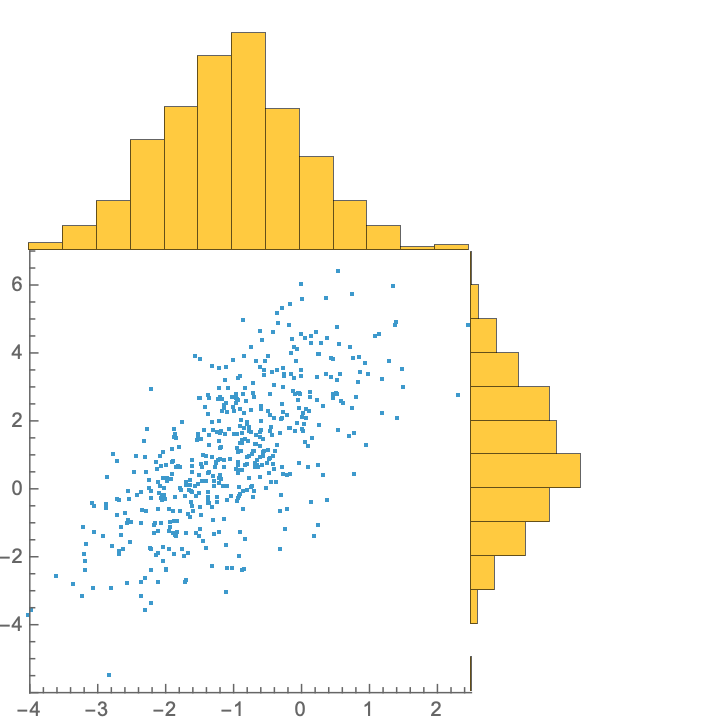 |
Standard Graphics options are supported:
| In[16]:= |
| Out[17]= | 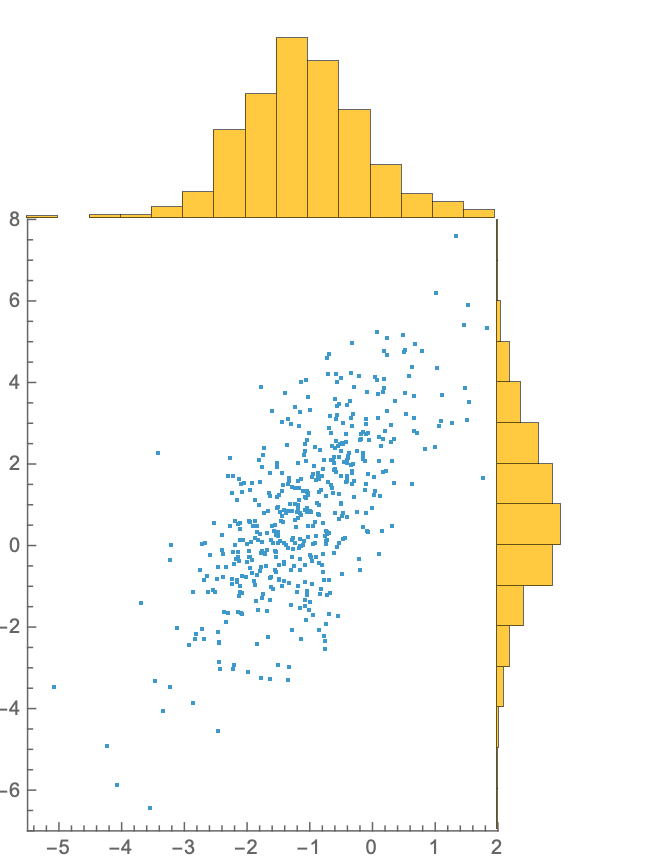 |
All standard options for the visualizations used for the marginal distributions are supported and must be passed in using the option "MarginalChartOptions":
| In[18]:= |
| Out[18]= | 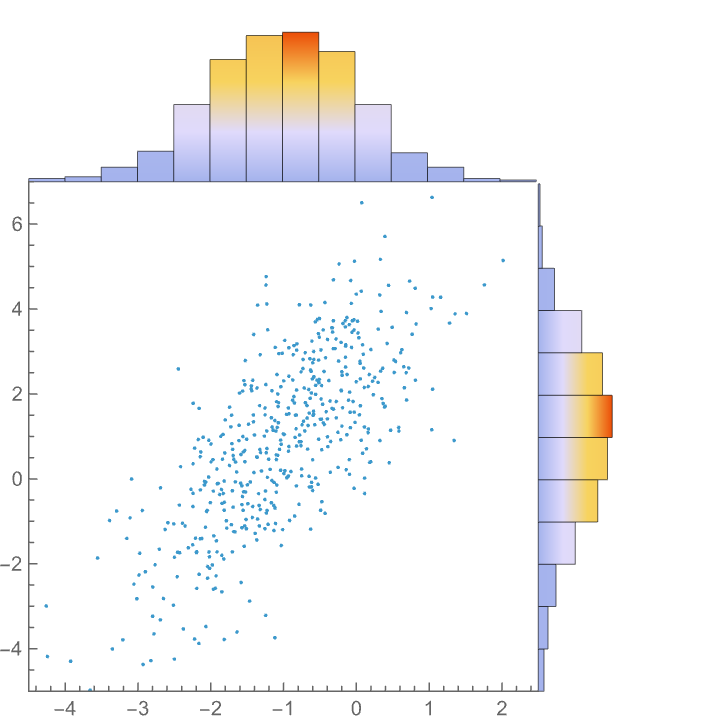 |
Likewise, options for DistributionChart and BoxWhiskerChart are supported:
| In[19]:= | ![ResourceFunction[
"MarginalPlot", ResourceSystemBase -> "https://www.wolframcloud.com/obj/resourcesystem/api/1.0"][
RandomVariate[BinormalDistribution[{-1, 1}, {1, 2}, 0.7], 500],
"MarginalChartType" -> DistributionChart, "MarginalChartOptions" -> {ChartElementFunction -> "HistogramDensity"}]](https://www.wolframcloud.com/obj/resourcesystem/images/1fe/1febd1de-c944-4818-a849-dd9f9cbf4013/6b64805a9a3eb7fd.png) |
| Out[19]= | 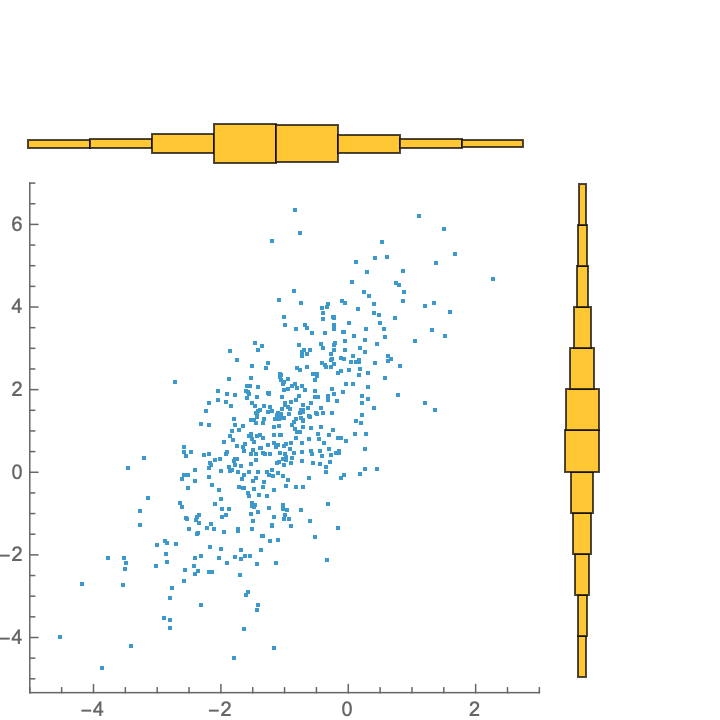 |
| In[20]:= | ![ResourceFunction[
"MarginalPlot", ResourceSystemBase -> "https://www.wolframcloud.com/obj/resourcesystem/api/1.0"][
RandomVariate[BinormalDistribution[{-1, 1}, {1, 2}, 0.7], 500],
"MarginalChartType" -> DistributionChart, "MarginalChartOptions" -> {ChartElementFunction -> "PointDensity"}]](https://www.wolframcloud.com/obj/resourcesystem/images/1fe/1febd1de-c944-4818-a849-dd9f9cbf4013/6a59bf6f9641cebb.png) |
| Out[20]= | 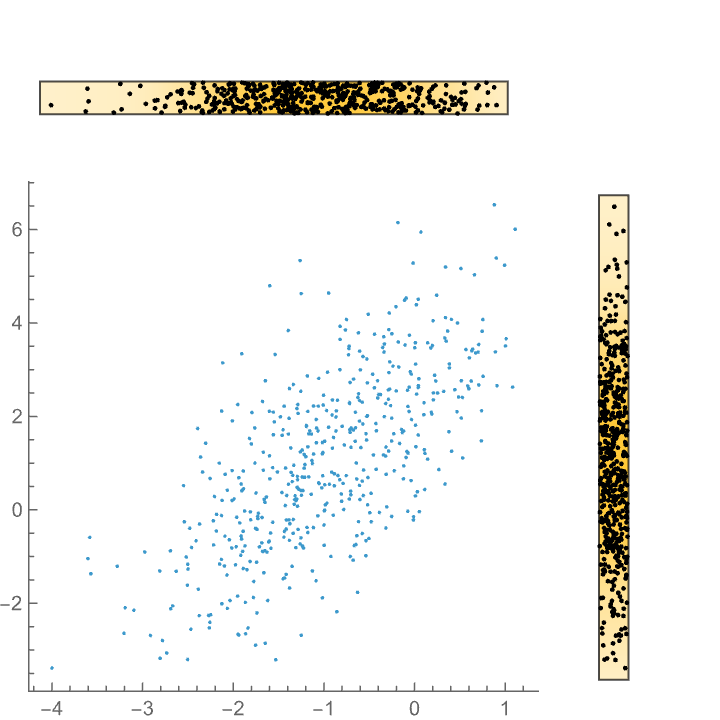 |
"MarginChartType" can accept a Function, but it is your responsibility to ensure that the Function returns an appropriate Graphics object. "MarginalChartOptions" are ignored:
| In[21]:= | ![data = RandomVariate[BinormalDistribution[{-1, 1}, {1, 2}, 0.7], 500];
ResourceFunction[
"MarginalPlot", ResourceSystemBase -> "https://www.wolframcloud.com/obj/resourcesystem/api/1.0"][data, "MarginalChartType" -> {Histogram, Function[Histogram[#, {0.2}, "PDF", BarOrigin -> Left]]}]](https://www.wolframcloud.com/obj/resourcesystem/images/1fe/1febd1de-c944-4818-a849-dd9f9cbf4013/449445c3d9f90ce9.png) |
| Out[22]= | 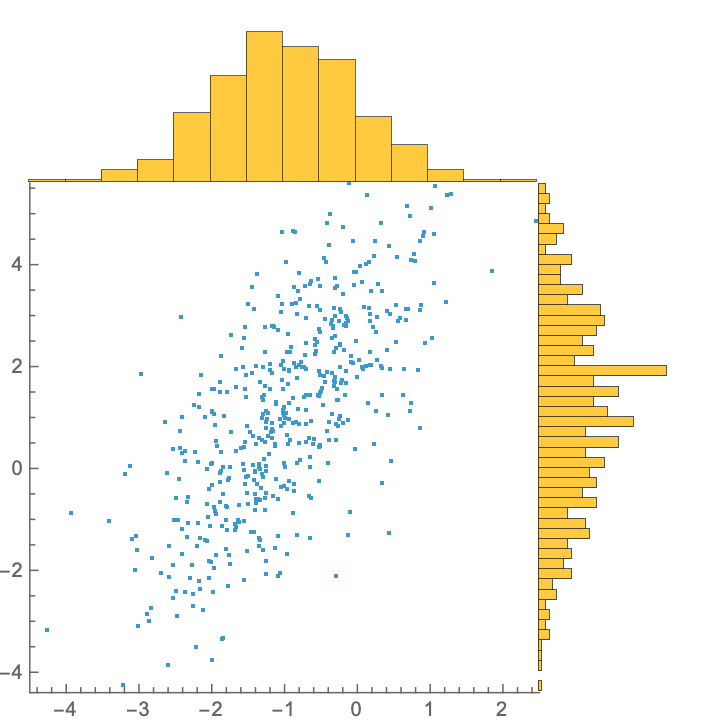 |
Wolfram Language 13.0 (December 2021) or above
This work is licensed under a Creative Commons Attribution 4.0 International License