Wolfram Function Repository
Instant-use add-on functions for the Wolfram Language
Function Repository Resource:
Produce a dynamic interface for a curve being traced out by the tip of a vector
ResourceFunction["ManipulateParametricPlot"][{fx,fy},{t,tmin,tmax}] produces an animation of the parametric curve (fx,fy) being traced out when t runs from tmin to tmax. |
Create a dynamic plot of a vector tracing out a parametric curve:
| In[1]:= |
| Out[1]= | 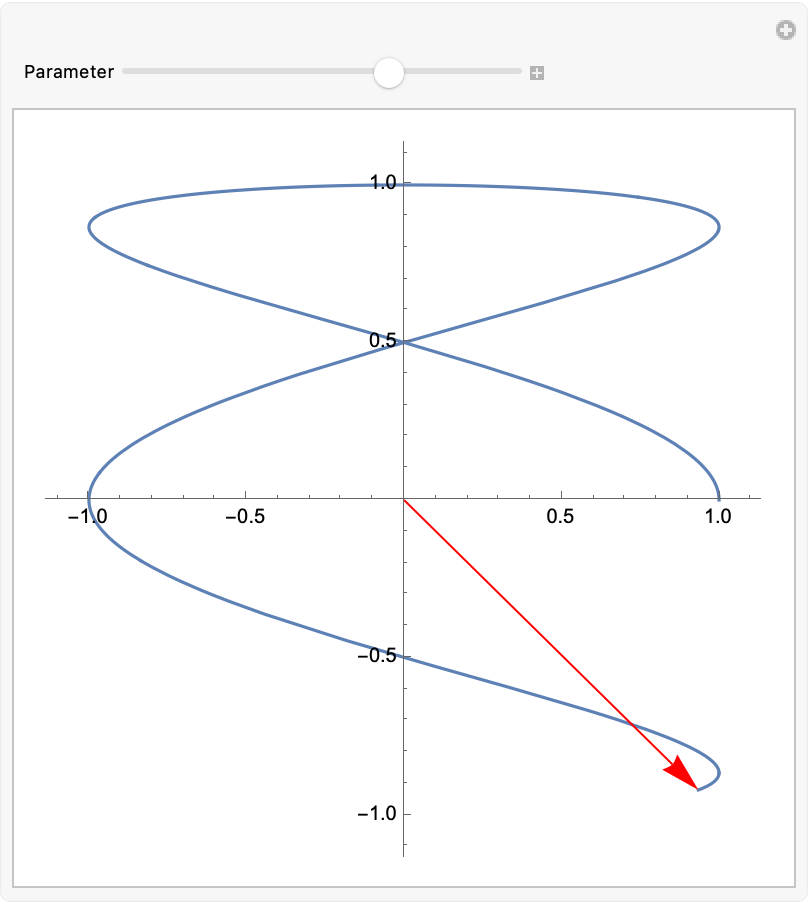 |
View the motion of an object moving in the plane along a curve:
| In[2]:= | ![ResourceFunction[
"ManipulateParametricPlot"][{Cos[3 t], Sin[t]}, {t, 0, 2 \[Pi]}, "DrawVector" -> False, SaveDefinitions -> True]](https://www.wolframcloud.com/obj/resourcesystem/images/658/65806315-1369-436a-baf4-b69fb7b30133/72b5eb8313144286.png) |
| Out[2]= | 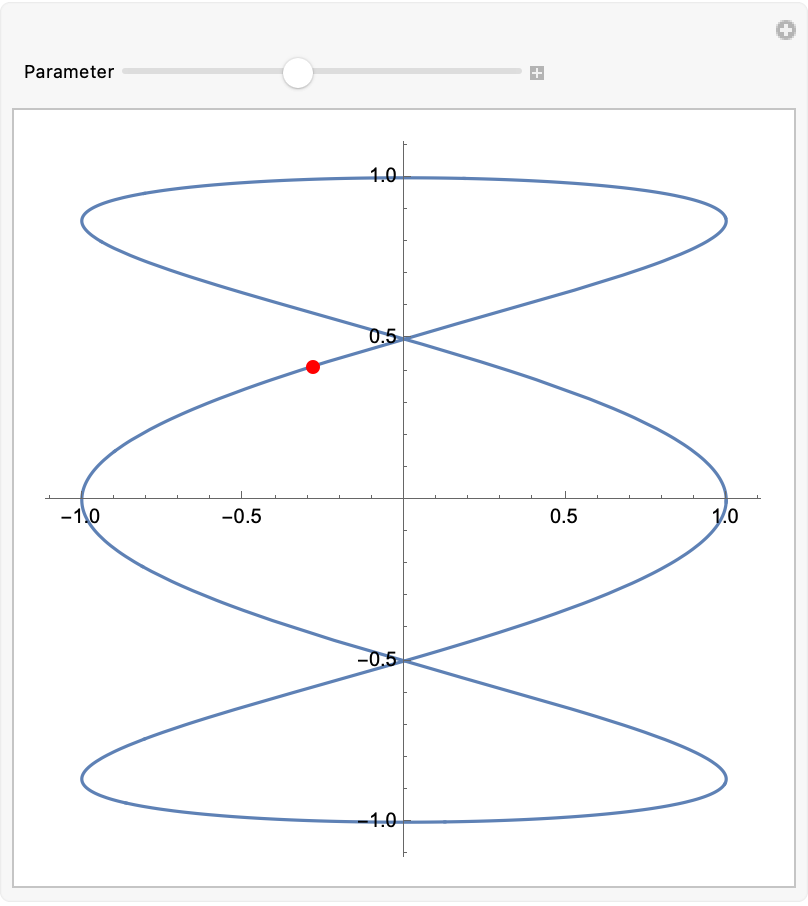 |
View the motion of two particles moving in the plane colliding at several points:
| In[3]:= | ![ResourceFunction[
"ManipulateParametricPlot"][{{Cos[t], Sin[t]}, {Cos[3 t], Sin[t]}}, {t, 0, 2 \[Pi], .01}, "DrawVector" -> False, PlotStyle -> {Black, Purple}, "PointStyle" -> {Black, Purple}, ImageSize -> Small, SaveDefinitions -> True]](https://www.wolframcloud.com/obj/resourcesystem/images/658/65806315-1369-436a-baf4-b69fb7b30133/73717982fc73efef.png) |
| Out[3]= | 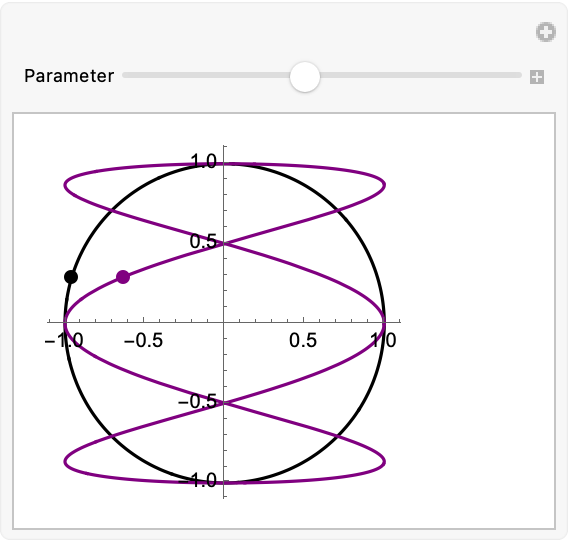 |
This work is licensed under a Creative Commons Attribution 4.0 International License