Wolfram Function Repository
Instant-use add-on functions for the Wolfram Language
Function Repository Resource:
Create customizable maps of the London Underground train routes
ResourceFunction["LondonUndergroundMap"][] display a map of the London Underground system. | |
ResourceFunction["LondonUndergroundMap"][{line1,line2,…}] display a map of the named lines of the London Underground system. |
| "LineStyle" | Automatic | styles to display the underground lines |
| "ShowStations" | False | display locations of stations |
| "StationScale" | Automatic | the size of station markers |
| "StationMarker" | the symbol used to display stations |
Show the full map of the London Underground:
| In[1]:= |
| Out[1]= | 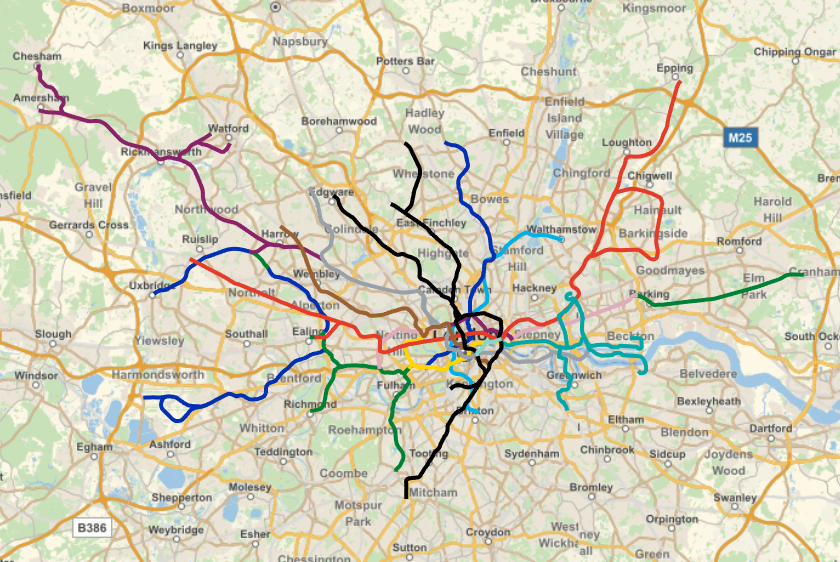 |
Show only the central London area:
| In[2]:= |
| Out[2]= | 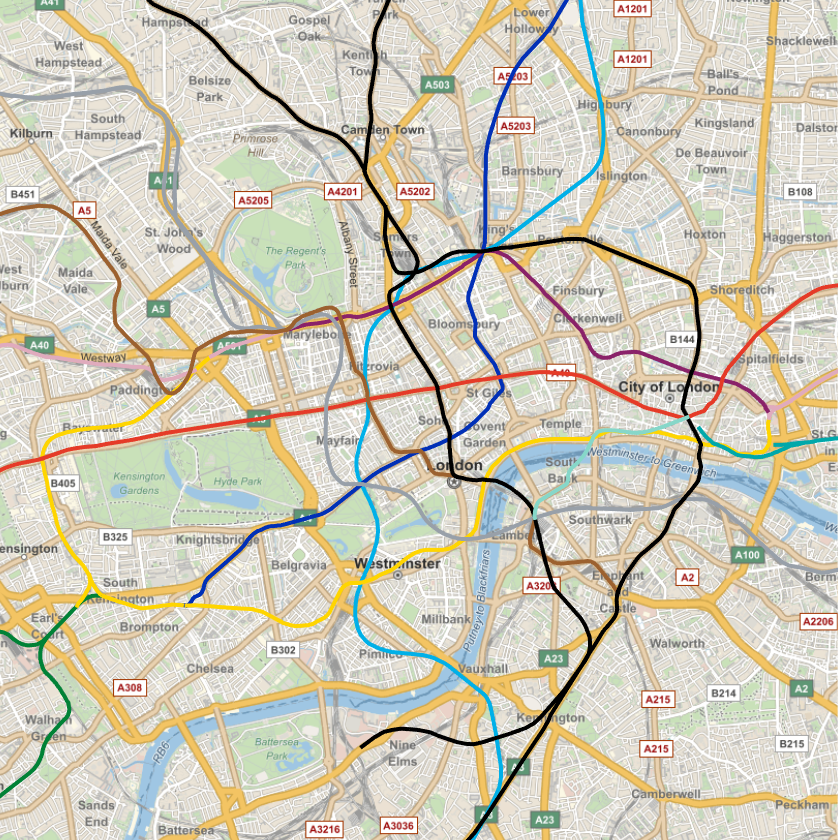 |
You can display only specific lines. Choose from "Victoria", "Piccadilly", "District", "Circle", "Hammersmith & City", "Metropolitan", "Central", "Jubilee", "DLR", "Bakerloo", "Northern" and "Waterloo & City":
| In[3]:= |
| Out[3]= | 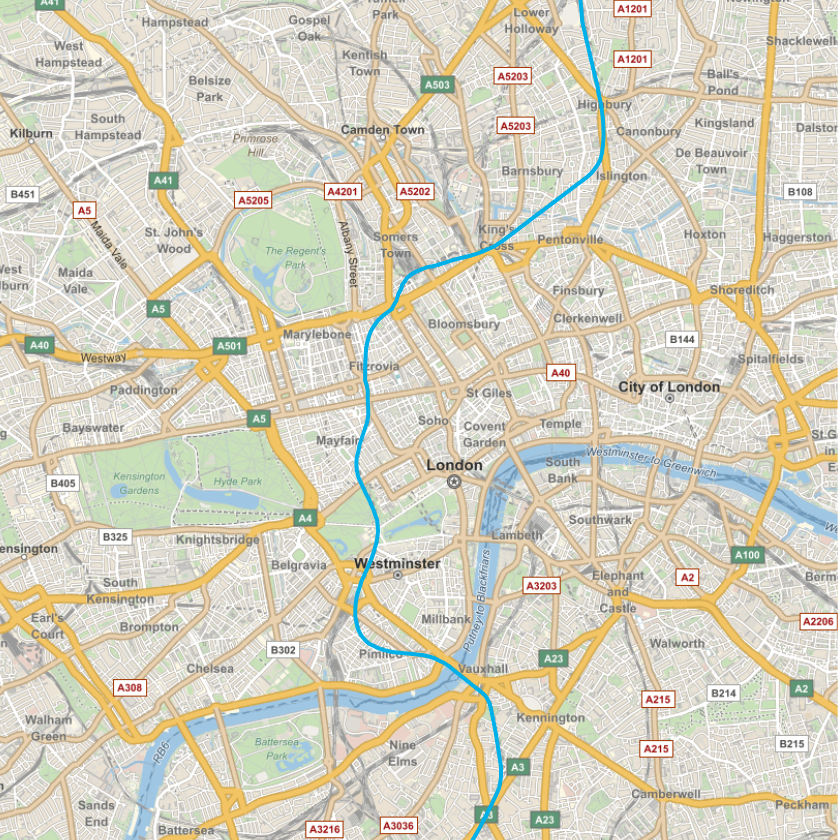 |
All options for GeoGraphics are supported:
| In[4]:= | ![ResourceFunction["LondonUndergroundMap"]["Piccadilly", GeoCenter -> Entity["Airport", "EGLL"], GeoRange -> Quantity[1, "Miles"], GeoBackground -> "VectorClassic"]](https://www.wolframcloud.com/obj/resourcesystem/images/8f5/8f5512ef-f0b5-442e-9e23-5ebf62b1900c/4438175b0a5077a5.png) |
| Out[4]= | 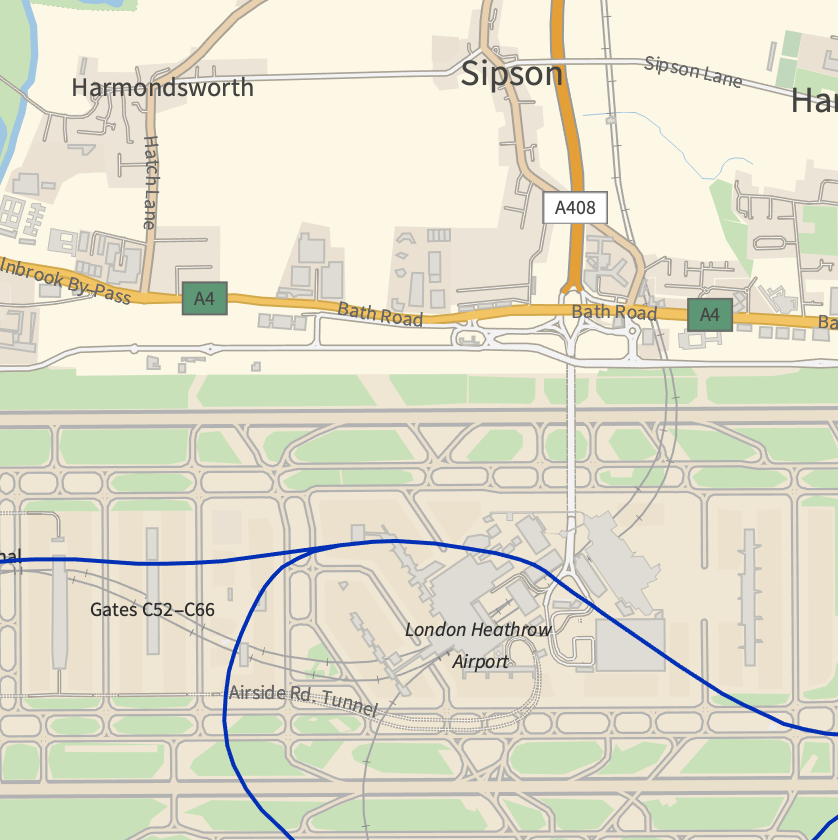 |
| In[5]:= | ![ResourceFunction["LondonUndergroundMap"]["Piccadilly", GeoCenter -> Entity["Airport", "EGLL"], GeoRange -> Quantity[0.7, "Miles"], GeoBackground -> "Satellite"]](https://www.wolframcloud.com/obj/resourcesystem/images/8f5/8f5512ef-f0b5-442e-9e23-5ebf62b1900c/3eb6a83b93ad98bd.png) |
| Out[5]= | 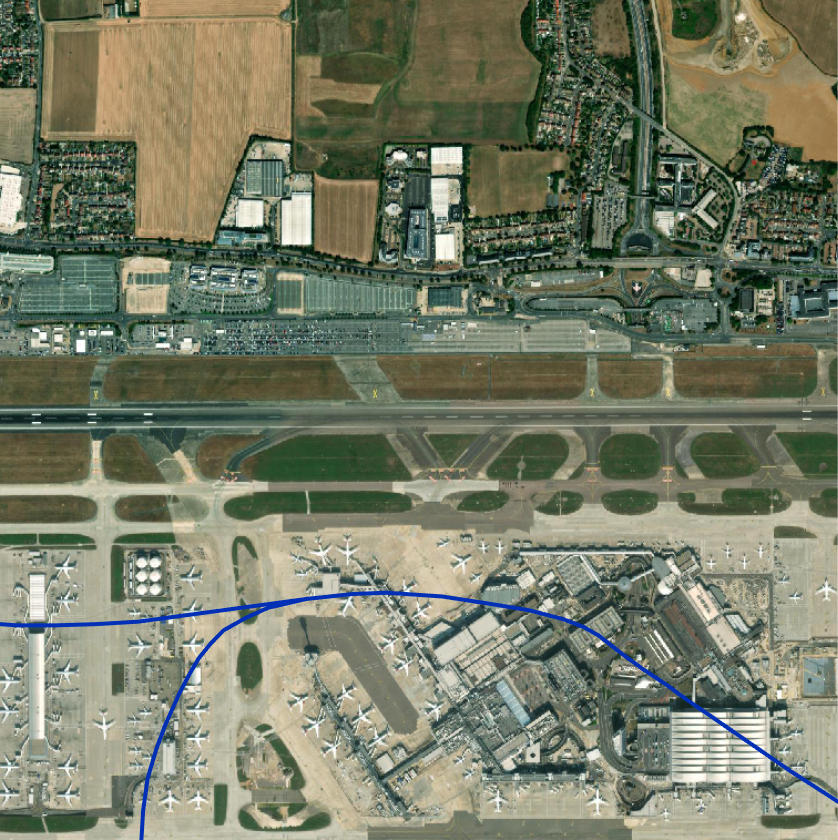 |
By default, lines are styled with their traditional colors but can be styled collectively:
| In[6]:= |
| Out[6]= | 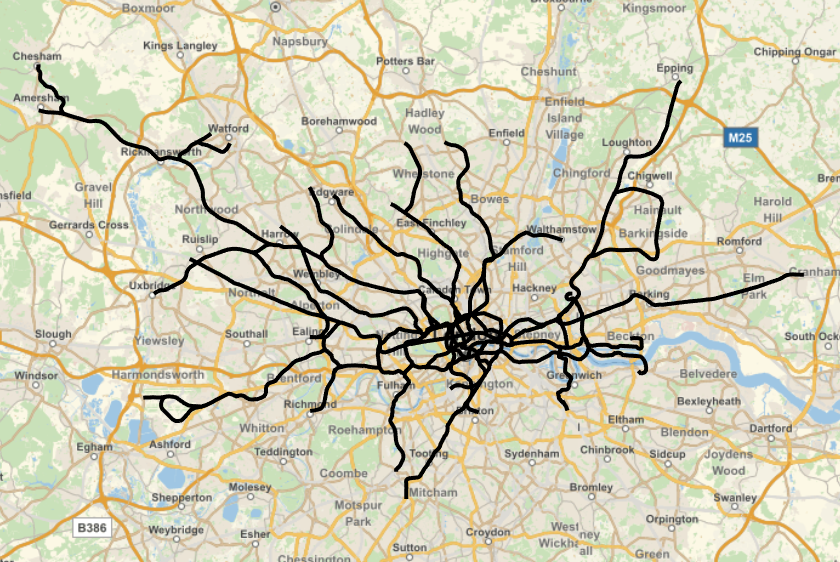 |
And they can be styled individually:
| In[7]:= |
| Out[7]= | 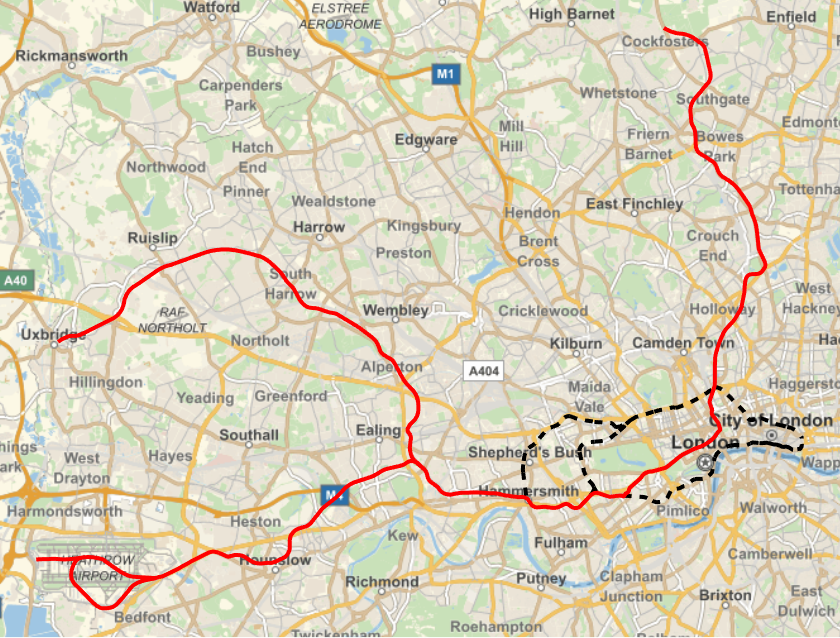 |
You can display the locations of stations on most lines:
| In[8]:= |
| Out[8]= | 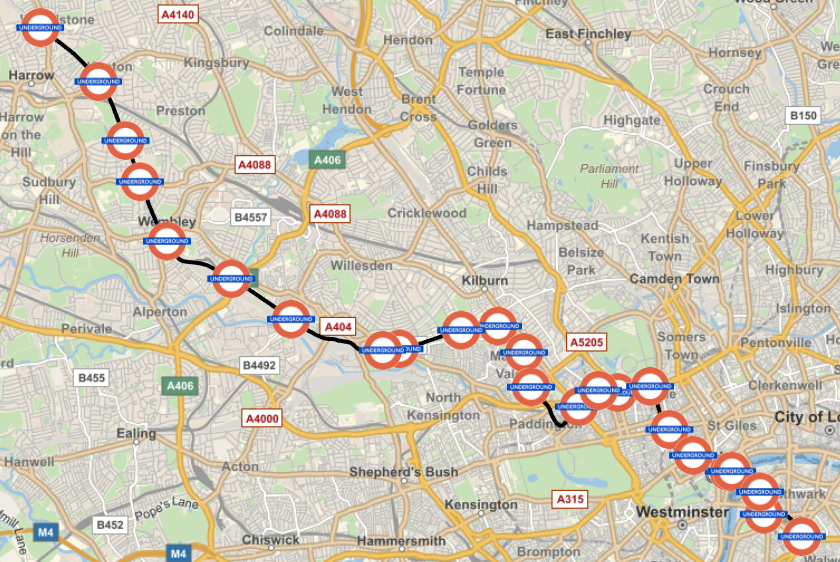 |
With default markers:
| In[9]:= |
| Out[9]= | 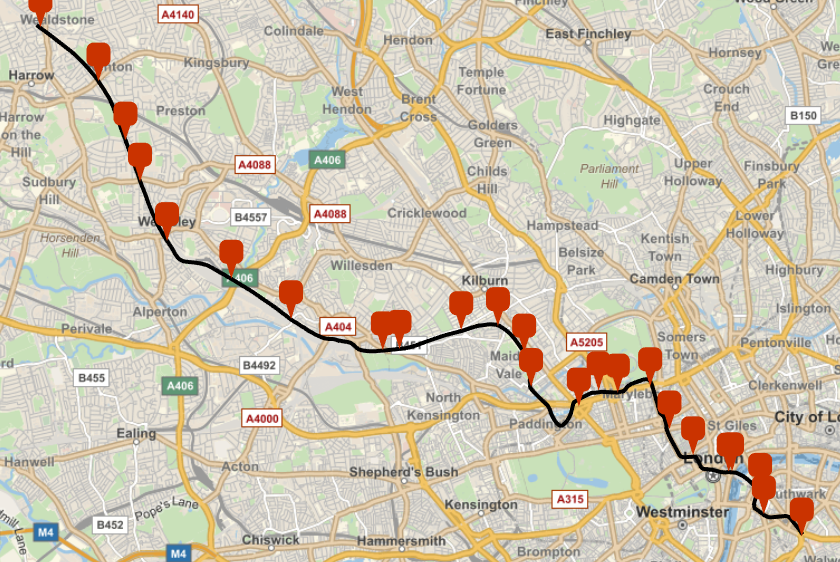 |
Create a map of each line:
| In[10]:= | ![Multicolumn[
Labeled[ResourceFunction["LondonUndergroundMap"][#, "LineStyle" -> Black], #] & /@ {"Victoria", "Piccadilly", "District", "Circle", "Hammersmith & City", "Metropolitan", "Central", "Jubilee", "DLR", "Bakerloo", "Northern", "Waterloo & City"}, 4]](https://www.wolframcloud.com/obj/resourcesystem/images/8f5/8f5512ef-f0b5-442e-9e23-5ebf62b1900c/4292c4aa3e62326f.png) |
| Out[10]= | 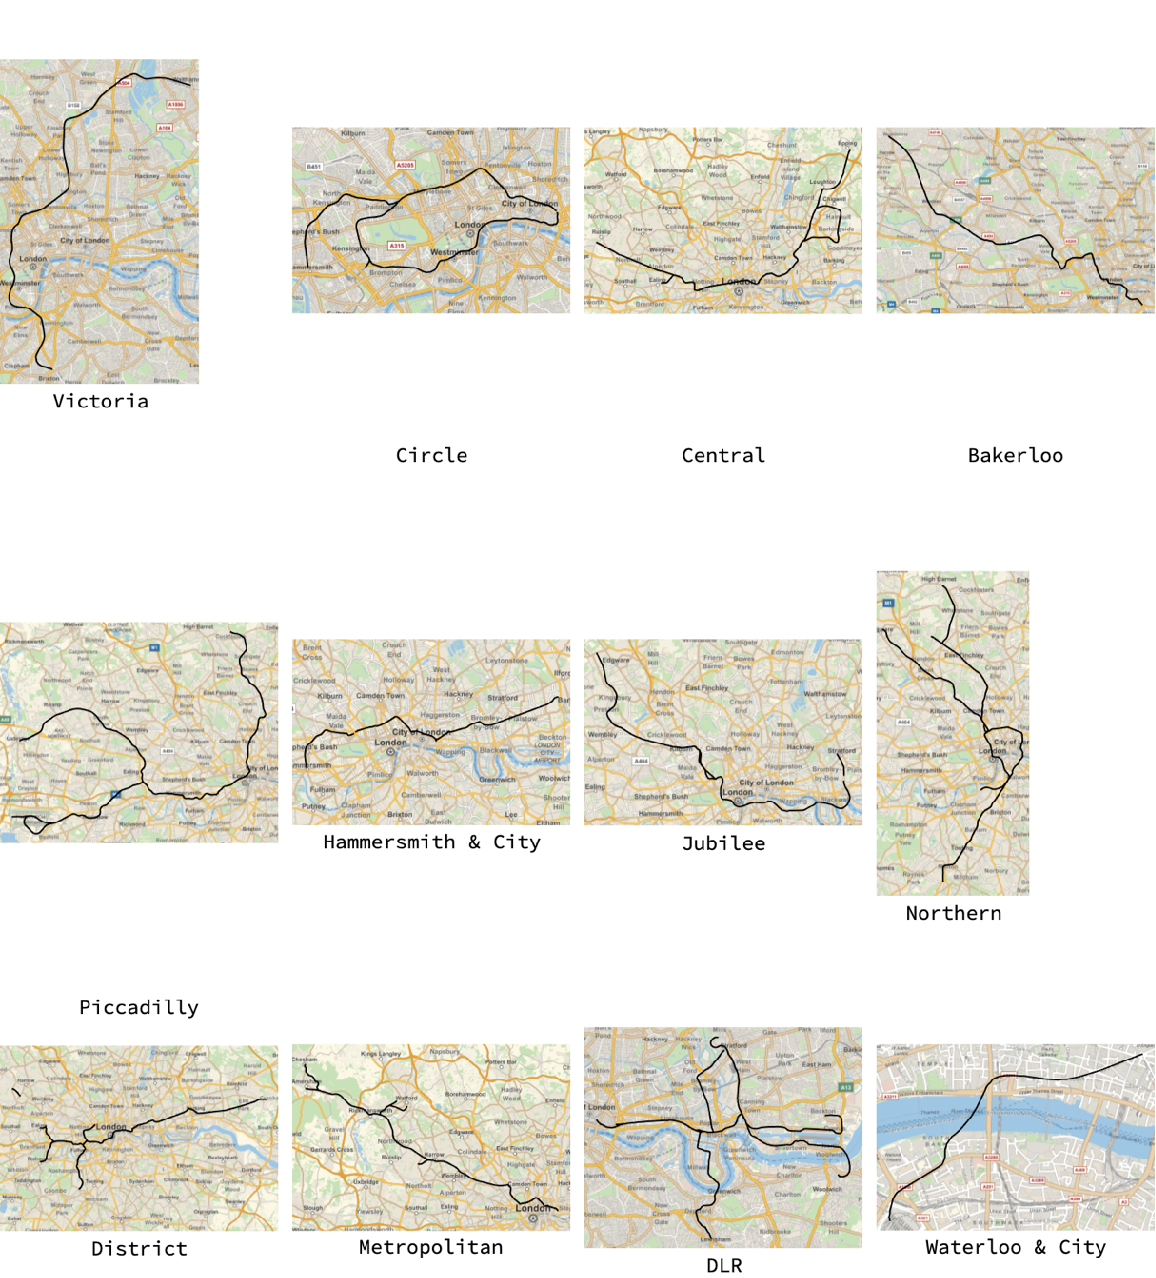 |
This work is licensed under a Creative Commons Attribution 4.0 International License