Wolfram Function Repository
Instant-use add-on functions for the Wolfram Language
Function Repository Resource:
Visualize a lifetime in weeks or months
ResourceFunction["LifetimeChart"][] charts a human lifetime as a grid of weeks. | |
ResourceFunction["LifetimeChart"][age] charts a human lifetime grid for a human of a given age. |
| Appearance | "Vertical" | may be either "Horizontal" or "Vertical" |
| "FutureStyle" | Automatic | styling Directive for grid items in future |
| "Granularity" | "Week" | chart by "Week", "Month", or "Year" |
| "Grouped" | True | add spacing to show groups of 40⨯10 items |
| "PastStyle" | Automatic | styling Directive for grid items in past |
| "Shape" | "Square" | specifies the grid item to use ("Disk" or "Square") |
| Spacings | 1 | scale the spacings of charted items |
Chart a life in months (a row is 3-years):
| In[1]:= |
| Out[1]= | 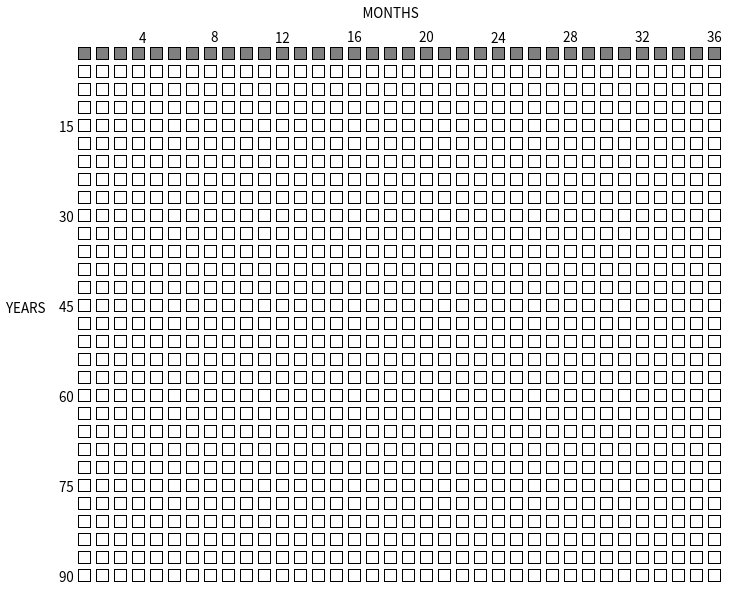 |
Set the option "Granularity"→"Month" to chart by months:
| In[2]:= |
| Out[2]= | 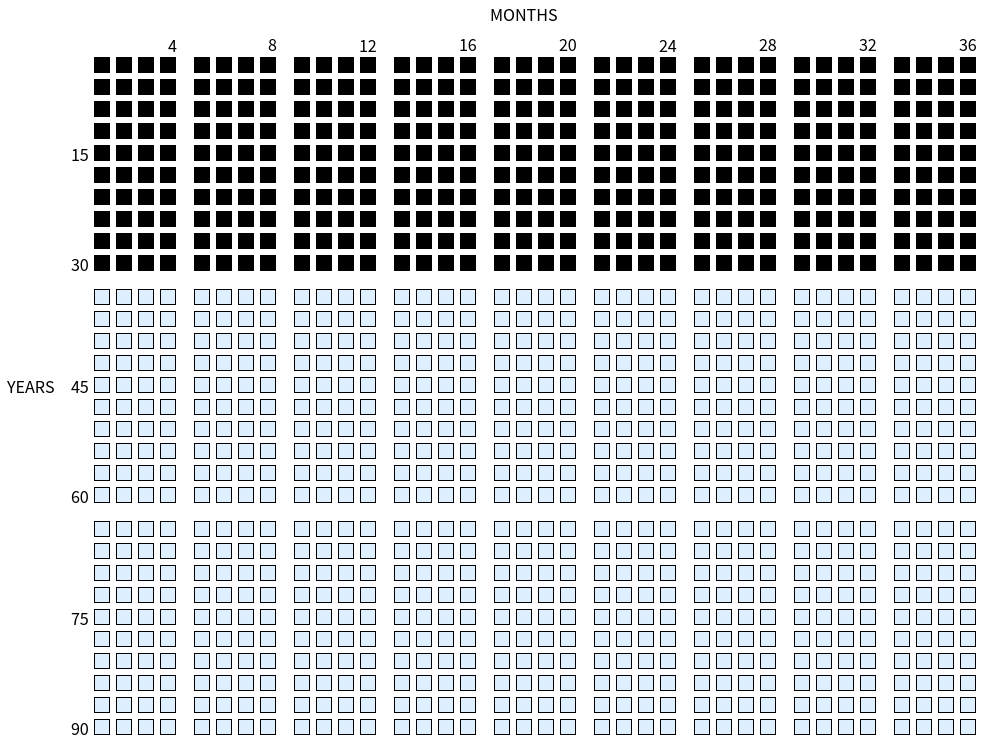 |
Set the option "Granularity"→"Year" to chart by years:
| In[3]:= |
| In[4]:= | ![Column@{Slider[Dynamic[a], {0, 90}, Appearance -> "Labeled"], Dynamic@ResourceFunction["LifetimeChart"][a, "Granularity" -> "Year", Magnification -> .6, AxesLabel -> None]}](https://www.wolframcloud.com/obj/resourcesystem/images/bc0/bc0304b0-50cb-4c9a-b36b-00507a643a85/1f689602390439d6.png) |
| Out[4]= |  |
Plot a life in weeks (a row is a year) with custom styling and layout:
| In[5]:= | ![lp = ResourceFunction["LifetimeChart"][Quantity[15*52, "Weeks"], Magnification -> .2,
"PastStyle" -> Directive[EdgeForm[None], FaceForm[Hue[.6, 1, 1, .6]]],
"FutureStyle" -> Directive[EdgeForm@Hue[.6, 1, 1, .8], FaceForm@None],
"Shape" -> "Disk", "Grouped" -> True, Spacings -> .5, AxesLabel -> {Style["\[LongLeftArrow] Weeks \[LongRightArrow]", 40, Bold], Style[Rotate["Years" , 90 \[Degree]], 40, Bold]}, BaseStyle -> Directive[FontFamily -> 60]]](https://www.wolframcloud.com/obj/resourcesystem/images/bc0/bc0304b0-50cb-4c9a-b36b-00507a643a85/280f56b5a1625bc8.png) |
| Out[5]= | 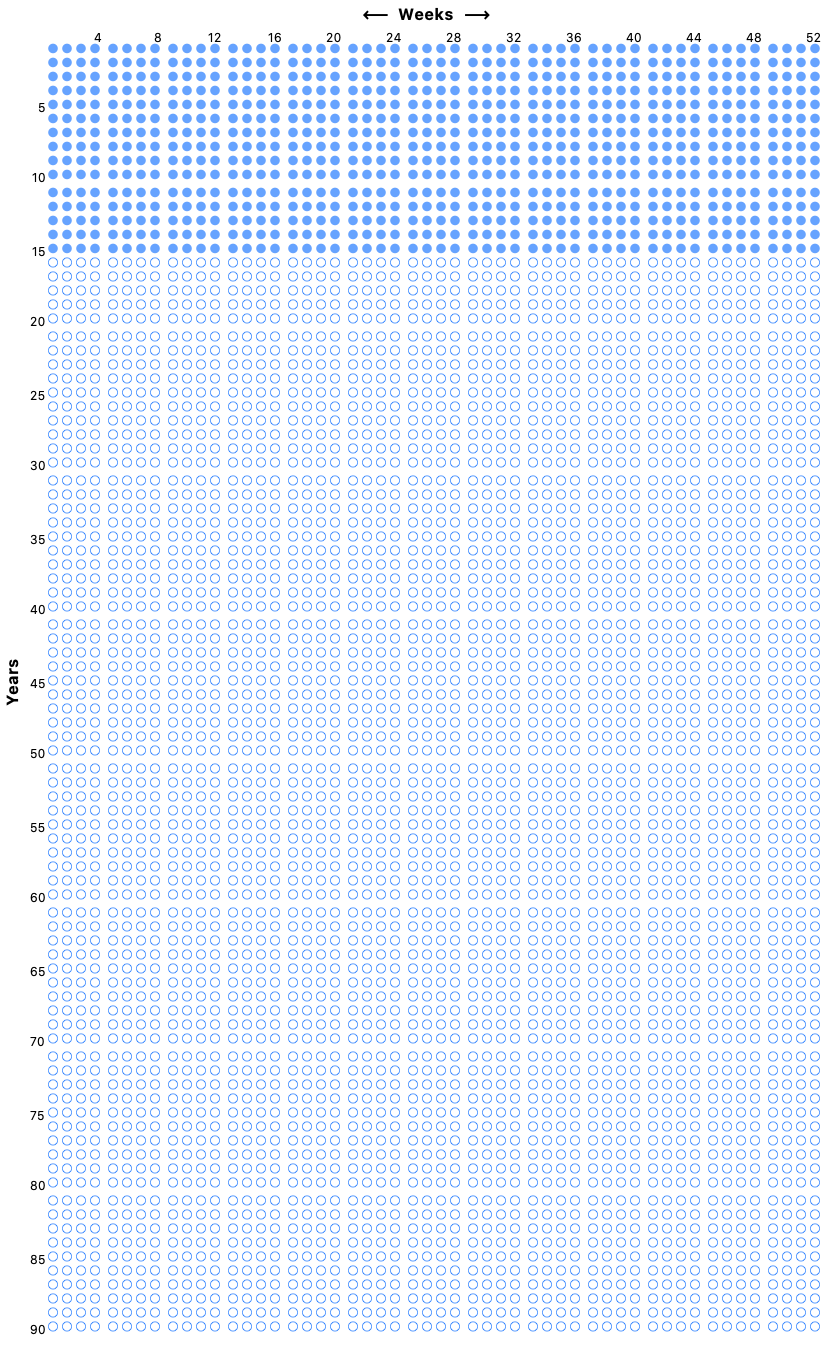 |
Use an inverted color scheme and horizontal layout:
| In[6]:= | ![lp = ResourceFunction["LifetimeChart"][Quantity[35.5, "Years"], Magnification -> .2, "Shape" -> "Disk", "PastStyle" -> Directive[FaceForm@Orange, EdgeForm@{Black, Thin}], "FutureStyle" -> Directive[FaceForm@Cyan, EdgeForm@{Gray, Thickness@Medium}], Appearance -> "Horizaontal", Background -> Black, "Grouped" -> True,
LabelStyle -> Directive[FontFamily -> "Verdana", FontSize -> 50, FontColor -> White]]](https://www.wolframcloud.com/obj/resourcesystem/images/bc0/bc0304b0-50cb-4c9a-b36b-00507a643a85/40d9eef08665abef.png) |
| Out[6]= | 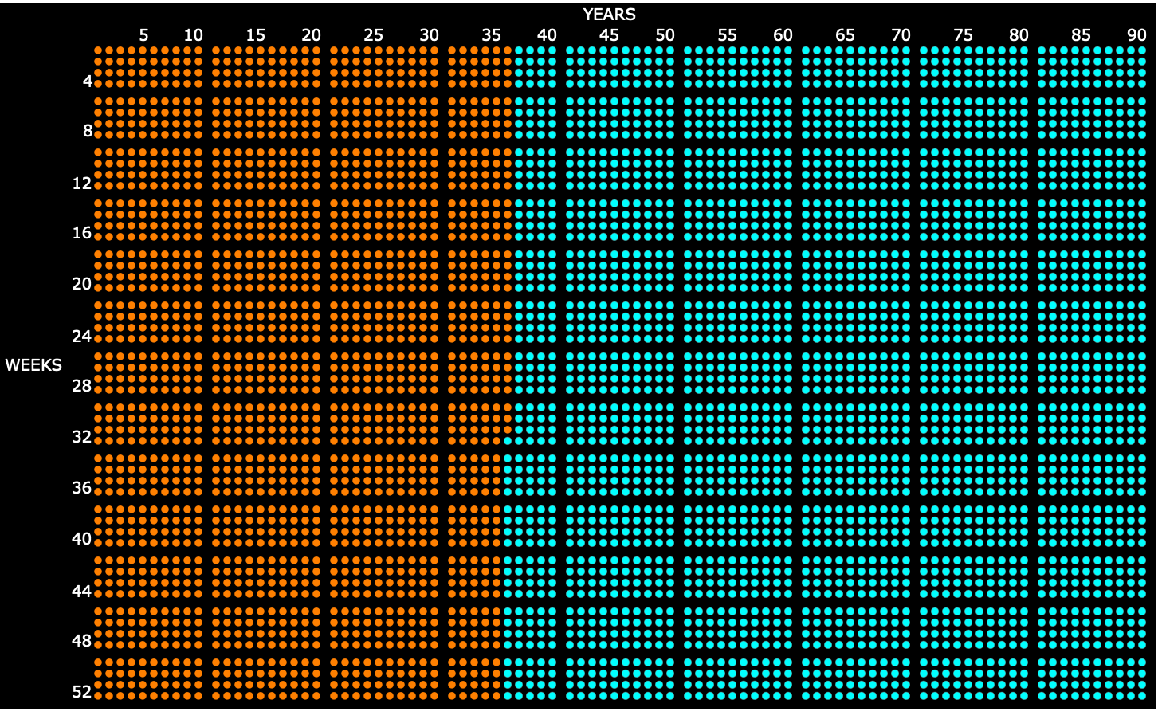 |
Setting the Magnification option will decrease resolution of an exported "PDF":
| In[7]:= | ![Export[file = CreateFile["lifetime-chart.pdf"],
ResourceFunction["LifetimeChart"][Quantity[45, "Years"], Magnification -> .1]];](https://www.wolframcloud.com/obj/resourcesystem/images/bc0/bc0304b0-50cb-4c9a-b36b-00507a643a85/4959e52593b47d7c.png) |
| In[8]:= |
| Out[8]= | 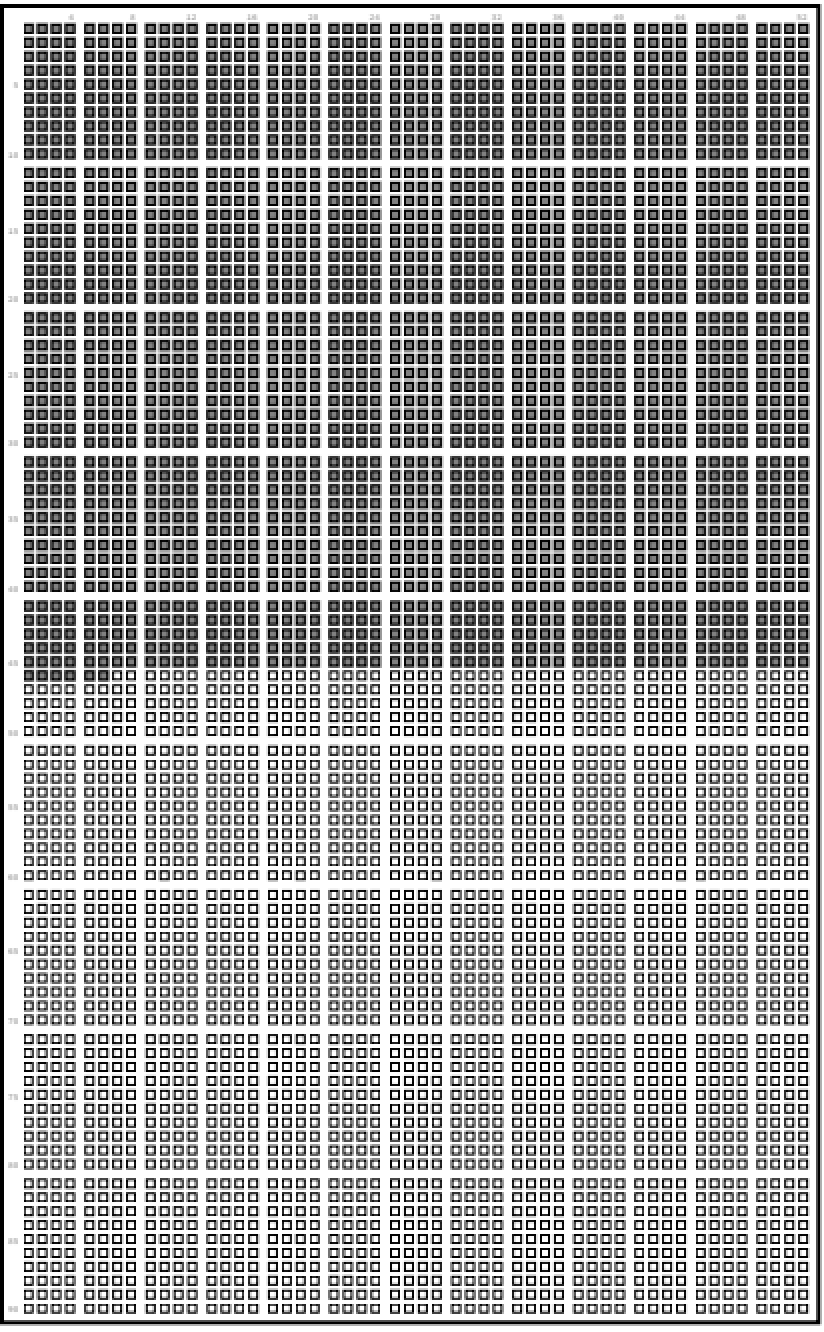 |
Charting in "Years" may result in seemingly extra weeks (one year is 365/7 weeks):
| In[9]:= | ![Row@{ResourceFunction["LifetimeChart"][Quantity[21*52, "Weeks"], "Shape" -> "Disk", Magnification -> .1], ResourceFunction["LifetimeChart"][Quantity[21.0, "Years"], "Shape" -> "Disk", Magnification -> .1]}](https://www.wolframcloud.com/obj/resourcesystem/images/bc0/bc0304b0-50cb-4c9a-b36b-00507a643a85/7232f9a4edc1e445.png) |
| Out[9]= | 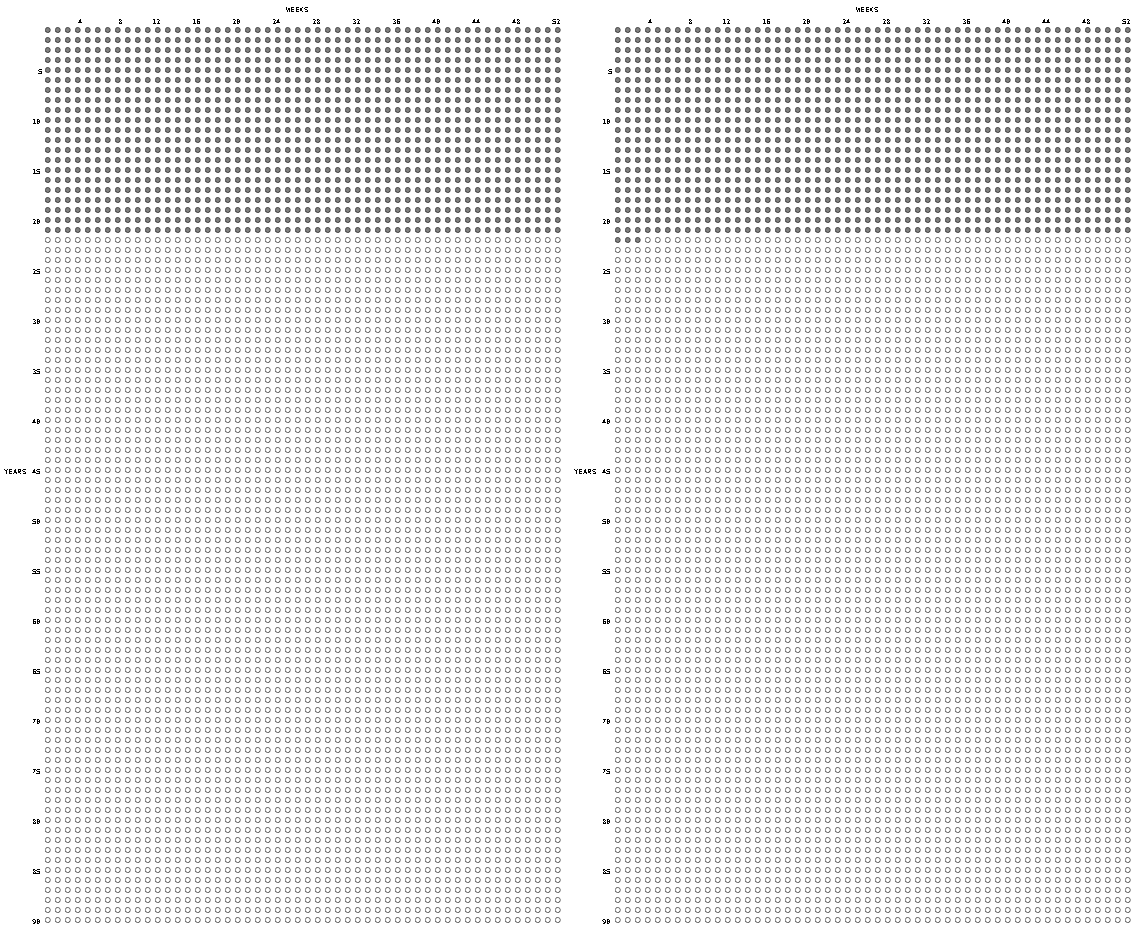 |
This work is licensed under a Creative Commons Attribution 4.0 International License