Wolfram Function Repository
Instant-use add-on functions for the Wolfram Language
Function Repository Resource:
Generate the Lévy C curve
ResourceFunction["LevyCCurve"][n] generates the line segments of the Lévy C curve with n iterations. | |
ResourceFunction["LevyCCurve"][{p1,p2},n] uses the line connecting the points p1 and p2 as the initial line. | |
ResourceFunction["LevyCCurve"][{p1,p2,… ,pn},n] uses the lines joining the points pi. |

Generate the Lévy C curve for four iterations:
| In[1]:= |
| Out[1]= |  |
Generate the line for eight iterations and visualize the result:
| In[2]:= |
| Out[2]= |  |
Start from a vertical line segment:
| In[3]:= |
| Out[3]= |  |
The length of the Lévy C curve grows approximately exponentially:
| In[4]:= |
| Out[4]= | 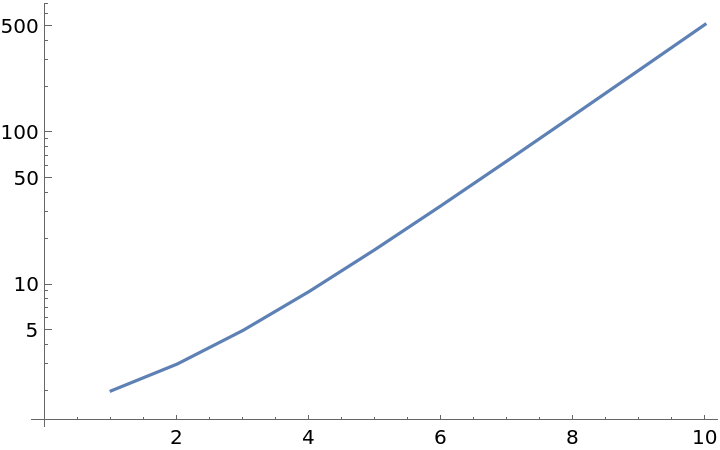 |
"Inward" and "outward" Lévy C curve starting from a square:
| In[5]:= | ![Graphics[{ResourceFunction["LevyCCurve"][
Line[{{0, 0}, {0, 1}, {1, 1}, {1, 0}, {0, 0}}], 10], ResourceFunction["LevyCCurve"][
Line[Reverse@{{3, 0}, {3, 1}, {4, 1}, {4, 0}, {3, 0}}], 10]}]](https://www.wolframcloud.com/obj/resourcesystem/images/d9f/d9f93ab3-af9c-49dd-8767-0e5876b1f751/46bbe0f99ce53de7.png) |
| Out[5]= |  |
Color the curve along its length:
| In[6]:= | ![pts = First@ResourceFunction["LevyCCurve"][10];
colors = Blend[{Red, Blue, Green, Orange}, #] & /@ Subdivide[Length[pts] - 1];
Graphics[Line[pts, VertexColors -> colors]]](https://www.wolframcloud.com/obj/resourcesystem/images/d9f/d9f93ab3-af9c-49dd-8767-0e5876b1f751/6e3fa99c31c8588c.png) |
| Out[6]= | 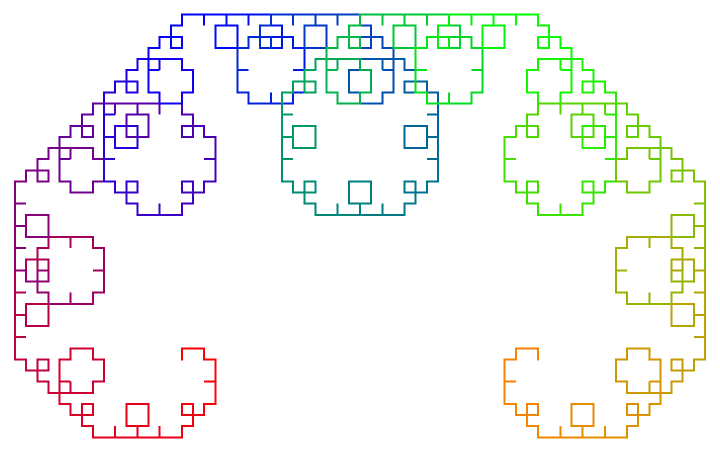 |
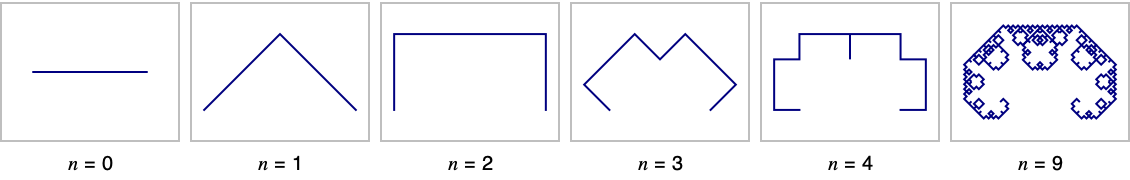
Code used for images in the Details and Option section:
| In[1]:= |
| In[2]:= | ![Table[{Framed[
Graphics[{RGBColor[0.`, 0.`, 0.5`], LevyCCurve[n]}, ImageSize -> {80, 60}], FrameStyle -> Directive[GrayLevel[0.75], Thickness[Tiny]]], Row[{Style["n", FontFamily -> "Times", FontSize -> 10, FontSlant -> Italic], Style[" = " <> ToString[n], FontFamily -> "Helvetica", FontSize -> 10]}]}, {n, {0, 1, 2, 3, 4, 9}}] // Transpose // Grid](https://www.wolframcloud.com/obj/resourcesystem/images/d9f/d9f93ab3-af9c-49dd-8767-0e5876b1f751/47e0839f341fc5ab.png) |
This work is licensed under a Creative Commons Attribution 4.0 International License