Wolfram Function Repository
Instant-use add-on functions for the Wolfram Language
Function Repository Resource:
Display specific unit cells in a 3D lattice
ResourceFunction["LatticeUnitCellPlot3D"][{vx,vy,vz},{nx,ny,nz}] plots cells of the lattice defined by the basis vectors vi with ni cells plotted along each basis direction. |
| "PositionCell" | 0 | list of indices specifying which unit cells to plot (highlight) |
| "BackgroundCell" | "UnitCellEdge" | specifies how the remaining lattice points or unit cells (which are not highlighted) should appear |
| "LatticePoints" | plot only lattice points |
| "UnitCellEdge" | plot only the edges of the unit cells |
| "PointsAndCell" | plot the lattice points as well as the edges of the unit cells |
Plot the unit cells for the lattice defined by the basis vectors vi drawn ni times:
| In[1]:= |
| Out[1]= | 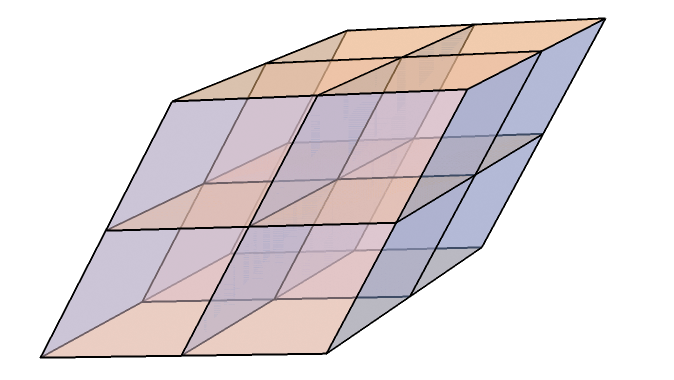 |
Specify the indices of the unit cells to be highlighted by using the option "PositionCell":
| In[2]:= |
| Out[2]= | 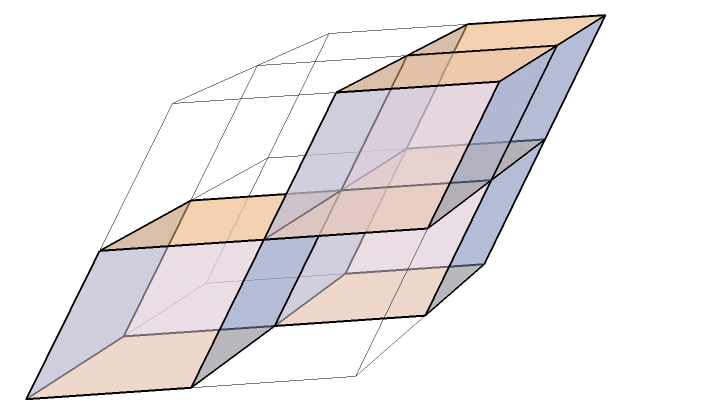 |
"BackgroundCell" is an option that specifies how the remaining lattice points or unit cells (which are not highlighted) should appear:
| In[3]:= |
| Out[3]= | 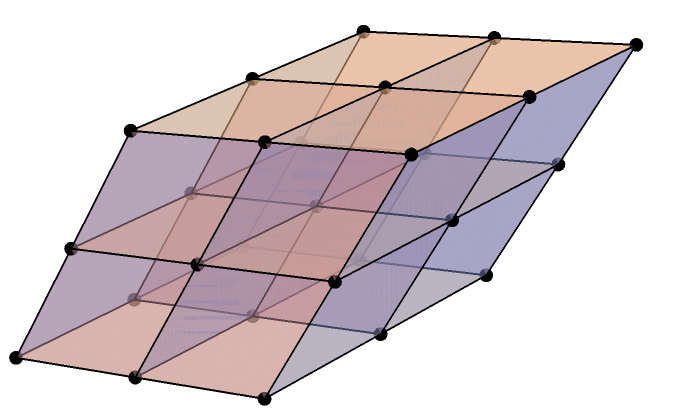 |
"LatticePoints" only highlights the lattice points for the background cells:
| In[4]:= |
| Out[4]= | 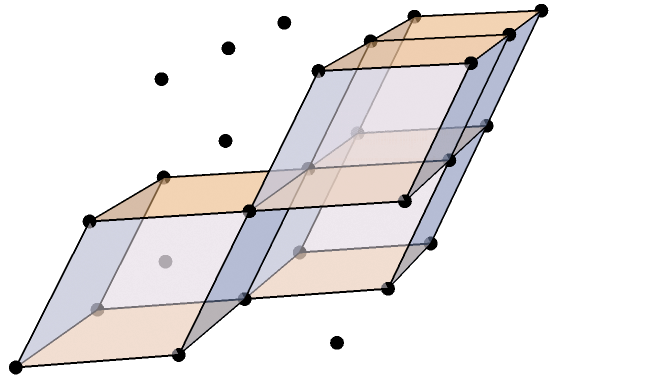 |
"UnitCellEdge" only highlights the edges of the unit cells for the background cells:
| In[5]:= |
| Out[5]= | 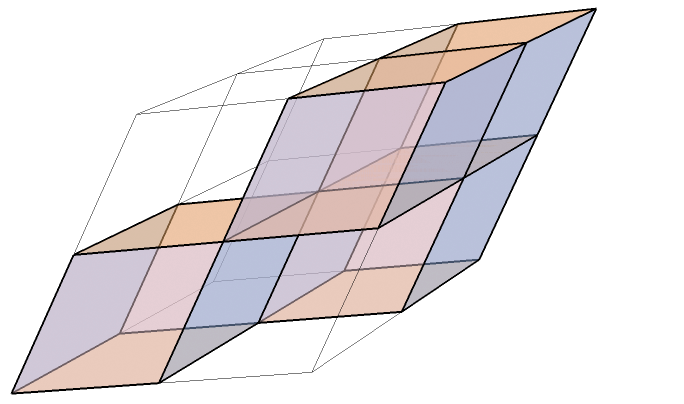 |
"PointsAndCell" highlights both the lattice points and the unit cell edges for the background cells:
| In[6]:= |
| Out[6]= | 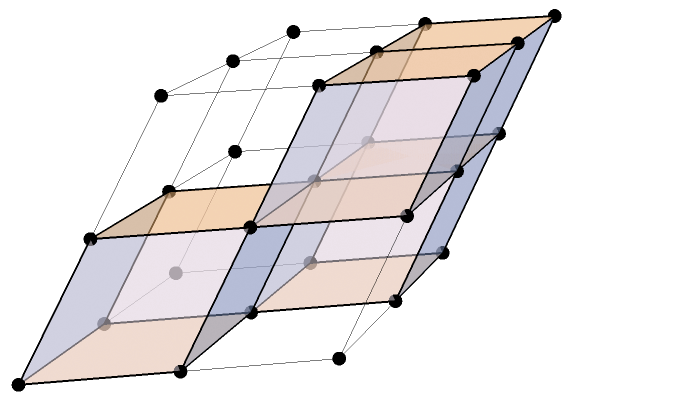 |
This work is licensed under a Creative Commons Attribution 4.0 International License