Wolfram Function Repository
Instant-use add-on functions for the Wolfram Language
Function Repository Resource:
Estimated COVID-19 vaccine doses administered by US state
ResourceFunction["JHUCOVID19VaccineData"][] returns the dataset including total cumulative numbers of COVID-19 vaccine doses administered, as well as allocated and shipped vaccine doses from different providers. |
| "TotalVaccineDosesAllocated" | total cumulative number of COVID-19 vaccine doses allocated |
| "ModernaVaccineDosesAllocated" | cumulative number of Moderna COVID-19 vaccine doses allocated |
| "PfizerVaccineDosesAllocated" | cumulative number of Pfizer COVID-19 vaccine doses allocated |
| "UnknownProviderVaccineDosesAllocated" | cumulative number of COVID-19 vaccine doses allocated from an unknown provider |
| "UnassignedProviderVaccineDosesAllocated” | cumulative number of COVID-19 vaccine doses allocated from an unassigned provider |
| "TotalVaccineDosesShipped" | total cumulative number of COVID-19 vaccine doses shipped |
| "ModernaVaccineDosesShipped" | cumulative number of Moderna COVID-19 vaccine doses shipped |
| "PfizerVaccineDosesShipped" | cumulative number of Pfizer COVID-19 vaccine doses shipped |
| "UnknownProviderVaccineDosesShipped" | cumulative number of COVID-19 vaccine doses shipped from an unknown provider |
| "UnassignedProviderVaccineDosesShipped” | cumulative number of COVID-19 vaccine doses shipped from an unassigned provider |
| "TotalVaccineDosesAdministered" | total cumulative number of COVID-19 vaccine doses administered |
| "ModernaVaccineDosesAdministered" | cumulative number of Moderna COVID-19 vaccine doses administered |
| "PfizerVaccineDosesAdministered" | cumulative number of Pfizer COVID-19 vaccine doses administered |
| "UnknownProviderVaccineDosesAdministered" | cumulative number of COVID-19 vaccine doses administered from an unknown provider |
| "UnassignedProviderVaccineDosesAdministered” | cumulative number of COVID-19 vaccine doses administered from an unassigned provider |
| "TotalFirstDosesAdministered" | total cumulative number of people vaccinated, with only one dose administered |
| "ModernaFirstDosesAdministered” | cumulative number of people vaccinated, with only one Moderna vaccine dose administered |
| "PfizerFirstDosesAdministered” | cumulative number of people vaccinated, with only one Pfizer vaccine dose administered |
| "UnknownProviderFirstDosesAdministered” | cumulative number of people vaccinated, with only one vaccine dose administered from an unknown provider |
| "UnassignedProviderFirstDosesAdministered” | cumulative number of people vaccinated, with only one vaccine dose administered from an unassigned provider |
| "TotalSecondDosesAdministered" | total cumulative number of people fully vaccinated, with two doses administered |
| "ModernaSecondDosesAdministered” | cumulative number of people fully vaccinated, with two Moderna vaccine doses administered |
| "PfizerSecondDosesAdministered” | cumulative number of people fully vaccinated, with two Pfizer vaccine doses administered |
| "UnknownProviderSecondDosesAdministered” | cumulative number of people fully vaccinated, with two vaccine doses administered from an unknown provider |
| "UnassignedProviderSecondDosesAdministered” | cumulative number of people fully vaccinated, with two vaccine doses administered from an unassigned provider |
Retrieve the data:
| In[1]:= |
Color US states by the latest total number of vaccine doses administered:
| In[2]:= |
| Out[2]= | 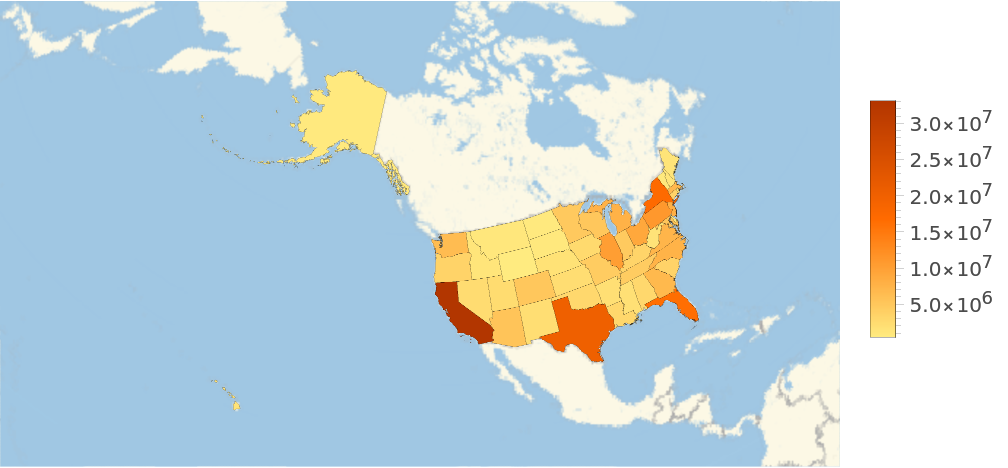 |
Plot estimated total vaccine doses administered per 100k people:
| In[3]:= | ![BarChart[
Labeled[#2, StringTrim[#1["Name"], "," ~~ __]] & @@@ SortBy[Normal@
c19data[Select[! MissingQ[#AdministrativeDivision] &]][
All, {#AdministrativeDivision, 10^5 #TotalVaccineDosesAdministered[
"LastValue"]/#AdministrativeDivision["Population"]} &], Last], Sequence[
BarOrigin -> Left, AspectRatio -> 0.7, BarSpacing -> Medium, ChartStyle -> "Aquamarine", PlotLabel -> "estimated total vaccine doses administered per 100K people"]]](https://www.wolframcloud.com/obj/resourcesystem/images/6a0/6a0032cd-7e10-416f-8abc-d34487439093/1879f9247b9fa856.png) |
| Out[3]= | 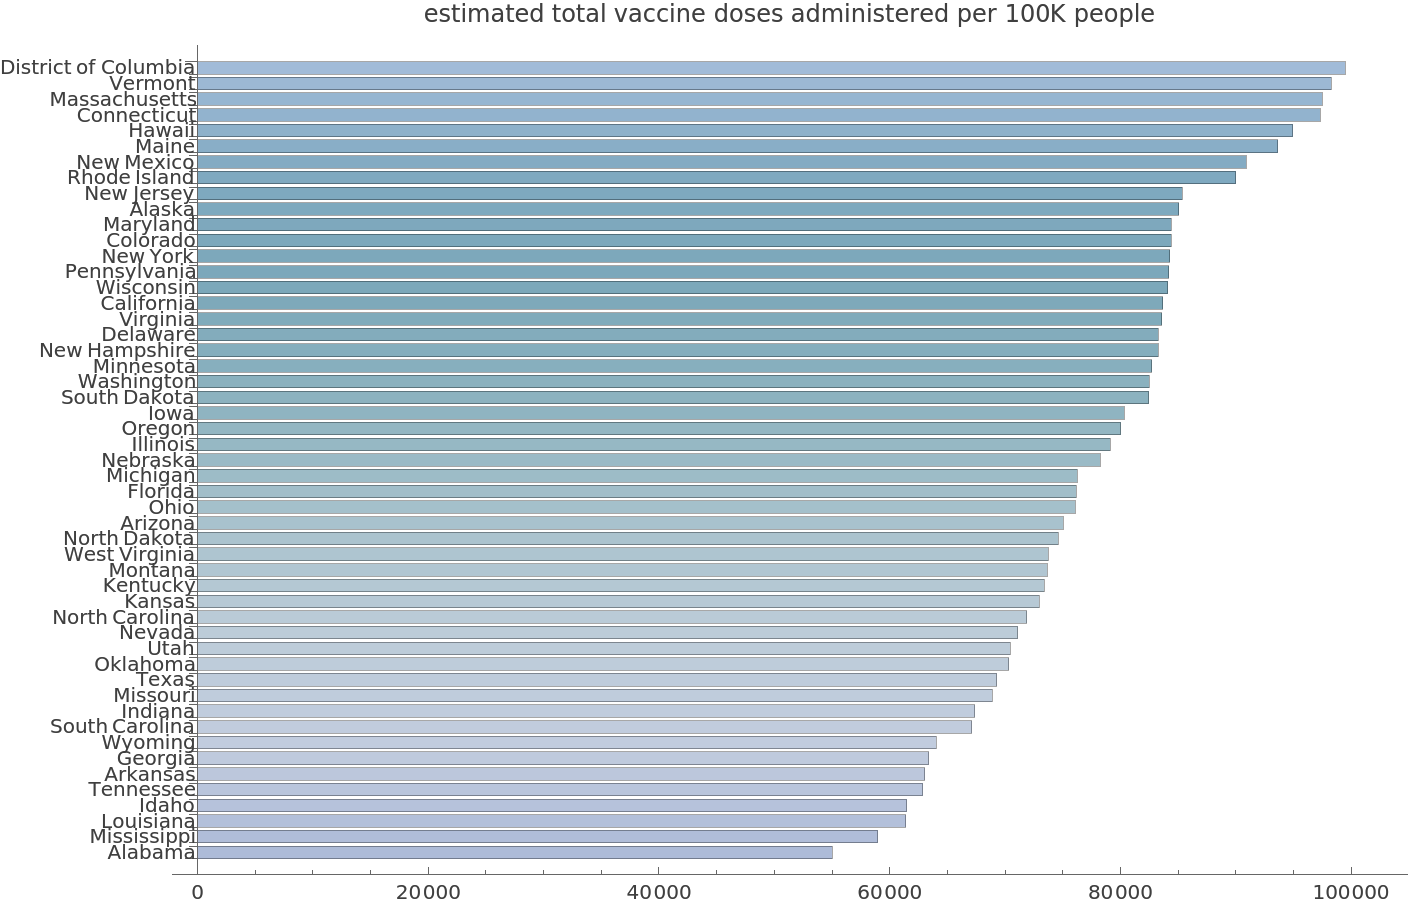 |
Plot total cumulative number of people fully vaccinated with all doses administered:
| In[4]:= | ![DateListLogPlot[
Callout[Tooltip[#2, CommonName[#1]], StringTrim[#1["Name"], "," ~~ __]] & @@@ Normal@c19data[Select[! MissingQ[#AdministrativeDivision] &]][
TakeLargestBy[#TotalSecondDosesAdministered["LastValue"] &, 20]][
All, {#AdministrativeDivision, QuantityMagnitude[
10^5 #TotalSecondDosesAdministered/#AdministrativeDivision[
"Population"]]} &], ReleaseHold[
Hold[PlotRange -> {{
DateObject[{2021, 1, 4}, "Day", "Gregorian", -6.],
JHUCOVID19VaccineData[][
Max, Slot["TotalVaccineDosesAdministered"]["LastDate"]& ]}, Automatic}, PlotLabel -> "total number of people fully vaccinated per 100K people"]]]](https://www.wolframcloud.com/obj/resourcesystem/images/6a0/6a0032cd-7e10-416f-8abc-d34487439093/39a2b4a108a429ae.png) |
| Out[4]= | 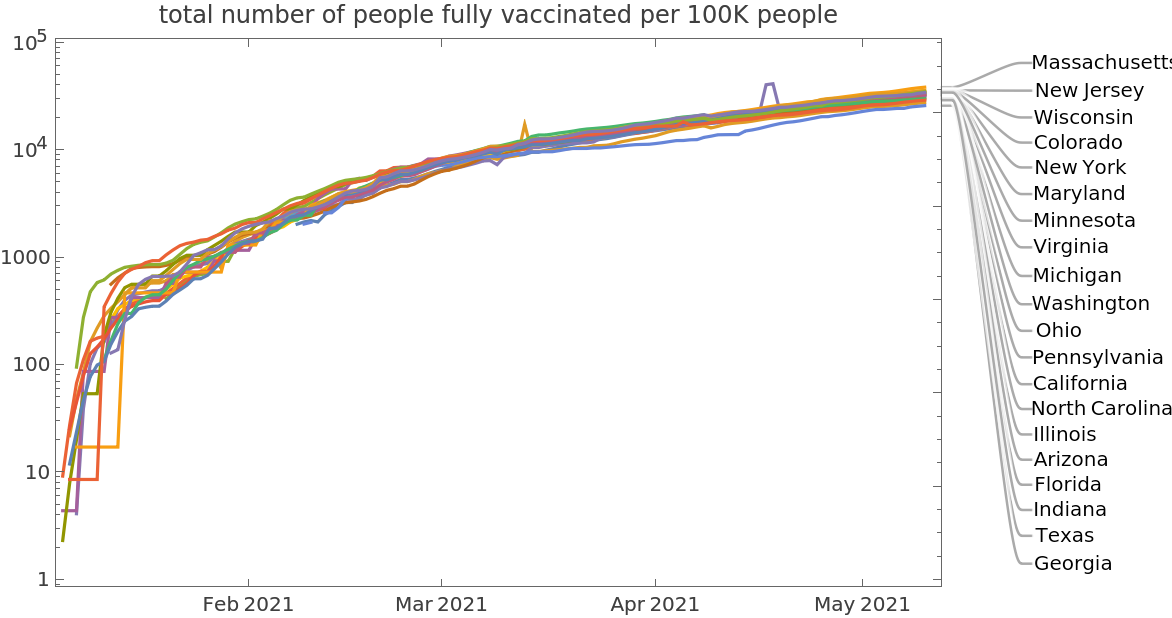 |
This work is licensed under a Creative Commons Attribution 4.0 International License