Wolfram Function Repository
Instant-use add-on functions for the Wolfram Language
Function Repository Resource:
Create a dataset of COVID-19 data from the COVID-19 Data Repository of the Center for Systems Science and Engineering (CSSE) at Johns Hopkins University
ResourceFunction["JHUCOVID19Data"]["USCounties"] returns COVID-19 confirmed cases and deaths by US counties. | |
ResourceFunction["JHUCOVID19Data"]["WorldCountries"] returns COVID-19 confirmed cases and deaths by countries. |
Create world dataset of COVID19:
| In[1]:= |
| Out[1]= |
Top 5 countries with most cumulative death due to COVID19:
| In[2]:= |
| Out[2]= | 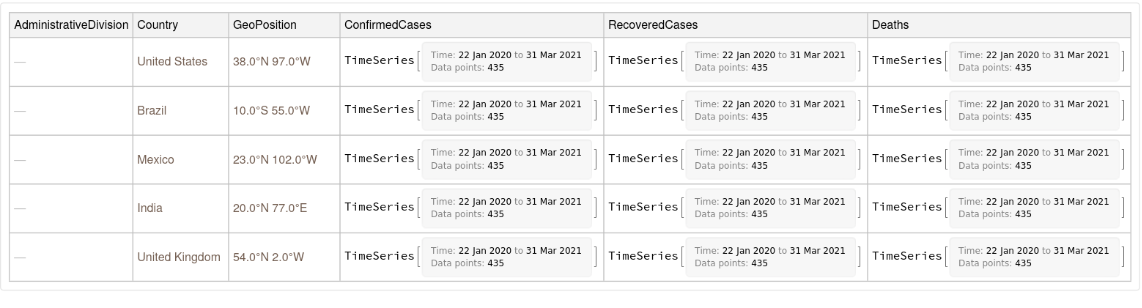 |
Visualize the top 30 countries in terms of cumulative confirmed cases:
| In[3]:= | ![DateListLogPlot[
Callout[Tooltip[10^5 #2/#1["Population"], #1], #1] & @@@ Normal@world[TakeLargestBy[#ConfirmedCases["LastValue"] &, 10]][
All, {#Country, #ConfirmedCases} &], Sequence[PlotRange -> All, GridLines -> Automatic, AspectRatio -> 1.5, ImageSize -> 500, PlotLabel -> "estimated confirmed cases per 100K people (log scale)"]]](https://www.wolframcloud.com/obj/resourcesystem/images/c89/c8968ac4-c924-4fea-b213-81094f879791/4c293fca1c13901b.png) |
| Out[3]= | 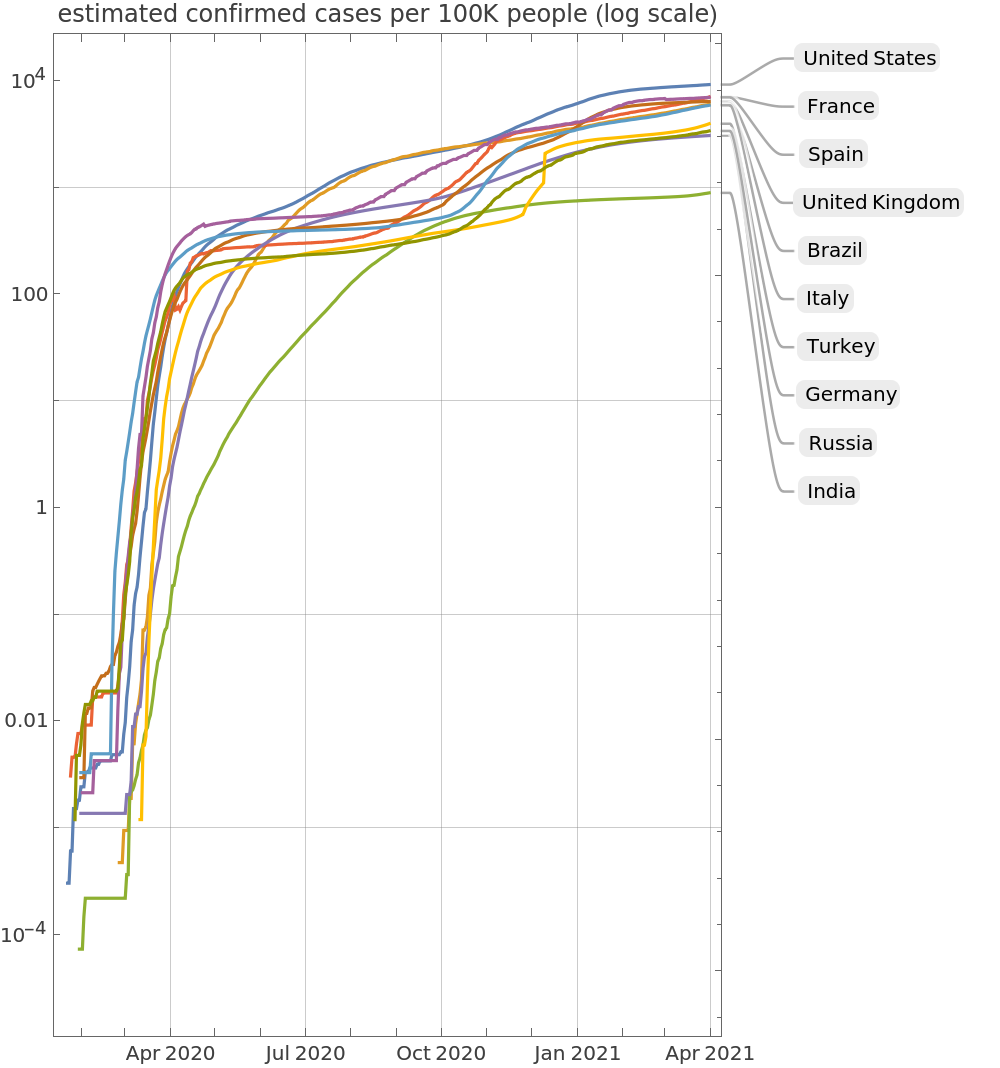 |
The only allowed inputs are "USCounties" and "WorldCountries":
| In[4]:= |
| Out[4]= |
Get the US COVID19 by counties:
| In[5]:= |
| Out[5]= |
A peek into the US dataset:
| In[6]:= |
| Out[6]= | 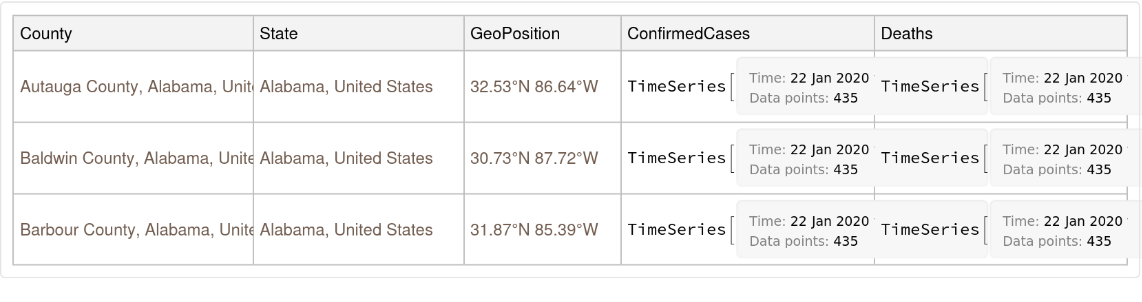 |
Visualize the confirmed cases of California counties, per 100k inhabitants:
| In[7]:= | ![GeoRegionValuePlot[
Normal@usa[
Select[Entity[
"AdministrativeDivision", {"California", "UnitedStates"}] == #State &]][
All, {#County, 10^5*#ConfirmedCases["LastValue"]/#County["Population"] /. 1/("People") -> IndependentUnit["per 100K people"]} &], PlotLabel -> "COVID-19 cases per 100k inhabitants, CA counties"]](https://www.wolframcloud.com/obj/resourcesystem/images/c89/c8968ac4-c924-4fea-b213-81094f879791/12eeed2b34659e8d.png) |
| Out[7]= | 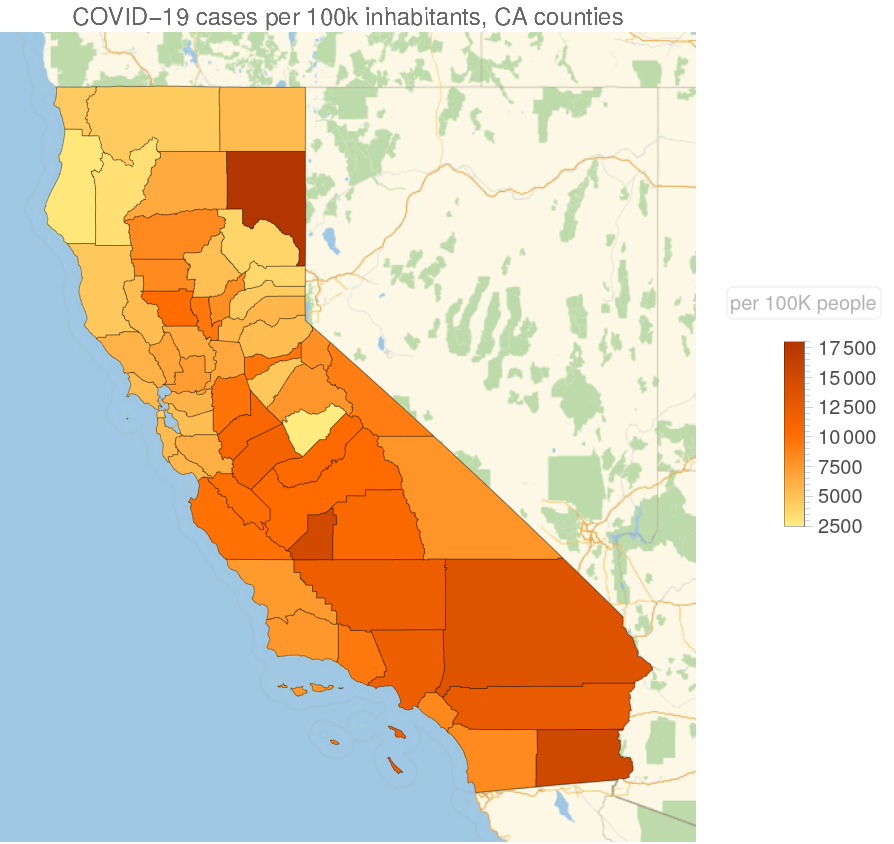 |
This work is licensed under a Creative Commons Attribution 4.0 International License