Function Repository Resource:

IntersectionPlot

Source Notebook

Plot two curves and highlight their points of intersection

Contributed by: Wolfram|Alpha Math Team

ResourceFunction["IntersectionPlot"][{curve1,curve2},{x,lo,hi}]

returns a plot of curve1 and curve2 on the domain lo<x<hi and highlights their intersections.

Details and Options

ResourceFunction["IntersectionPlot"] takes the options of both Solve and Plot for styling and computation of intersections.
By default, the plot generated by ResourceFunction["IntersectionPlot"] has a legend labelling plot lines according to the curvei.

Examples

Basic Examples (1) 

Plot the points of intersection of Sin[x] and Cos[x]:

In[1]:=
ResourceFunction[
 "IntersectionPlot"][{Sin[x], Cos[x]}, {x, -3 Pi, 3 Pi}]
Out[1]=

Scope (1) 

Use PlotLegends to turn off the legend:

In[2]:=
ResourceFunction[
 "IntersectionPlot"][{Sin[x], Cos[x]}, {x, -3 Pi, 3 Pi}, PlotLegends -> None]
Out[2]=

Possible Issues (1) 

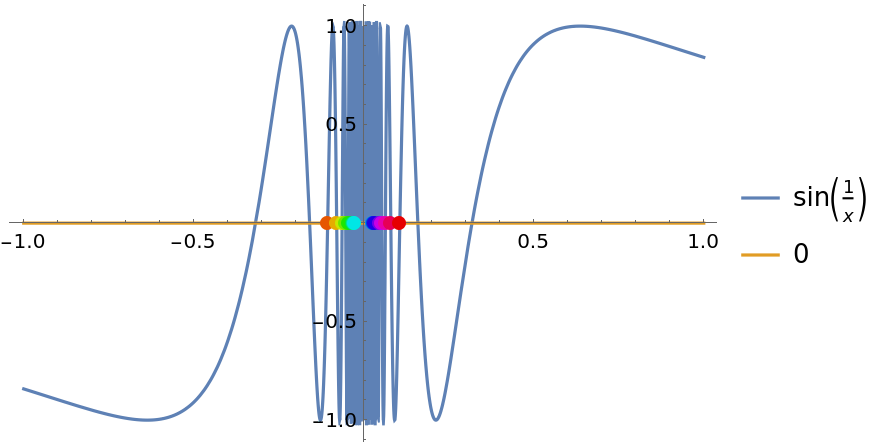
For curves that intersect infinitely many times, a subset of the points of intersection will be selected:

In[3]:=
ResourceFunction["IntersectionPlot"][{Sin[1/x], 0}, {x, -1, 1}]
Out[3]=

Publisher

Wolfram|Alpha Math Team

Version History

  • 2.0.0 – 23 March 2023
  • 1.0.0 – 01 April 2020

Related Resources

License Information