Details and Options
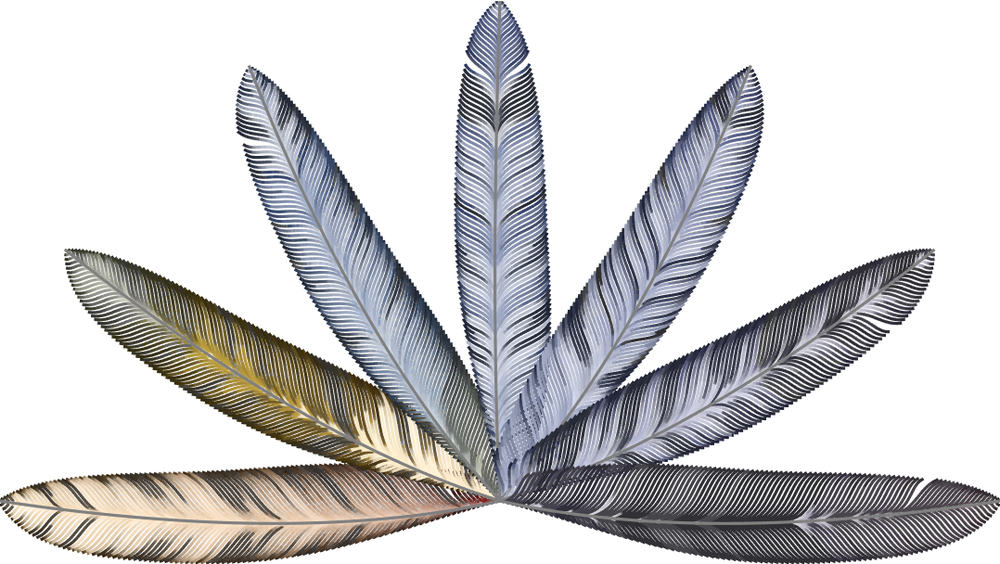
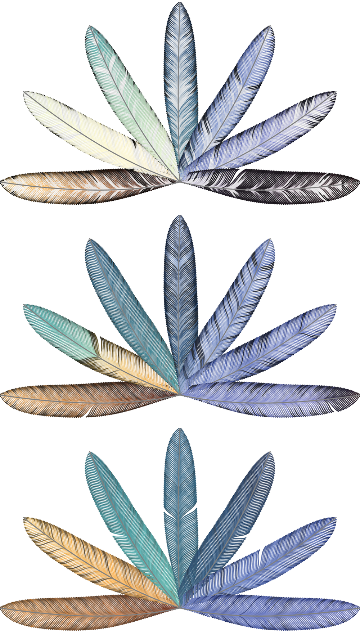
The pixels of img are sorted by hue, divided into equal portions (the feathers), and divided again into 100 equal portions for each feather (the rami) which are then sorted by brightness. These sorted groups of pixels become the color functions for the curves of each ramus.
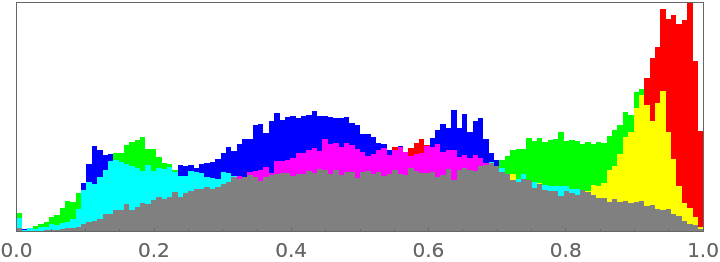
The bins in ResourceFunction["ImagePalettePlumes"] are determined by actual colors used, in contrast to a histogram's bins which are equal parts of the hue spectrum. For example, if there is no red in img, then the first feather will show shades of orange or the next used hue in the HSB color space.
ResourceFunction["ImagePalettePlumes"] creates a new image in the "RGB" color space.
ResourceFunction["ImagePalettePlumes"] can take the following options:
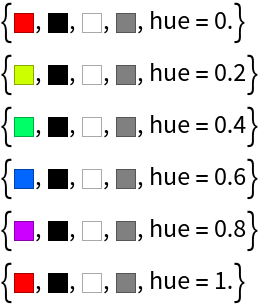
| "Excluded" | "BlackWhite" | discards certain pixels from img |
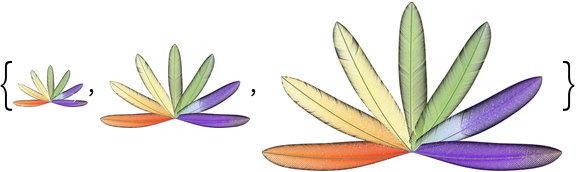
| ImageSize | 1000 | the size of the output image |
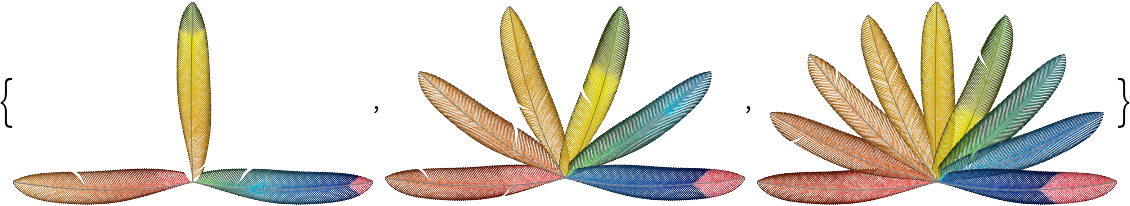
| "PlumeCount" | 7 | the number of plumes, 0 ≤ n,n ∈ ℤ |
Possible values for the "Excluded" option include:
| None or "None" | processes all of the pixels in img |
| "White" | discards pixels close to white |
| "Black" | discards pixels close to black |
| "BlackWhite" | discards pixels close to either black or white |
| "GrayTones" | discards all pixels with saturation values below 0.2 |
| n | discards all pixels with saturation values ≤ n |
With "PlumeCount"→0, the palette data is displayed in a more utilitarian rectangular format, with no feathers.
ResourceFunction["ImagePalettePlumes"] can take a long time to render. Downsizing the image first shortens the render time.

![(* Evaluate this cell to get the example input *) CloudGet["https://www.wolframcloud.com/obj/e13460d1-a2d1-4c94-9319-3f467e482632"]](https://www.wolframcloud.com/obj/resourcesystem/images/907/907893f1-f606-4258-aa58-208207f337dc/4135c300f56d1a13.png)
![(* Evaluate this cell to get the example input *) CloudGet["https://www.wolframcloud.com/obj/fdefaaaf-b215-4929-81d4-84c313dd4882"]](https://www.wolframcloud.com/obj/resourcesystem/images/907/907893f1-f606-4258-aa58-208207f337dc/2efc28f7a97dc20d.png)

![(* Evaluate this cell to get the example input *) CloudGet["https://www.wolframcloud.com/obj/e9a45ce6-1865-43ad-b569-6f78fbc4546b"]](https://www.wolframcloud.com/obj/resourcesystem/images/907/907893f1-f606-4258-aa58-208207f337dc/4ff1bf5468c40e2f.png)
![(* Evaluate this cell to get the example input *) CloudGet["https://www.wolframcloud.com/obj/6b818c1a-44db-47af-a112-2acd2c9221d7"]](https://www.wolframcloud.com/obj/resourcesystem/images/907/907893f1-f606-4258-aa58-208207f337dc/2a99c751a34ea208.png)
![(* Evaluate this cell to get the example input *) CloudGet["https://www.wolframcloud.com/obj/6d50ea96-7392-4107-954b-a83b28e899a8"]](https://www.wolframcloud.com/obj/resourcesystem/images/907/907893f1-f606-4258-aa58-208207f337dc/0dca3073e3efe634.png)

![(* Evaluate this cell to get the example input *) CloudGet["https://www.wolframcloud.com/obj/5c4c543c-6865-4bce-a80e-be30e3224298"]](https://www.wolframcloud.com/obj/resourcesystem/images/907/907893f1-f606-4258-aa58-208207f337dc/7bfe8698713743ad.png)
![(* Evaluate this cell to get the example input *) CloudGet["https://www.wolframcloud.com/obj/656d4f54-bdda-4a55-8f9c-9e40a4214afd"]](https://www.wolframcloud.com/obj/resourcesystem/images/907/907893f1-f606-4258-aa58-208207f337dc/0c30b491dd289838.png)

![(* Evaluate this cell to get the example input *) CloudGet["https://www.wolframcloud.com/obj/9ed15096-00a7-4d27-8186-ec574695e972"]](https://www.wolframcloud.com/obj/resourcesystem/images/907/907893f1-f606-4258-aa58-208207f337dc/54360f1a5f8ecc21.png)
![(* Evaluate this cell to get the example input *) CloudGet["https://www.wolframcloud.com/obj/caa728ff-ef76-47df-93ee-01dd78e38ae4"]](https://www.wolframcloud.com/obj/resourcesystem/images/907/907893f1-f606-4258-aa58-208207f337dc/00ee38d44c69a2af.png)