Wolfram Function Repository
Instant-use add-on functions for the Wolfram Language
Function Repository Resource:
Create a palette for iconizing the selection
ResourceFunction["IconizerPalette"][] creates a palette with a button for iconizing a selection. |
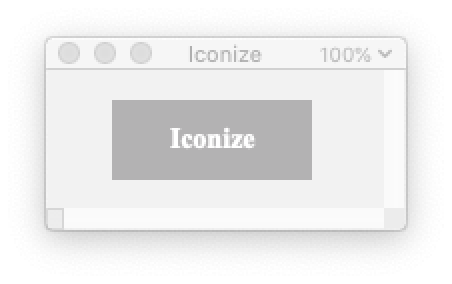
Create the palette:
| In[1]:= |
Select relevant options to iconize and click on the button to iconize:
| In[2]:= | ![Plot[{Exp[x], Log[x], x}, {x, -3, 3},
PlotRange -> 3, PlotStyle -> {RGBColor[1, 0, 0], RGBColor[0, 1, 0], Dashing[{Small, Small}]}, AspectRatio -> Automatic]](https://www.wolframcloud.com/obj/resourcesystem/images/ca8/ca889fe2-830e-4aa4-8f42-e97c28cb755e/49d14a02b2c6b1a7.png) |
After iconizing:
| In[3]:= |
This work is licensed under a Creative Commons Attribution 4.0 International License