Wolfram Function Repository
Instant-use add-on functions for the Wolfram Language
Function Repository Resource:
Remove outliers from a signal using a Hampel window
ResourceFunction["HampelFilter"][data] removes outliers from data. | |
ResourceFunction["HampelFilter"][data,w] uses a moving window of size w. | |
ResourceFunction["HampelFilter"][data,w,d] removes outliers that are more than d standard deviations away from the expectation. |
Signal data with outliers:
| In[1]:= |
| In[2]:= |
| Out[2]= | 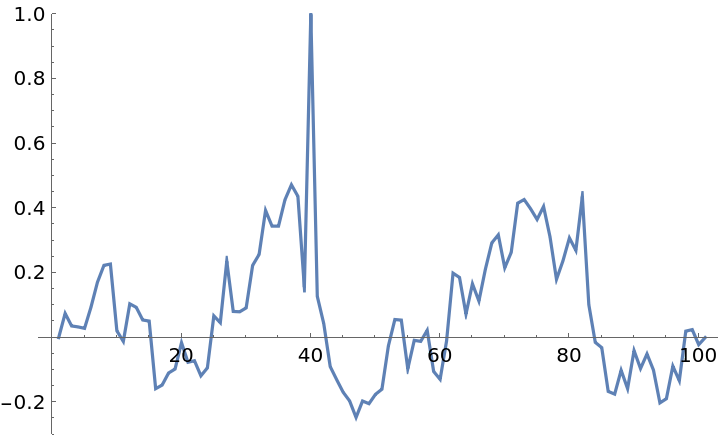 |
Remove outliers from the data:
| In[3]:= |
| Out[3]= | 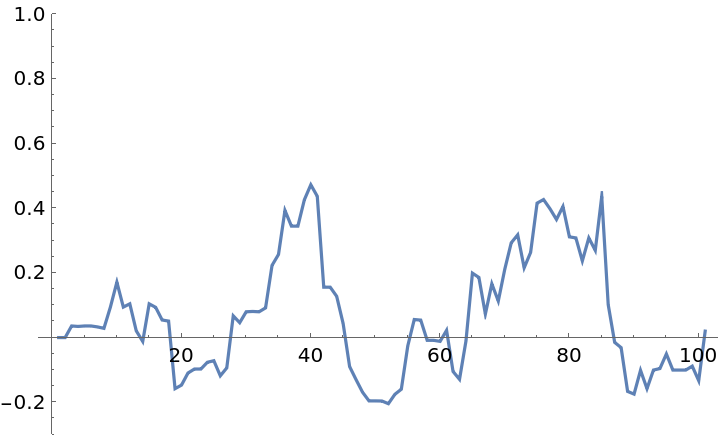 |
Reduce the window size used to decide if a point is an outlier:
| In[4]:= |
| In[5]:= |
| Out[5]= | 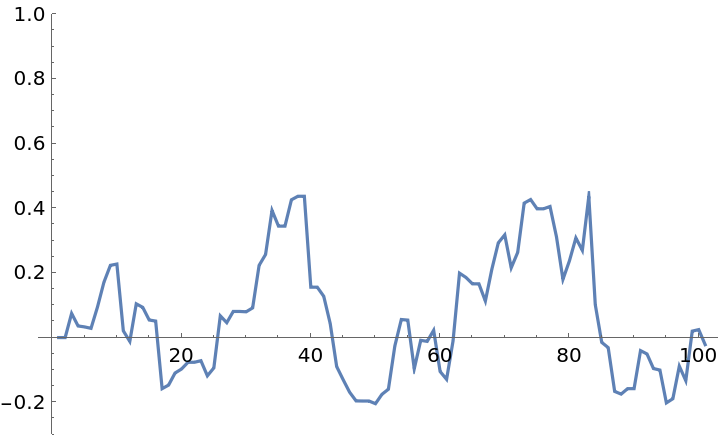 |
The window size can be also be increased:
| In[6]:= |
| Out[6]= | 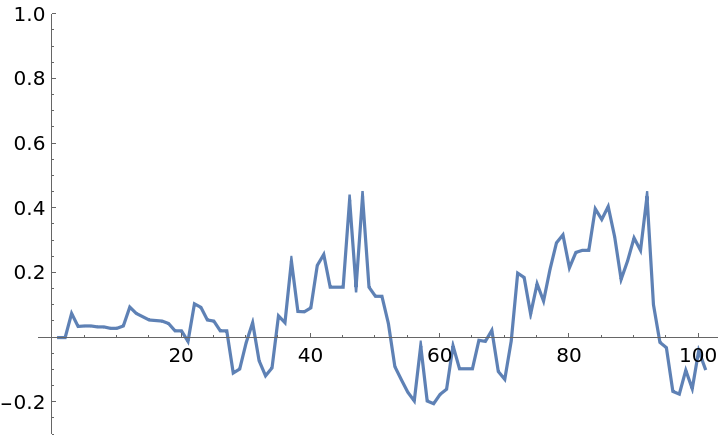 |
Reduce the outlier threshold to make HampelFilter more sensitive:
| In[7]:= |
| Out[7]= | 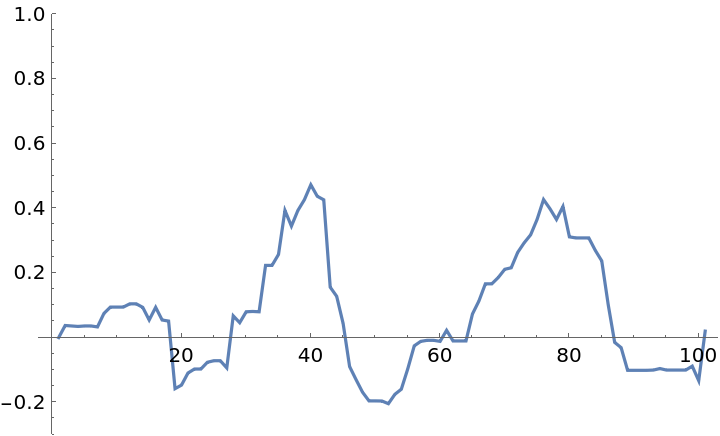 |
Increasing the threshold will adjust fewer points:
| In[8]:= |
| Out[8]= | 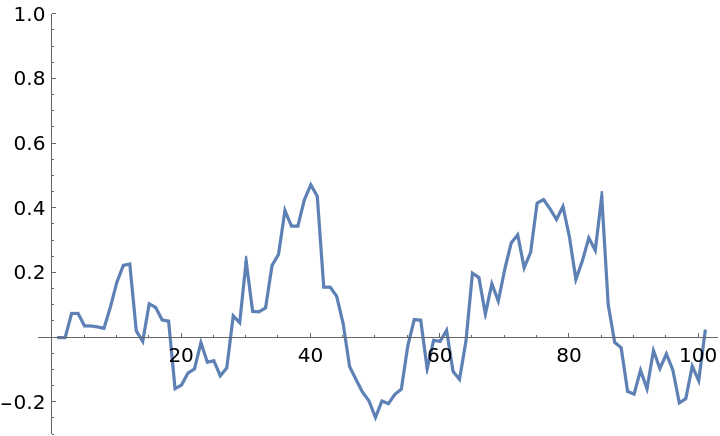 |
This work is licensed under a Creative Commons Attribution 4.0 International License