Wolfram Function Repository
Instant-use add-on functions for the Wolfram Language
Function Repository Resource:
Create a mesh representing a metric from a graphic
ResourceFunction["GraphicsMetricGraph"][graphics] makes a graph corresponding to a mesh representing a metric constructed from graphics. |
Generate a surface:
| In[1]:= |
| Out[1]= | 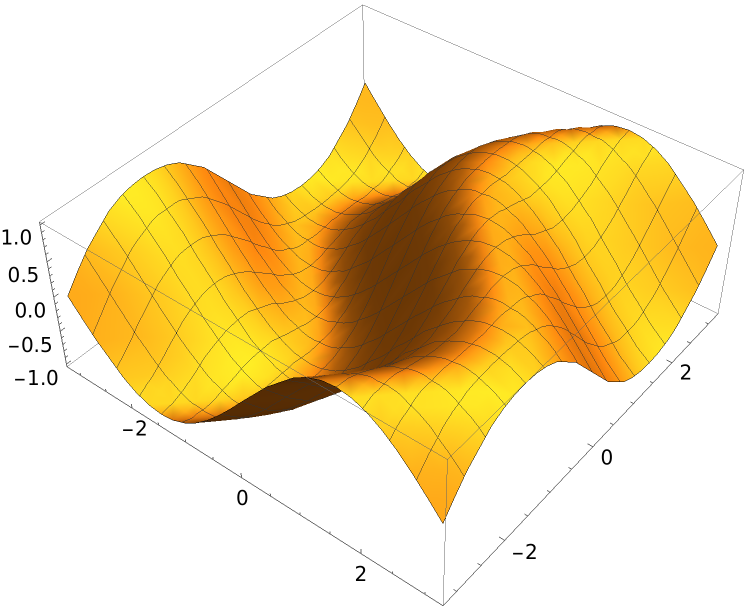 |
Produce a metric-preserving graph from the surface:
| In[2]:= |
| Out[2]= | 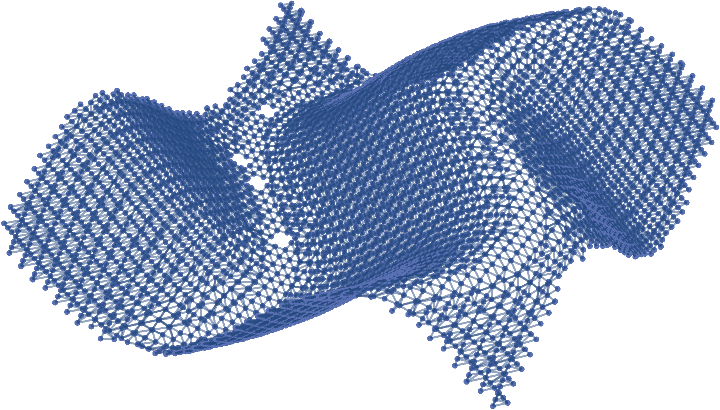 |
Use a coarser sampling:
| In[3]:= |
| Out[3]= | 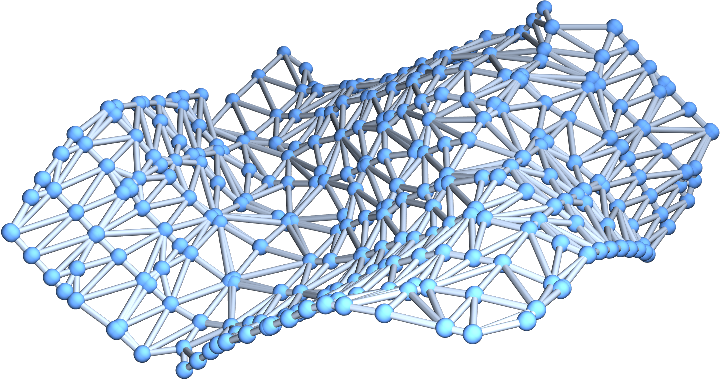 |
This work is licensed under a Creative Commons Attribution 4.0 International License