Wolfram Function Repository
Instant-use add-on functions for the Wolfram Language
Function Repository Resource:
Generate grid lines in graphics in the style of traditional graph paper
ResourceFunction["GraphPaperGridLines"][{{xlo,xhi},{ylo,hi}}] creates the GridLines option for graph paper style lines over the range given by xlo,xhi,ylo,yhi. | |
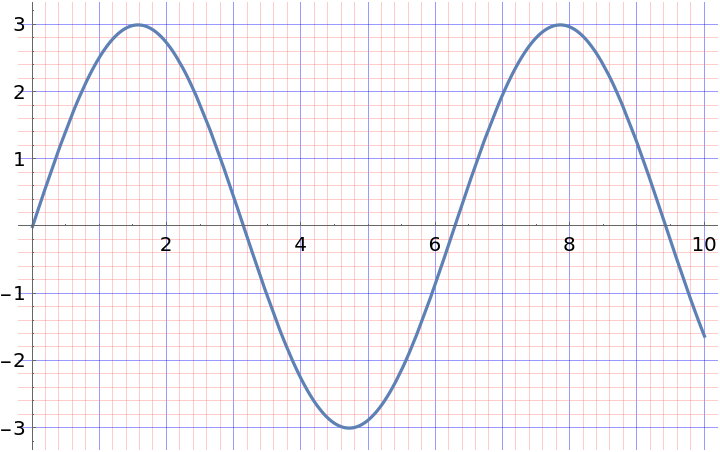
Show a plot with graph paper style GridLines:
| In[1]:= |
|
| Out[1]= |

|
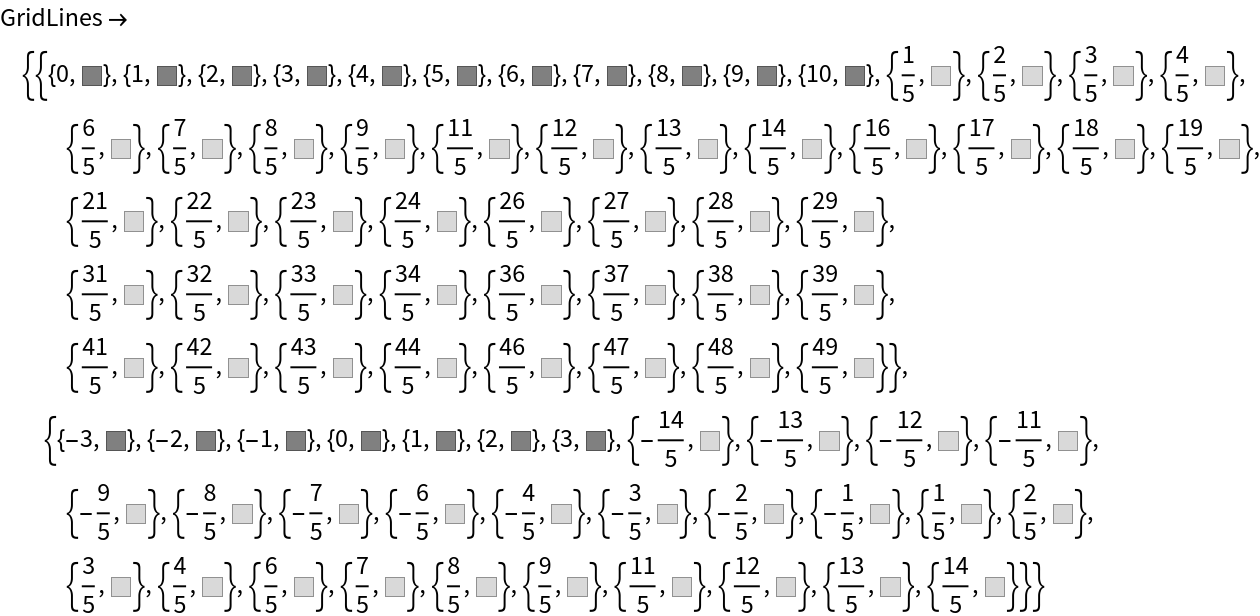
Generate the option value to give this effect:
| In[2]:= |
|
| Out[2]= |
|
| In[3]:= |
|
| Out[3]= |
|
You can change the style of both the primary and secondary GridLines:
| In[4]:= |
|
| Out[4]= |
|
You can change how many subdivisions there are between each primary grid line. Typically values will be 2, 5 or 10:
| In[5]:= |
|
| Out[5]= |
|
| In[6]:= |
|
| Out[6]= |

|
When applied to a Graphics object, the PlotRange of the object is used to calculate the grid:
| In[7]:= |
|
| Out[7]= |

|
This is equivalent to:
| In[8]:= |
|
| Out[8]= |

|
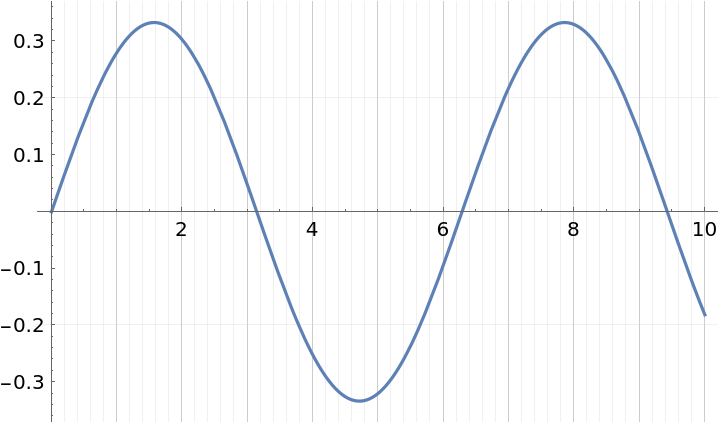
If used within functions with a HoldAll attribute, it is necessary to use Evaluate:
| In[9]:= |
|
| Out[9]= |
|
| In[10]:= |
![Plot[3 Sin[ x], {x, 0, 10}, AspectRatio -> Automatic, Evaluate[ ResourceFunction["GraphPaperGridLines"][{{0, 10}, {-3, 3}}]]]](https://www.wolframcloud.com/obj/resourcesystem/images/5d6/5d6ac657-9bca-4402-96c0-33d61e7a348a/0d929219b99b825f.png)
|
| Out[10]= |

|
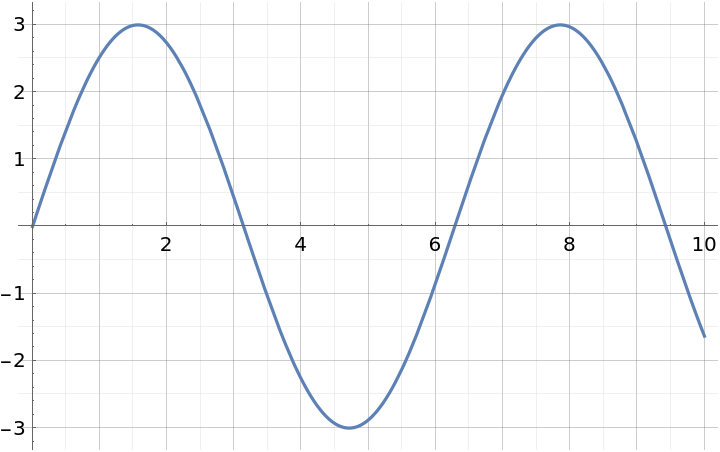
GridLines are equally spaced in the x and y directions, so if AspectRatio is not Automatic, the spacings will then appear different in the different directions:
| In[11]:= |
|
| Out[11]= |
|
This work is licensed under a Creative Commons Attribution 4.0 International License