Wolfram Function Repository
Instant-use add-on functions for the Wolfram Language
Function Repository Resource:
Generate a dataset from Google Community Mobility Reports for a given country
ResourceFunction["GoogleMobilityReport"][country] generate a Dataset for country from Google Community Mobility Reports. |
| "Country" | the corresponding country |
| "SubRegion1" | level 1 administrative divisions within a country (e.g. US states) |
| "SubRegion2" | level 2 administrative divisions of an administrative division of level 1 (e.g. US counties) |
| "MetroArea" | corresponding metropolitan areas, if any |
| "RetailAndRecreation" | mobility trends for places like restaurants, cafes, shopping centers, theme parks, museums, libraries and movie theaters |
| "GroceryAndPharmacy" | mobility trends for places like grocery markets, food warehouses, farmers markets, specialty food shops, drug stores and pharmacies |
| "Parks" | mobility trends for places like local parks, national parks, public beaches, marinas, dog parks, plazas and public gardens |
| "TransitStations" | mobility trends for places like public transport hubs such as subway, bus and train stations |
| "Workplaces" | mobility trends for places of work |
| "Residential" | mobility trends for places of residence |
Get the data of United Arab Emirates:
Look at three random rows of the Dataset:
| In[1]:= |
| Out[1]= | 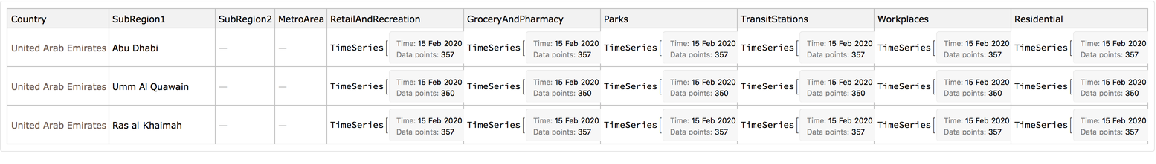 |
Visualize the data for the city of Dubai:
| In[2]:= |
| Out[2]= | 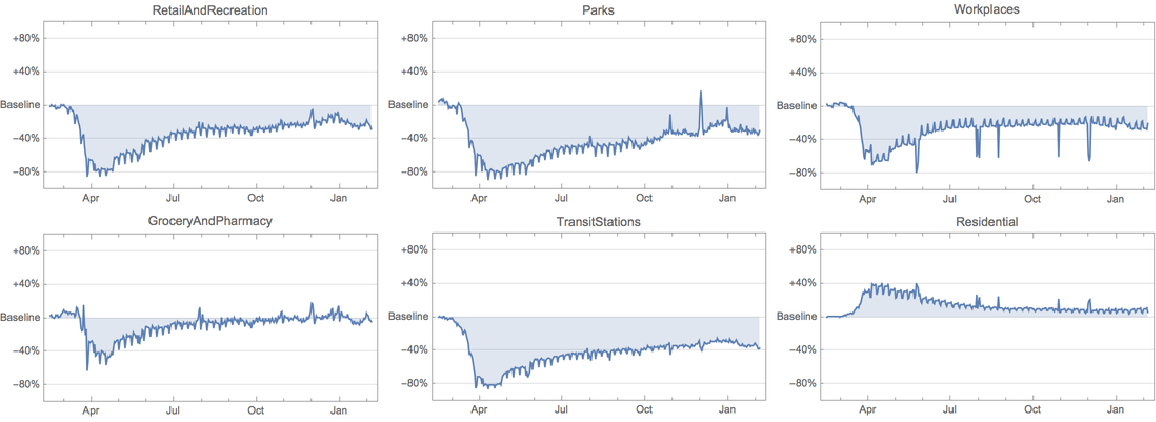 |
Google reports do not contain all countries:
| In[3]:= |
| Out[3]= |
Get the data of United Arab Emirates:
A manipulate comparing the latest value of mobility reports in UAE:
| In[4]:= | ![Manipulate[
GeoRegionValuePlot[
dt[All, {"SubRegion1", report}][
Values, {#[[1]], #[[2]]["LastValue"]} &]], {{report, "RetailAndRecreation", "Report"}, {"RetailAndRecreation", "GroceryAndPharmacy", "Parks", "TransitStations", "Workplaces", "Residential"}}, Initialization :> {dt = uae[Rest, {"SubRegion1" -> Interpreter["AdministrativeDivision"]}]}, SaveDefinitions -> True]](https://www.wolframcloud.com/obj/resourcesystem/images/aa3/aa325192-2501-4658-8b03-0719d7853334/195bf0edf5799ecb.png) |
| Out[4]= | 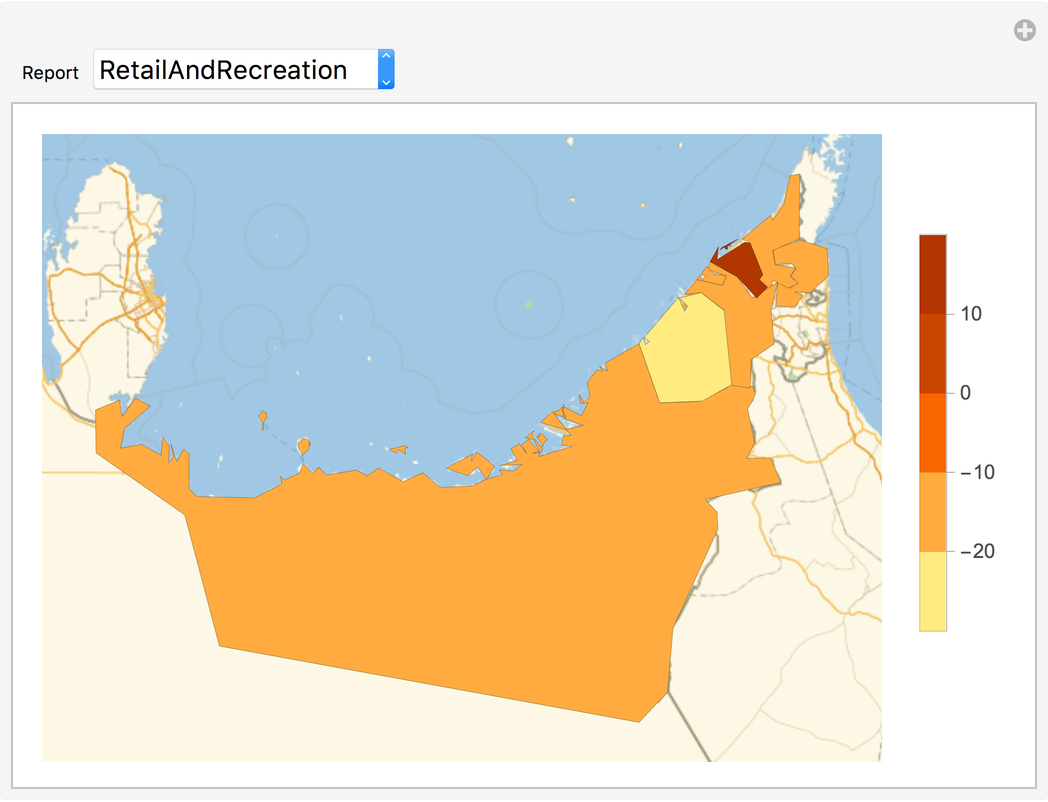 |
This work is licensed under a Creative Commons Attribution 4.0 International License