Wolfram Function Repository
Instant-use add-on functions for the Wolfram Language
Function Repository Resource:
Plot the location of bedrock for a specified geological period
ResourceFunction["GeologicalPeriodBedrockPlot"][entity] plot the location of the bedrock for the specified geological period entity. | |
ResourceFunction["GeologicalPeriodBedrockPlot"][{entity1,entity2,…}] plot the location of the bedrock for the specified geological periods. | |
ResourceFunction["GeologicalPeriodBedrockPlot"][eclass] plot the location of the bedrock for the specified geological period entity class eclass. | |
ResourceFunction["GeologicalPeriodBedrockPlot"][All] plot the location of the bedrock for all available geological periods. |
| "BedrockColor" | Automatic | color specification for bedrock |
| "BedrockOpacity" | 1 | opacity value to use for bedrock |
| GeoBackground | "ReliefMap" | style specifications for the background |
| "IncludePoliticalBoundaries" | True | whether to include political boundaries |
| "LegendPlacement" | After | placement of the legend |
| PlotLegends | False | whether to include a legend |
Plot the position of Ordovician bedrock:
| In[1]:= |
| Out[1]= | 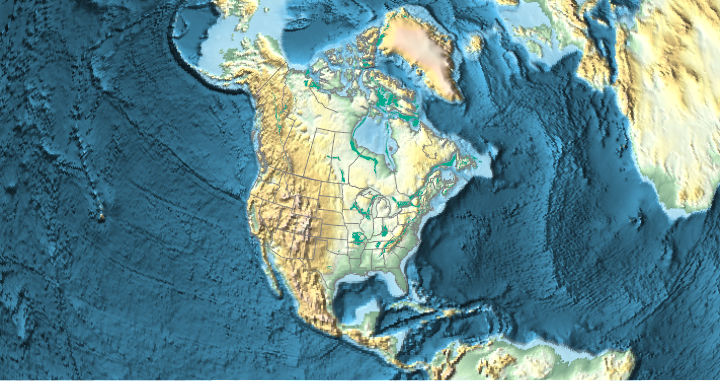 |
Plot the location of bedrock from multiple geological periods:
| In[2]:= | ![ResourceFunction[
"GeologicalPeriodBedrockPlot"][{Entity["GeologicalPeriod", "LateOrdovicianEpoch"], Entity["GeologicalPeriod", "JurassicPeriod"], Entity["GeologicalPeriod", "ArcheanEon"]}]](https://www.wolframcloud.com/obj/resourcesystem/images/afb/afbc89a0-c4ee-4fa7-b40f-a3966b0fb7ae/3ef9b9fdc15417a4.png) |
| Out[2]= | 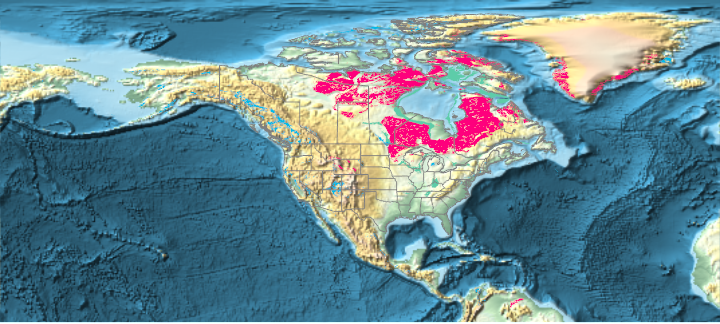 |
Plot the location of bedrock for entity classes of geological periods:
| In[3]:= |
| Out[3]= | 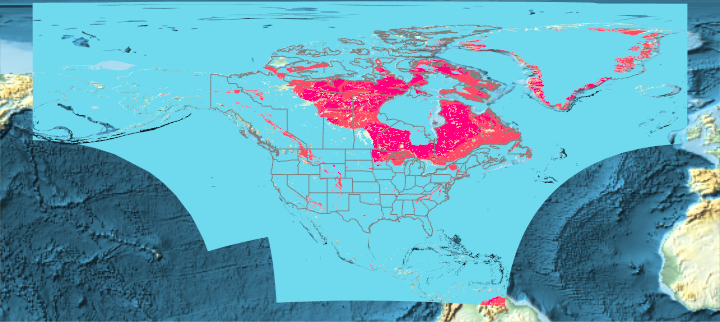 |
Plot all available data (this may take several minutes and consume significant memory):
| In[4]:= |
| Out[4]= | 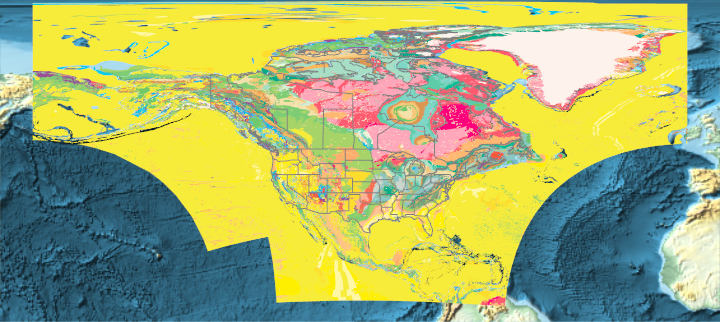 |
Plot the Canadian Shield, which is the ancient bedrock forming the stable core of North America:
| In[5]:= |
| Out[5]= | 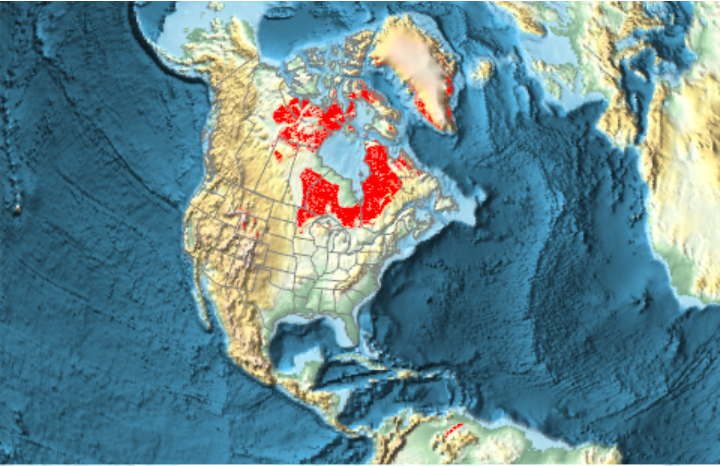 |
Change the opacity of the requested bedrock to allow background relief features to be seen:
| In[6]:= | ![ResourceFunction["GeologicalPeriodBedrockPlot"][
Entity["GeologicalPeriod", "PermianPeriod"], GeoCenter -> Entity["AdministrativeDivision", {"Oklahoma", "UnitedStates"}], GeoRange -> Quantity[300, "Miles"], "BedrockOpacity" -> .5]](https://www.wolframcloud.com/obj/resourcesystem/images/afb/afbc89a0-c4ee-4fa7-b40f-a3966b0fb7ae/2e979cb193dc1735.png) |
| Out[6]= | 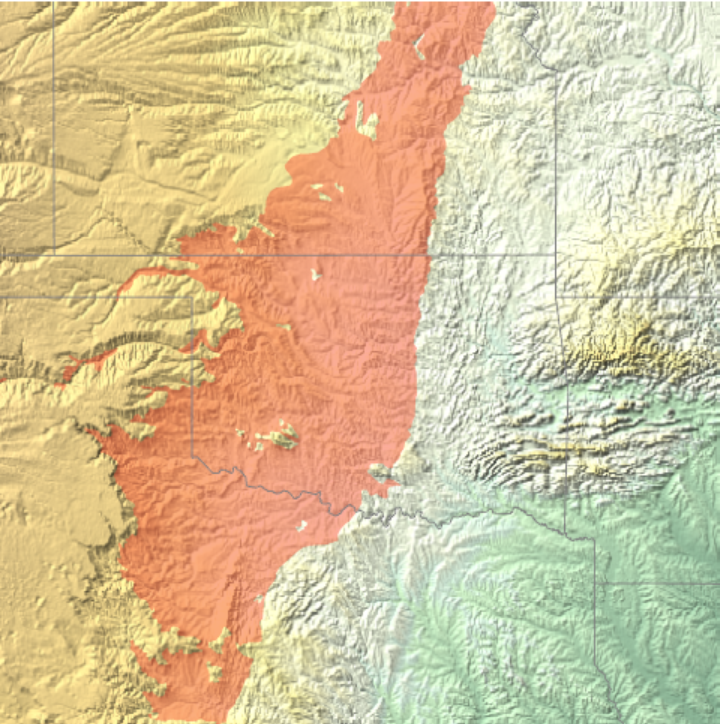 |
Turn off political boundaries:
| In[7]:= | ![ResourceFunction[
"GeologicalPeriodBedrockPlot"][{Entity["GeologicalPeriod", "MesoproterozoicEra"], Entity["GeologicalPeriod", "NeoproterozoicEra"], Entity["GeologicalPeriod", "CambrianPeriod"], Entity["GeologicalPeriod", "OrdovicianPeriod"]}, GeoCenter -> Entity["AdministrativeDivision", {"Wisconsin", "UnitedStates"}], GeoRange -> Quantity[300, "Miles"], "IncludePoliticalBoundaries" -> False]](https://www.wolframcloud.com/obj/resourcesystem/images/afb/afbc89a0-c4ee-4fa7-b40f-a3966b0fb7ae/6972926fae7d768c.png) |
| Out[7]= | 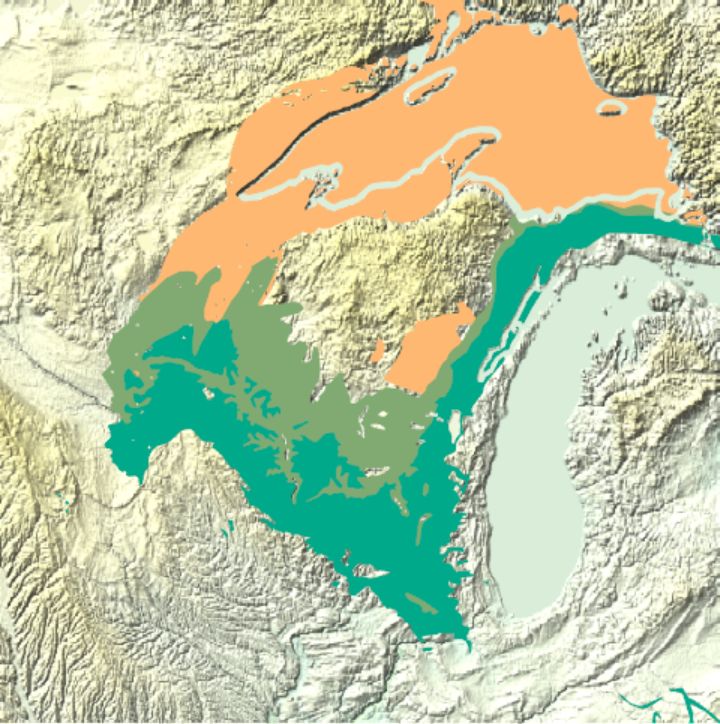 |
If legends are activated, the placement of the legend can be adjusted:
| In[8]:= | ![ResourceFunction[
"GeologicalPeriodBedrockPlot"][{Entity["GeologicalPeriod", "CretaceousPeriod"], Entity["GeologicalPeriod", "JurassicPeriod"], Entity["GeologicalPeriod", "TriassicPeriod"], Entity["GeologicalPeriod", "PaleoceneEpoch"]}, GeoCenter -> Entity["AdministrativeDivision", {"Colorado", "UnitedStates"}], GeoRange -> Quantity[300, "Miles"], PlotLegends -> True, "LegendPlacement" -> Before]](https://www.wolframcloud.com/obj/resourcesystem/images/afb/afbc89a0-c4ee-4fa7-b40f-a3966b0fb7ae/36b5b58772d60f15.png) |
| Out[8]= | 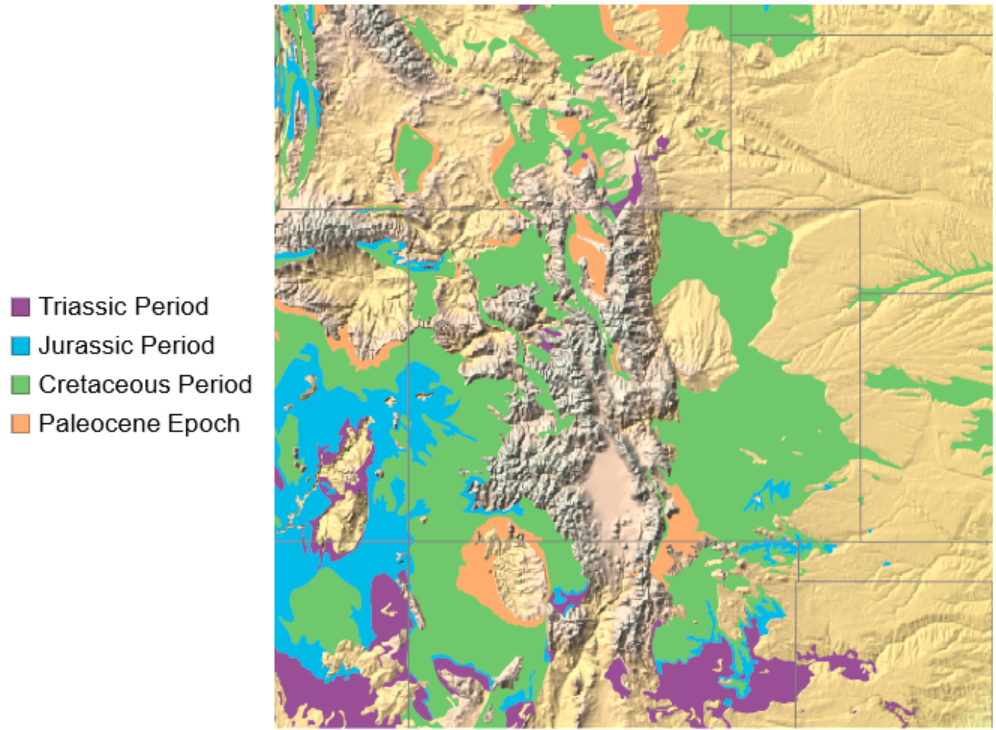 |
GeologicalPeriodBedrockPlot is implemented using GeoGraphics applied to the "BedrockPolygon" and "CGMWColor" properties for the "GeologicalPeriod" entity type:
| In[9]:= | ![GeoGraphics[{EntityValue[Entity["GeologicalPeriod", "MioceneEpoch"], EntityFunction[
e, {GeoStyling[e["CGMWColor"]], e["BedrockPolygon"]}]]}, GeoBackground -> "ReliefMap"]](https://www.wolframcloud.com/obj/resourcesystem/images/afb/afbc89a0-c4ee-4fa7-b40f-a3966b0fb7ae/57f2357770d009f8.png) |
| Out[9]= | 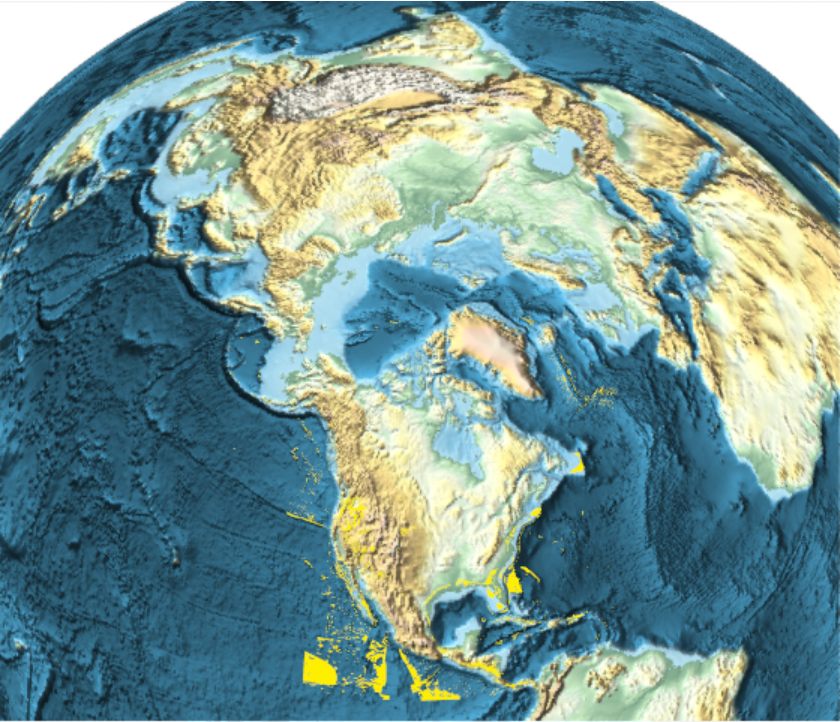 |
Plot the bedrock found throughout the American mid‐west, including a legend:
| In[10]:= | ![ResourceFunction[
"GeologicalPeriodBedrockPlot"][{Entity["GeologicalPeriod", "OrdovicianPeriod"], Entity["GeologicalPeriod", "SilurianPeriod"], Entity["GeologicalPeriod", "DevonianPeriod"], Entity["GeologicalPeriod", "PennsylvanianEpoch"], Entity["GeologicalPeriod", "MississippianEpoch"]}, GeoCenter -> Entity["City", {"Cincinnati", "Ohio", "UnitedStates"}], GeoRange -> Quantity[500, "Miles"], PlotLegends -> True]](https://www.wolframcloud.com/obj/resourcesystem/images/afb/afbc89a0-c4ee-4fa7-b40f-a3966b0fb7ae/38c93c743b9983b2.png) |
| Out[10]= | 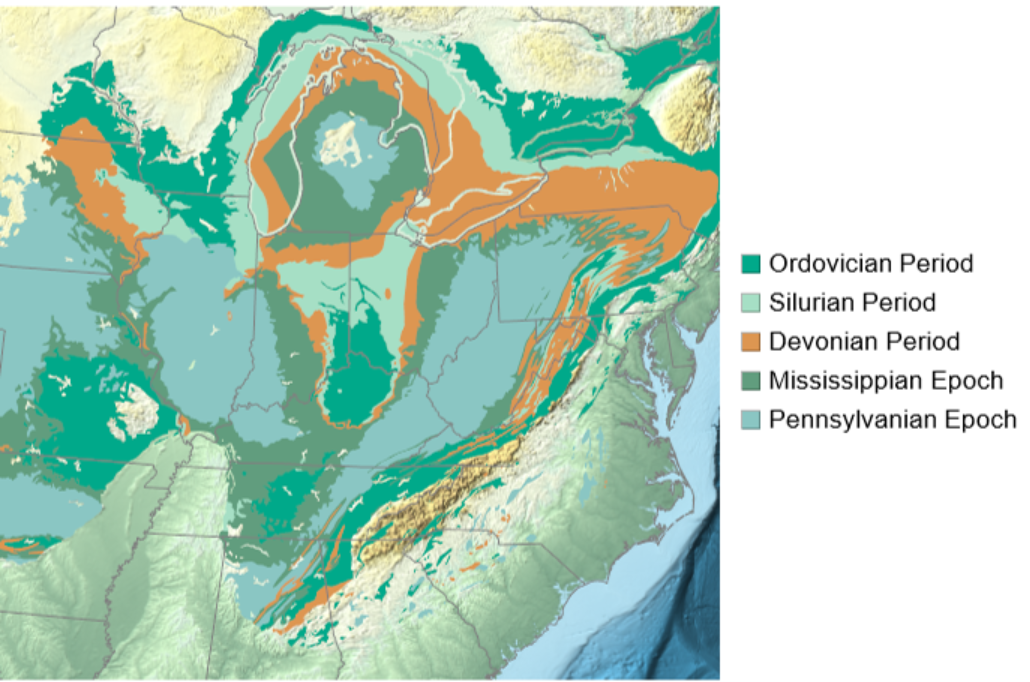 |
This work is licensed under a Creative Commons Attribution 4.0 International License