Examples
Basic Examples (3)
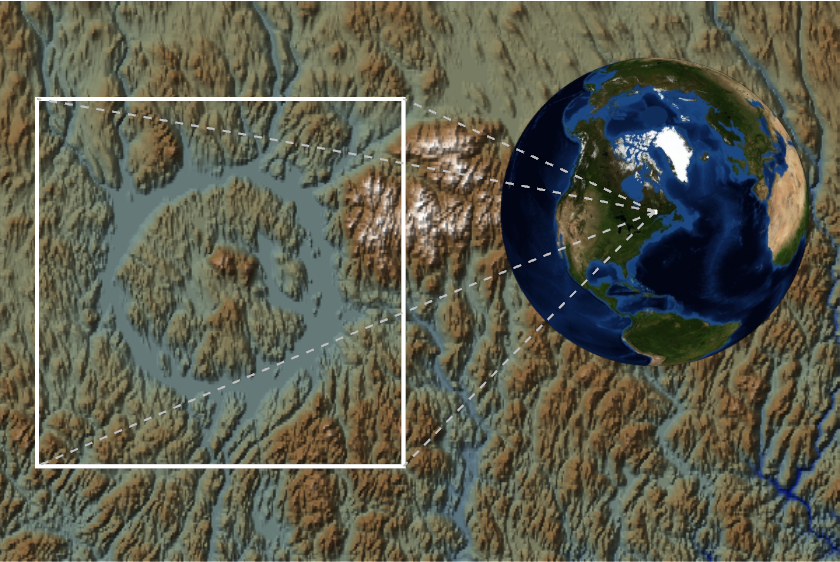
Create an inset map of Manicouagan crater:
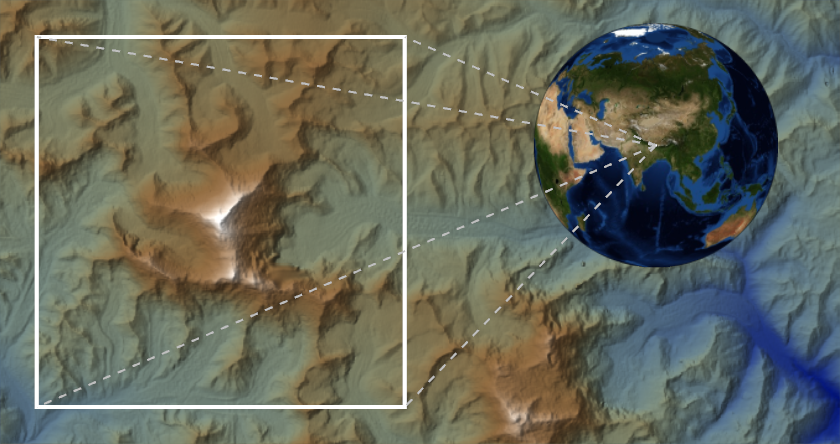
Create an inset map of Mount Everest with a range of 20km:
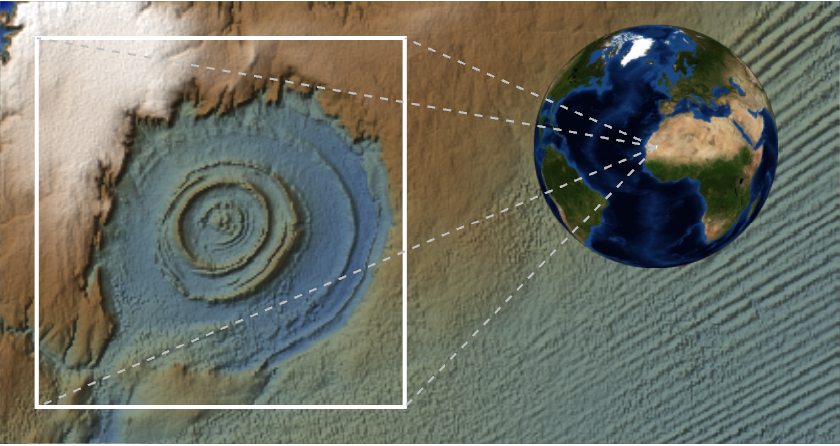
Create an inset map of the Richat Structure in Mauritania:
Options (4)
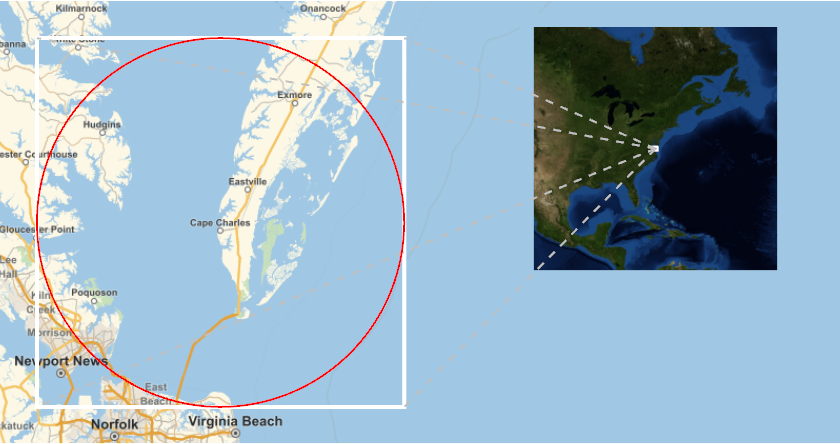
Change the style of the callout lines:
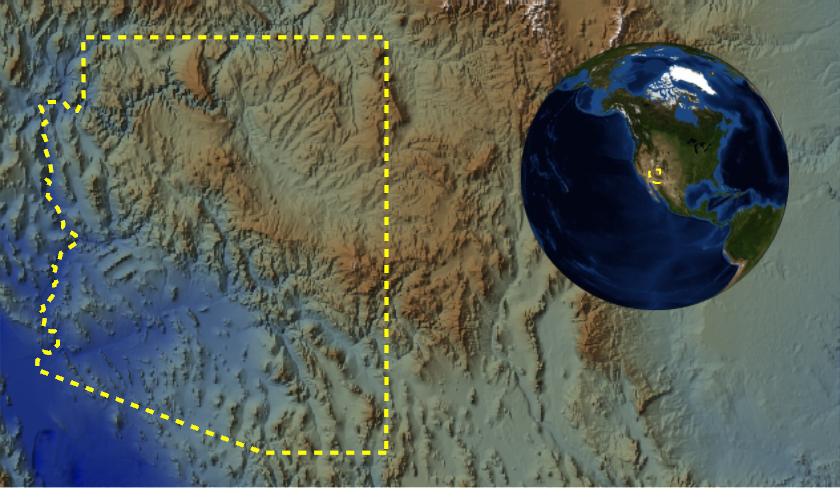
Change the style of the boundary:
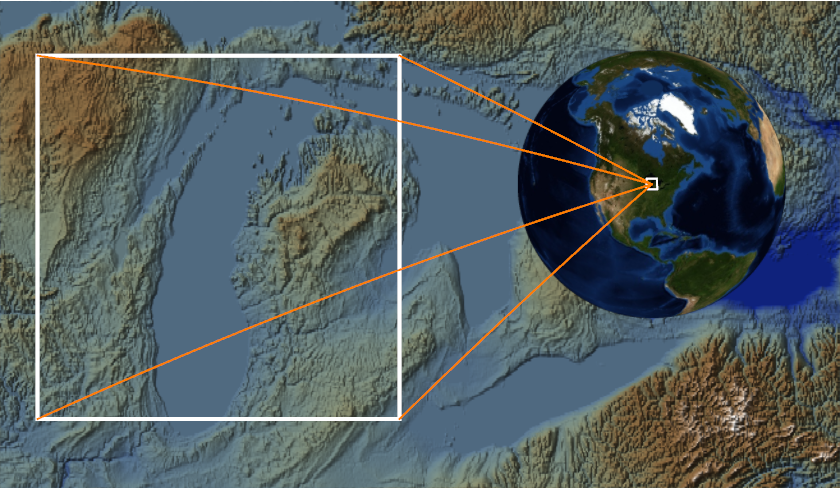
Use "GeoElements" to draw a red circle highlighting the diameter of a crater:
Zoom into the inset map:
Neat Examples (2)
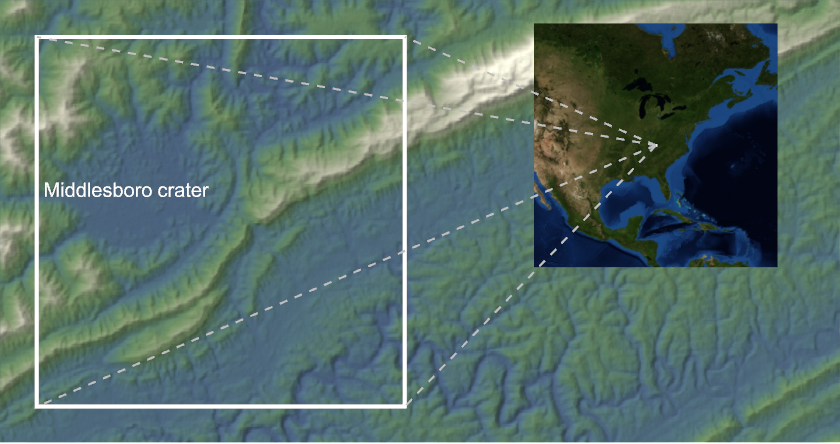
Middlesboro crater is found just northwest of the Cumberland Gap:
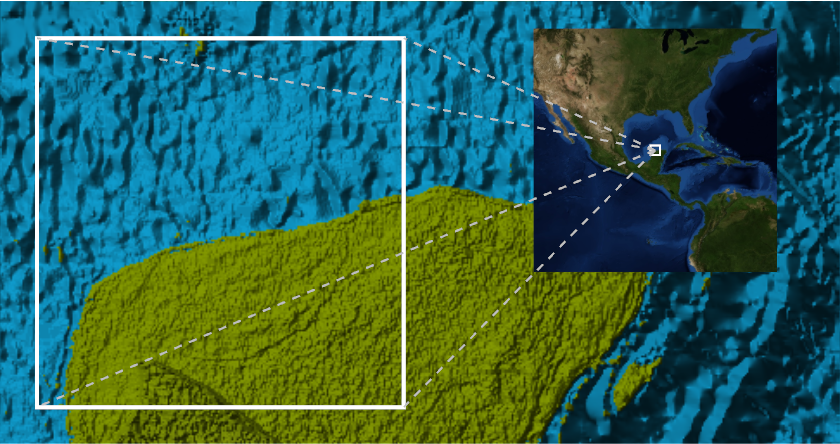
Chicxulub Crater is famous for being the smoking gun for the asteroid impact that helped kill off the dinosaurs:
The default relief map doesn't have enough vertical exaggeration to show any surface evidence of this buried crater and doesn't show sea level.
Define a custom color function that draws a clear boundary between sea level and land:
Adjust box ratios to provide more vertical exaggeration and the range extended:
Subtle curved relief features can now be made out in the lower-right quarter of the white box that show the boundary between crystalline rocks in the crater center and the younger and softer limestone outside of the curved features.
Requirements
Wolfram Language 14.0
(January 2024) or above
Version History
-
1.1.1
– 31 March 2025
-
1.1.0
– 21 March 2025
-
1.0.0
– 18 March 2025
![ResourceFunction["GeoInsetMap"][
Entity["AdministrativeDivision", {"Arizona", "UnitedStates"}], "BoundaryStyle" -> Directive[Dashed, Yellow]]](https://www.wolframcloud.com/obj/resourcesystem/images/1c6/1c698ec0-369c-4945-a9e3-973e8f7e1d76/1-1-0/1eb145a5843a0a59.png)
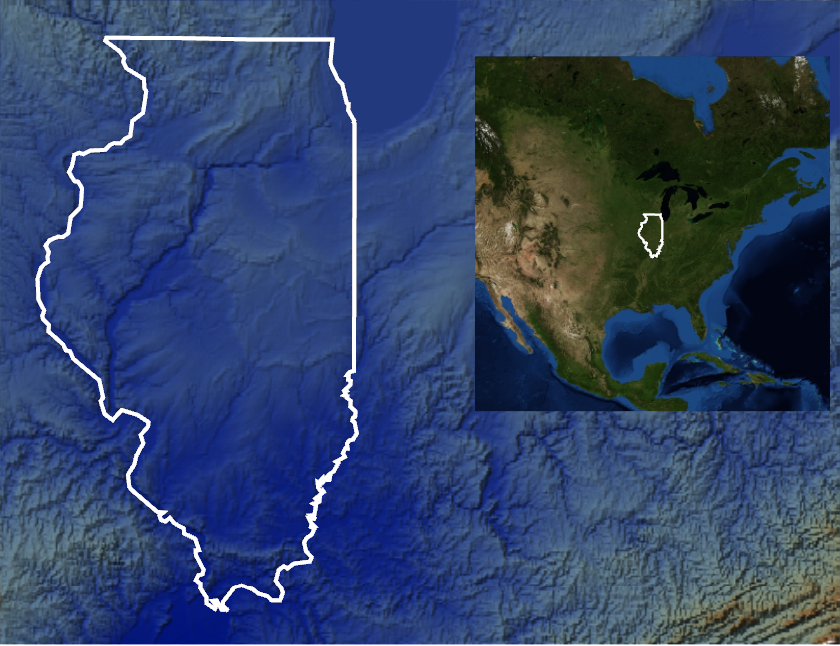
![ResourceFunction["GeoInsetMap", ResourceVersion->"1.1.0"][{Entity["Park", "CumberlandGapNationalHistoricalPark::dv28t"], Quantity[10, "Miles"]},
GeoBackground -> GeoStyling["ReliefMap", ColorFunction -> "AlpineColors", BoxRatios -> {1, 1, .03}], "GeoElements" -> {White, Text["Middlesboro crater", Entity["EarthImpact", "Middlesboro"]]}, "InsetZoom" -> True]](https://www.wolframcloud.com/obj/resourcesystem/images/1c6/1c698ec0-369c-4945-a9e3-973e8f7e1d76/1-1-0/6a9cd4b7baf251e0.png)
![cfun = Function[elevation, Blend[Join[Partition[Riffle[{dataBounds[[1]], 0}, seaColors], 2], Transpose[{Table[
i, {i, 0, dataBounds[[2]], (dataBounds[[2]] - 1)/8}], landColors}]], elevation]];](https://www.wolframcloud.com/obj/resourcesystem/images/1c6/1c698ec0-369c-4945-a9e3-973e8f7e1d76/1-1-0/4b1e9ded23285a1a.png)
![ResourceFunction["GeoInsetMap"][{loc, Quantity[150, "Miles"]}, "InsetZoom" -> True, GeoBackground -> GeoStyling["ReliefMap", ColorFunction -> cfun, ColorFunctionScaling -> False, BoxRatios -> {.1, .1, 1}]]](https://www.wolframcloud.com/obj/resourcesystem/images/1c6/1c698ec0-369c-4945-a9e3-973e8f7e1d76/1-1-0/7957d3a335acff1a.png)