Wolfram Function Repository
Instant-use add-on functions for the Wolfram Language
Function Repository Resource:
Create a graph on a map with communities highlighted with different colors
ResourceFunction["GeoCommunityGraphPlot"][g] generates a geographic plot showing the community structure of the graph g. |
Create a community graph plot of some European cities:
| In[1]:= | ![ResourceFunction["GeoCommunityGraphPlot"][
Graph@{Entity["City", {"Rome", "Lazio", "Italy"}] \[UndirectedEdge] Entity["City", {"Milan", "Lombardy", "Italy"}], Entity["City", {"Milan", "Lombardy", "Italy"}] \[UndirectedEdge] Entity["City", {"Paris", "IleDeFrance", "France"}], Entity["City", {"Milan", "Lombardy", "Italy"}] \[UndirectedEdge] Entity["City", {"Frankfurt", "Hesse", "Germany"}], Entity["City", {"Paris", "IleDeFrance", "France"}] \[UndirectedEdge] Entity["City", {"Frankfurt", "Hesse", "Germany"}], Entity["City", {"Paris", "IleDeFrance", "France"}] \[UndirectedEdge] Entity["City", {"Madrid", "Madrid", "Spain"}], Entity["City", {"Paris", "IleDeFrance", "France"}] \[UndirectedEdge] Entity["City", {"London", "GreaterLondon", "UnitedKingdom"}], Entity["City", {"Madrid", "Madrid", "Spain"}] \[UndirectedEdge] Entity["City", {"Seville", "Seville", "Spain"}], Entity["City", {"Madrid", "Madrid", "Spain"}] \[UndirectedEdge] Entity["City", {"Barcelona", "Barcelona", "Spain"}]}]](https://www.wolframcloud.com/obj/resourcesystem/images/d8f/d8f5a4b2-e2b6-4582-a1be-aff850b6336c/34c39acc5a3370d1.png) |
| Out[1]= | 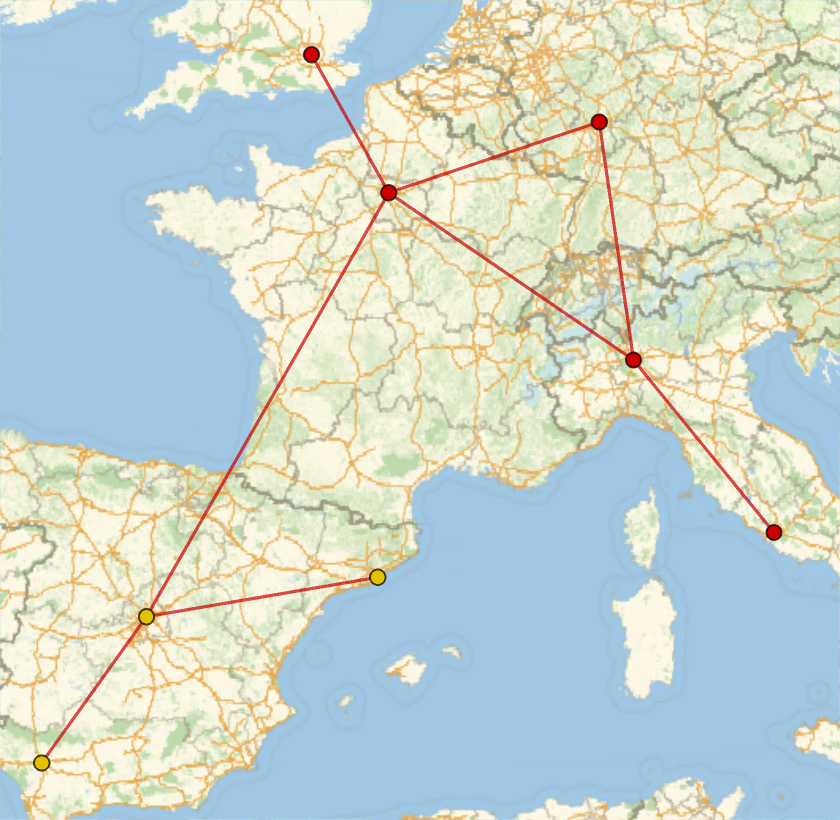 |
Nest the operation of finding bordering countries for a country to create a graph of bordering countries in Europe, Africa, and Asia:
| In[2]:= | ![\[ScriptCapitalE] = UndirectedGraph[
NestGraph[CountryData[#, "BorderingCountries"] &, Entity["Country", "France"], 12]];](https://www.wolframcloud.com/obj/resourcesystem/images/d8f/d8f5a4b2-e2b6-4582-a1be-aff850b6336c/14a59293a5971139.png) |
Plot the graph on a map:
| In[3]:= |
| Out[3]= | 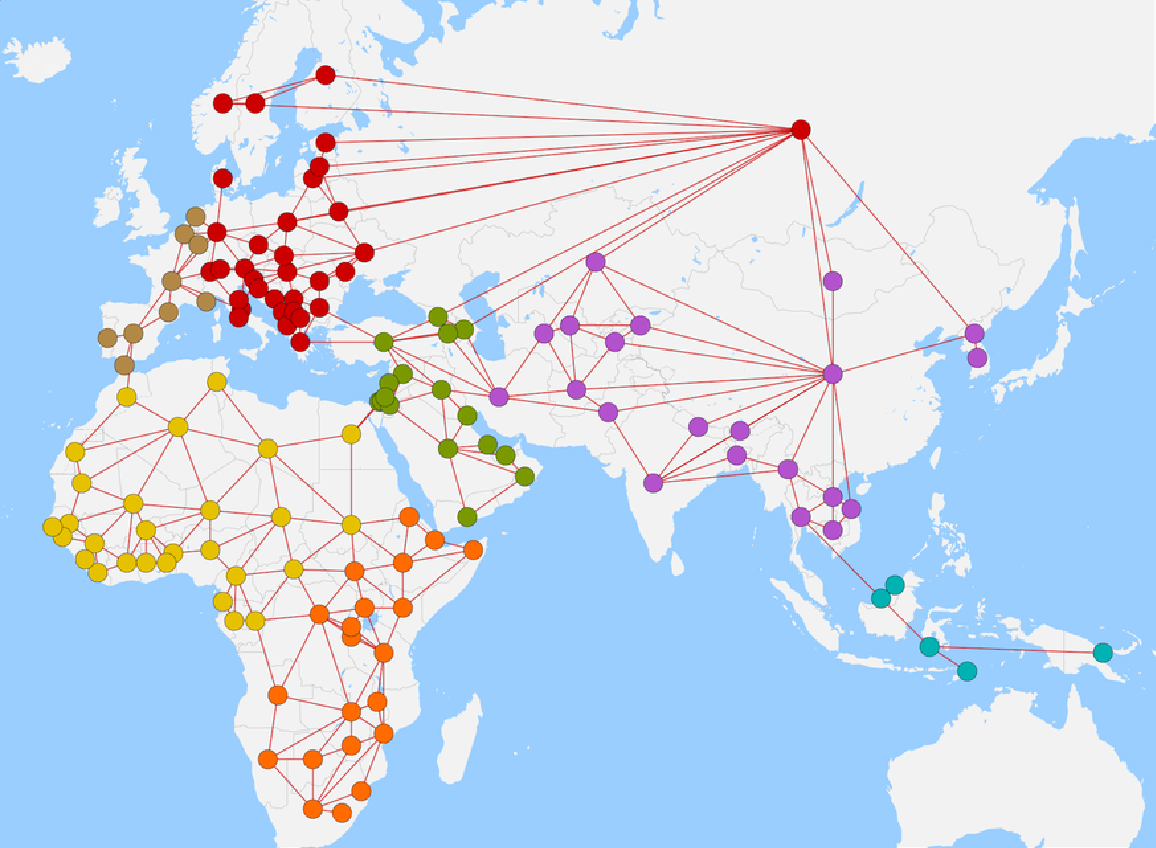 |
Visualize a graph of the 49 administrative divisions of the continental states including the District of Columbia:
| In[4]:= | ![\[ScriptCapitalE] = UndirectedGraph[
NestGraph[AdministrativeDivisionData[#, "BorderingStates"] &, Entity["AdministrativeDivision", {"WestVirginia", "UnitedStates"}], 20]];](https://www.wolframcloud.com/obj/resourcesystem/images/d8f/d8f5a4b2-e2b6-4582-a1be-aff850b6336c/1c9e777e9c6c40de.png) |
| In[5]:= |
| Out[5]= | 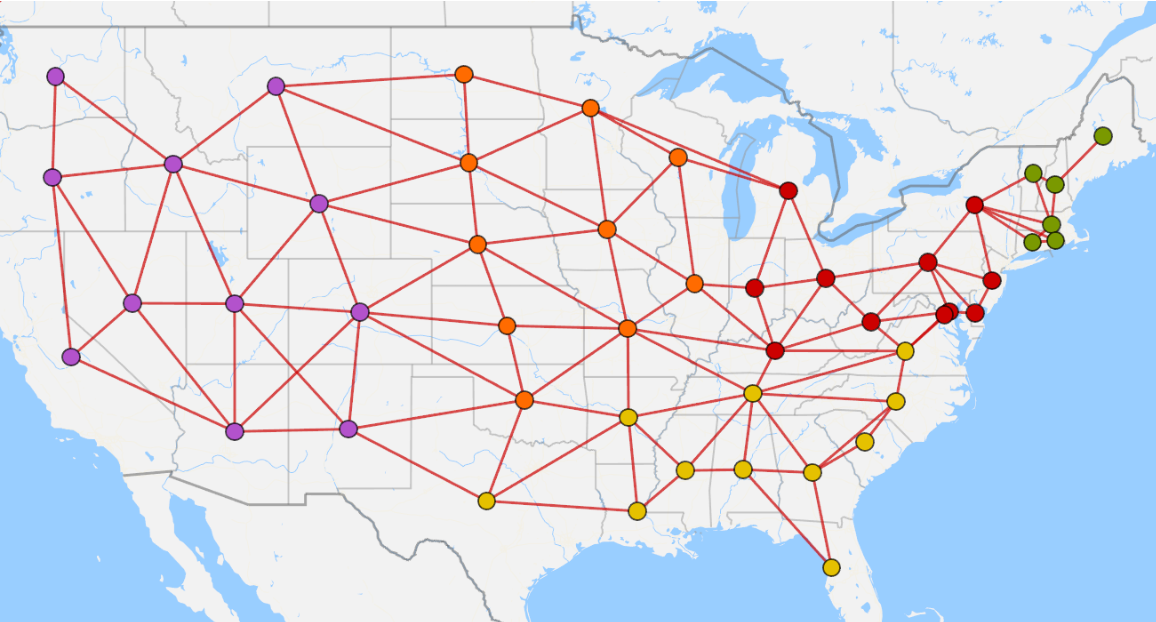 |
This work is licensed under a Creative Commons Attribution 4.0 International License