Function Repository Resource:

FrostbiteTime

Source Notebook

Compute the time at which skin or other tissues freeze when exposed to low temperatures

Contributed by: Claudio Lobo Chaib Filho

ResourceFunction["FrostbiteTime"][{t,ws}]

gives the frostbite time for a temperature t and wind speed ws.

ResourceFunction["FrostbiteTime"][{t,ws},prop]

gives the property prop as a result.

Details and Options

ResourceFunction["FrostbiteTime"] gives the time when skin or other tissues freeze when exposed to low temperatures.
The temperature t unit can be any unit of temperature. When not specified with Quantity, the temperature unit is interpreted as degrees Celsius.
The wind speed ws can be any unit of speed. When not specified with Quantity, the wind speed unit is interpreted as kilometers per hour.
The temperature and wind speed values allowed by the function (based on the NOAA model) are those between -48.331 and -5 (degrees Celsius) for temperature, and between 24.137 and 120.68 (kilometers per hours) for wind speed.
The property prop can be any of the following:
"Time"time until frostbite occurs (default)
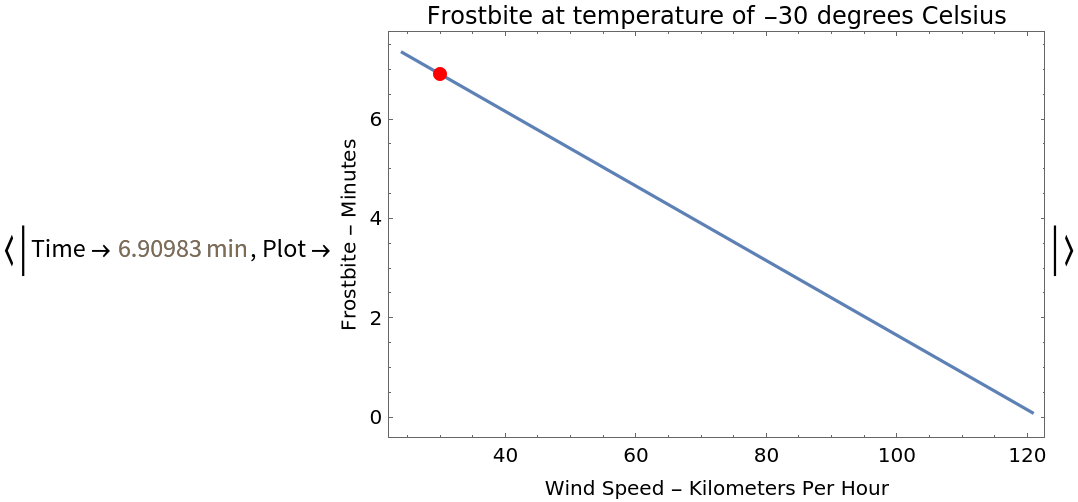
"Plot"plot of wind speed and frostbite time for a specific temperature
"PropertyAssociation"Association of "Time" and "Plot" properties
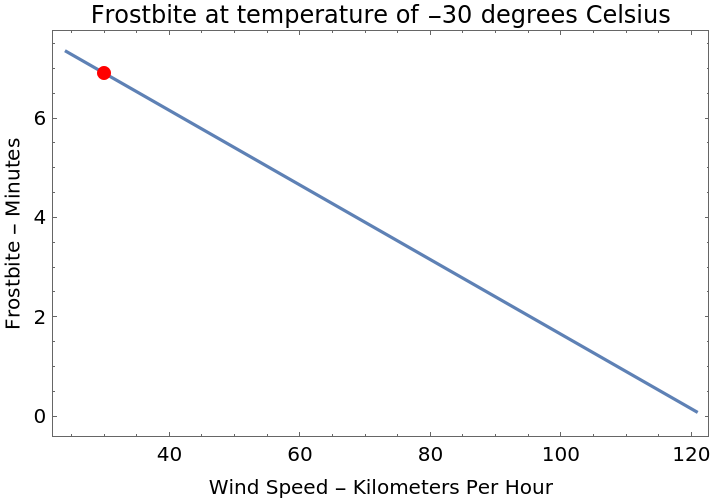
ResourceFunction["FrostbiteTime"][{t,ws},"Plot"] gives a curve where the x-axis is the wind speed (in kilometers per hour) and the y-axis is the frostbite time for a given temperature (in the temperature unit that comes from the input).
ResourceFunction["FrostbiteTime"][{t,ws},"TimeUnit"unit] gives the output in the specified unit. The unit can be any time unit.
Examples

Basic Examples (1) 

Get the frostbite time for a specific temperature and wind speed:

In[1]:=
ResourceFunction[
 "FrostbiteTime"][{Quantity[-30, "DegreesCelsius"], Quantity[30, ("Kilometers")/("Hours")]}]
Out[1]=

Scope (5) 

Any temperature unit can be used:

In[2]:=
ResourceFunction[
 "FrostbiteTime"][{Quantity[-30, "DegreesFahrenheit"], Quantity[30, ("Miles")/("Hours")]}]
Out[2]=

If the values are not specified using Quantity, the function interprets them as degrees Celsius and kilometers per hour:

In[3]:=
ResourceFunction["FrostbiteTime"][{-30, 30}]
Out[3]=

Create a plot of frostbite time versus wind speed:

In[4]:=
ResourceFunction[
 "FrostbiteTime"][{Quantity[-30, "DegreesCelsius"], Quantity[30, ("Kilometers")/("Hours")]}, "Plot"]
Out[4]=

Get an Association with "Time" and "Plot" using "PropertyAssociation":

In[5]:=
ResourceFunction[
 "FrostbiteTime"][{Quantity[-30, "DegreesCelsius"], Quantity[30, ("Kilometers")/("Hours")]}, "PropertyAssociation"]
Out[5]=

The default property is "Time":

In[6]:=
ResourceFunction[
 "FrostbiteTime"][{Quantity[-30, "DegreesCelsius"], Quantity[30, ("Kilometers")/("Hours")]}, "Time"]
Out[6]=

Options (2) 

The "TimeUnit" option directly gives the desired time unit in the frostbite response:

In[7]:=
ResourceFunction[
 "FrostbiteTime"][{Quantity[-30, "DegreesCelsius"], Quantity[30, ("Kilometers")/("Hours")]}, "TimeUnit" -> "Seconds"]
Out[7]=

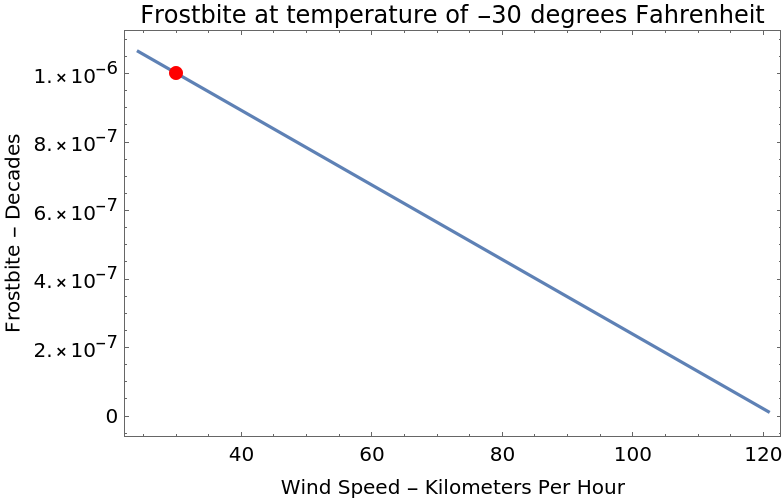
With the "TimeUnit" option, the plot uses the specified unit that can be any unit of time. Also, notice that the plot follows the input temperature unit:

In[8]:=
ResourceFunction[
 "FrostbiteTime"][{Quantity[-30, "DegreesFahrenheit"], Quantity[30, ("Kilometers")/("Hours")]}, "Plot", "TimeUnit" -> "Decades"]
Out[8]=

Possible Issues (1) 

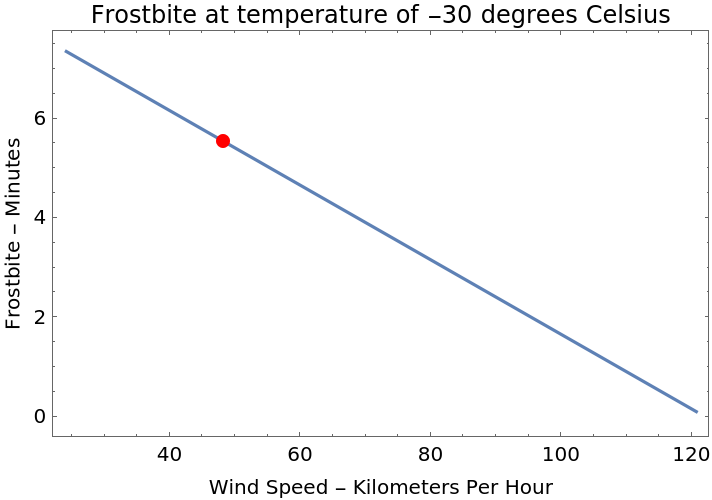
Even if the unit of wind speed is in miles per hour, the plot will always show kilometers per hour on the x-axis:

In[9]:=
ResourceFunction[
 "FrostbiteTime"][{Quantity[-30, "DegreesCelsius"], Quantity[30, ("Miles")/("Hours")]}, "Plot"]
Out[9]=

Publisher

Claudio Lobo Chaib Filho

Version History

  • 1.0.0 – 30 October 2020

Source Metadata

Related Resources

License Information