Examples
Basic Examples (3)
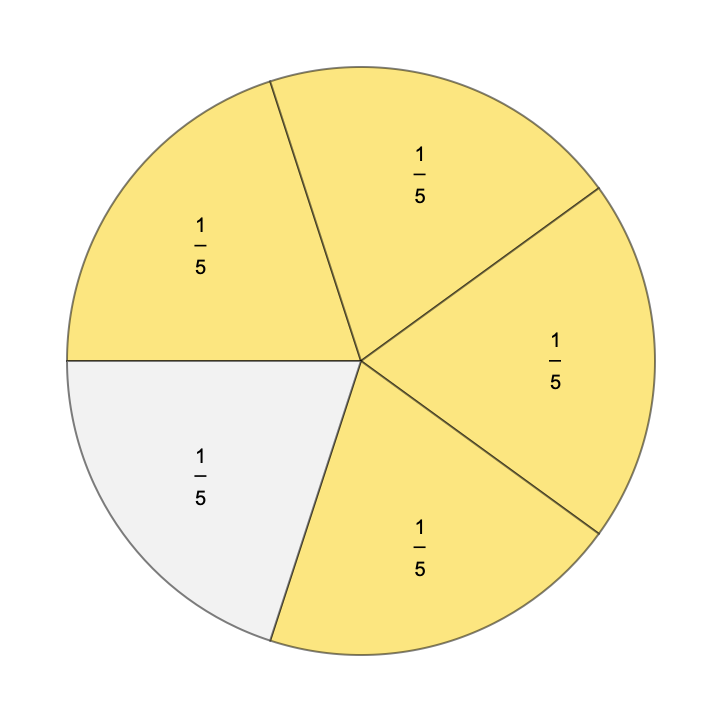
Get a pie chart representing the fraction 4/5:
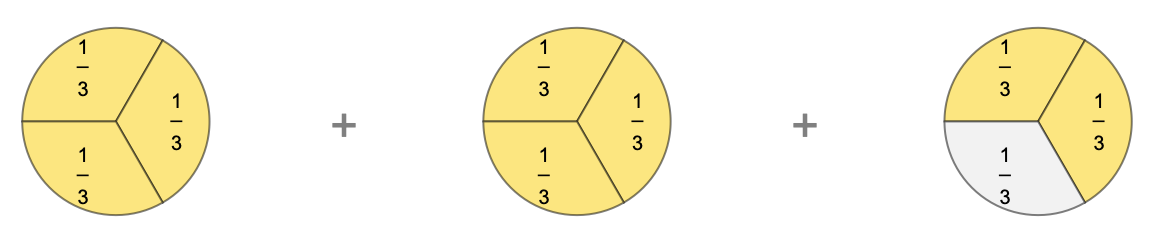
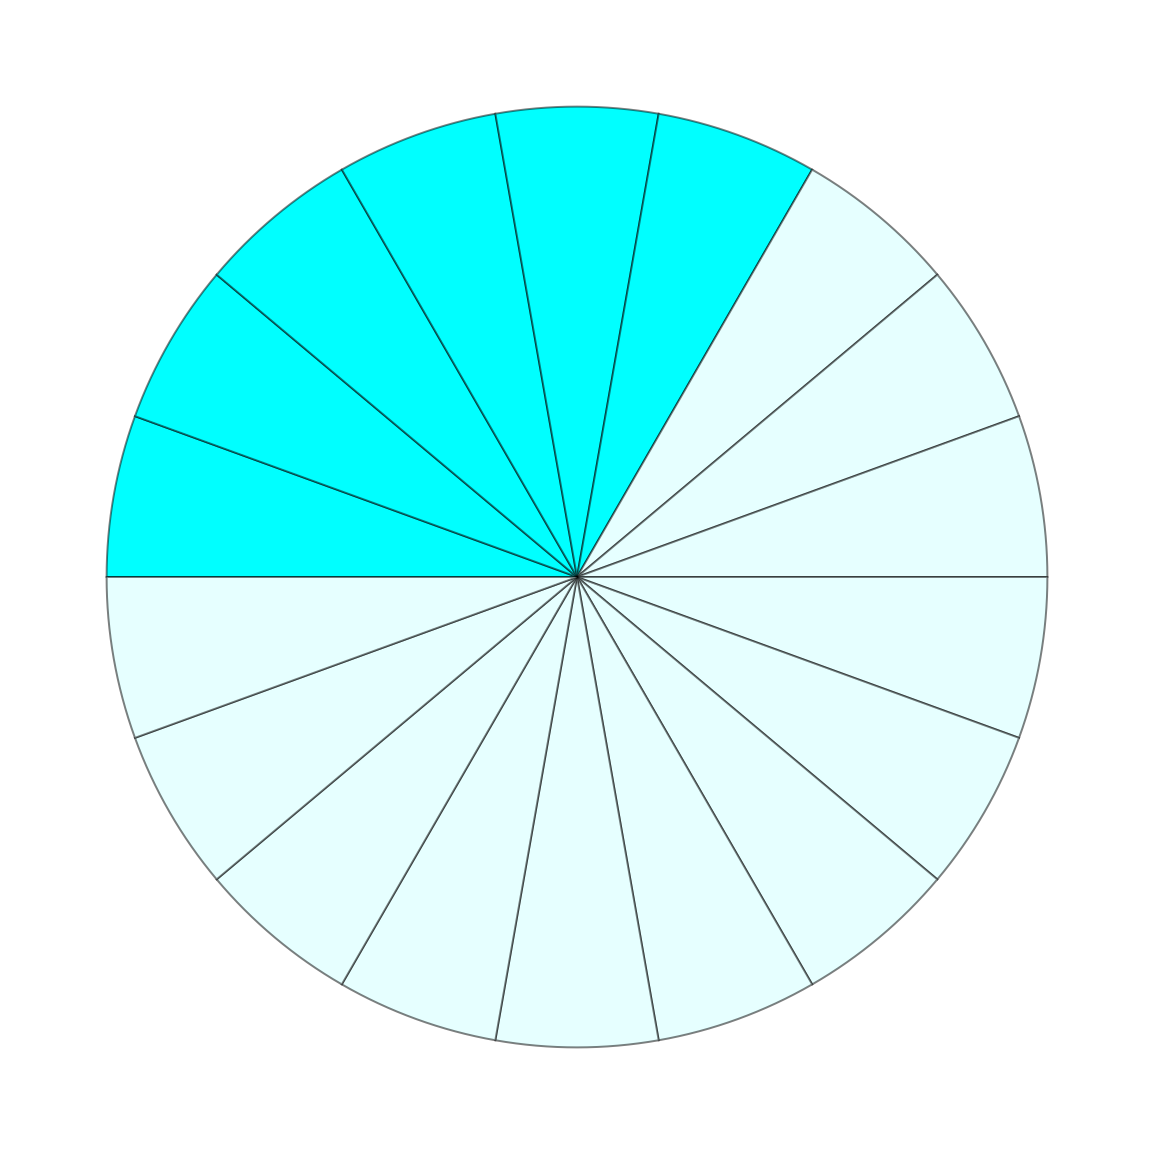
Get a row of pie charts representing the fraction 8/3:
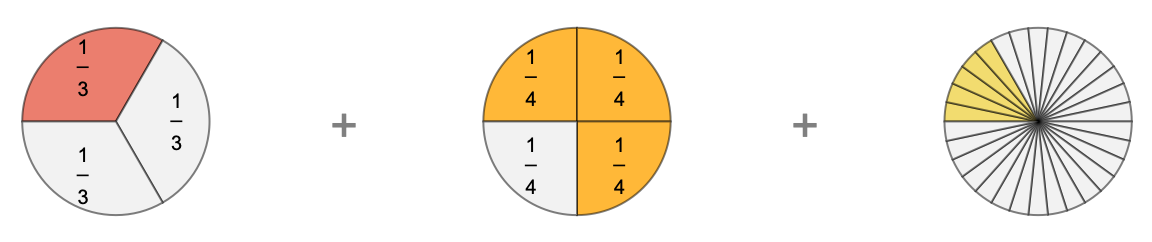
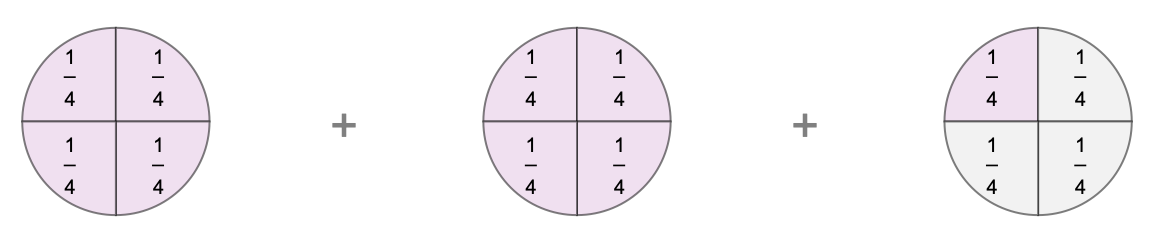
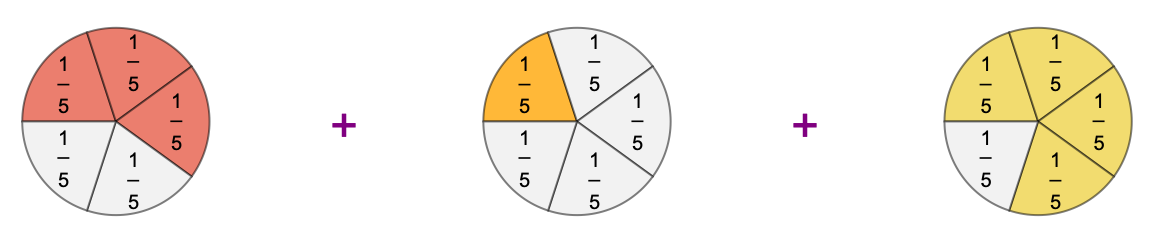
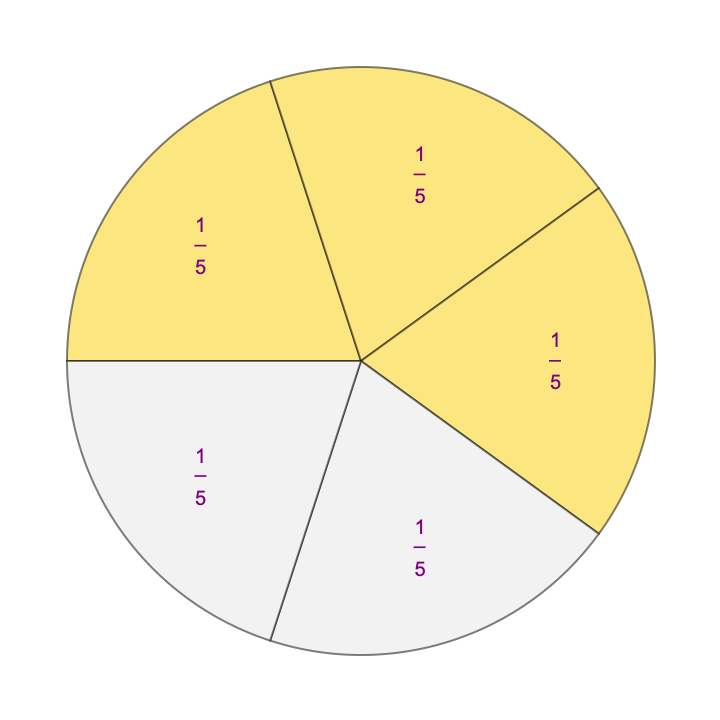
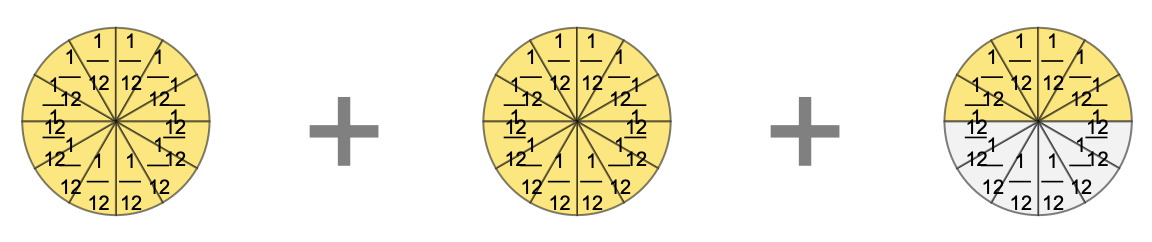
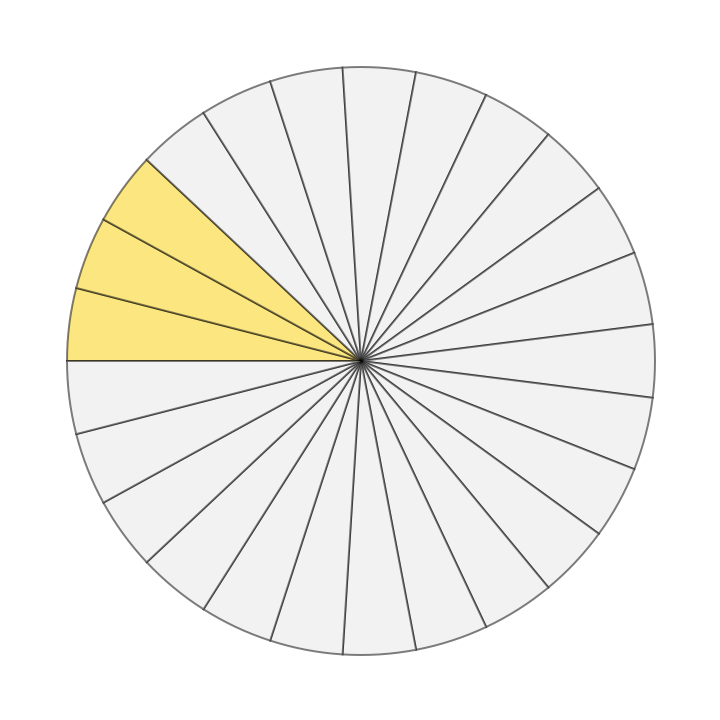
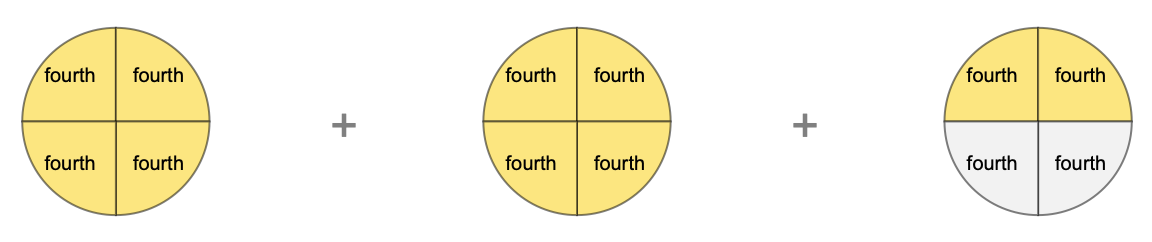
Get a row of pie charts representing the addition 1/3 + 3/4 + 5/30:
Scope (1)
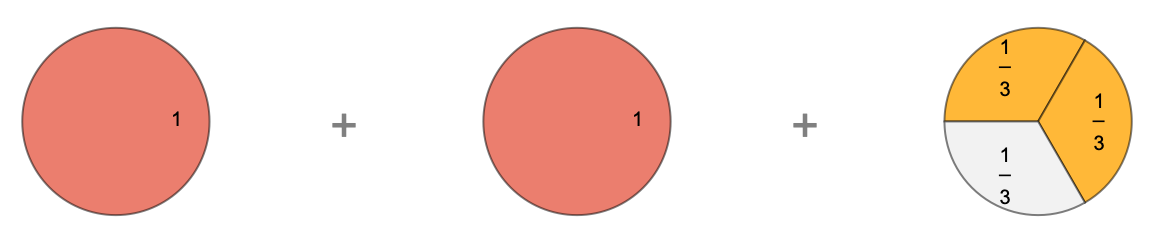
Use FractionPieChart to visually compare the mixed number and improper fraction forms of a number:
Options (11)
FillingStyle (2)
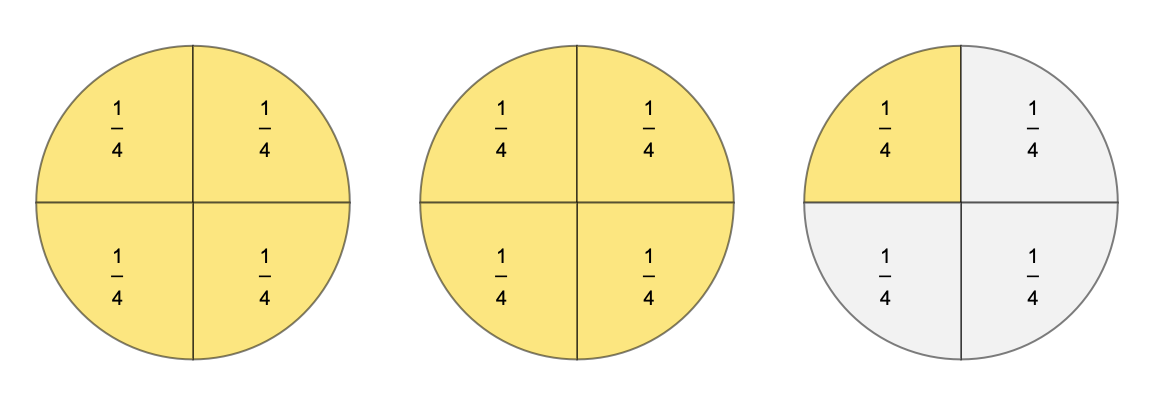
Use the FillingStyle option to set the color of the filled sections of the pie charts:
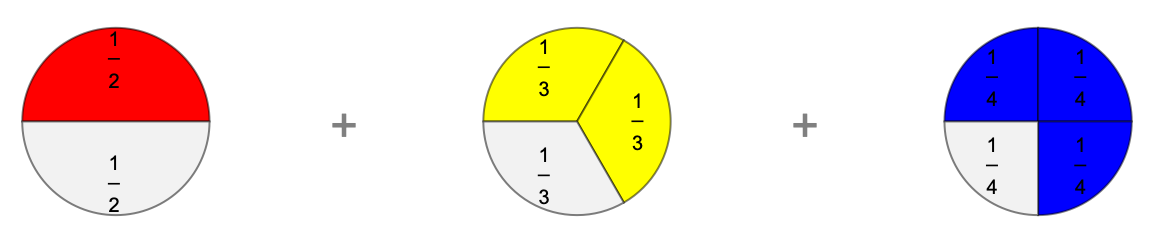
For addition of multiple fractions, FillingStyle can be a list of colors:
PieColor (1)
Use the "PieColor" option to set the color of the unfilled sections of the pie charts:
ShowAddition (2)
Set the "ShowAddition" to False to hide the plus signs between multiple pie charts:
For large numbers of pie charts, the plus signs are automatically hidden. Set the "ShowAddition" option to True to force addition symbols:
FontColor (2)
Use the FontColor option to set the color of the plus signs between pie charts:
To change the color of the labels font, use the LabelStyle option:
PlusFontSize (1)
Use the "PlusFontSize" option to set the size of the plus signs between pie charts:
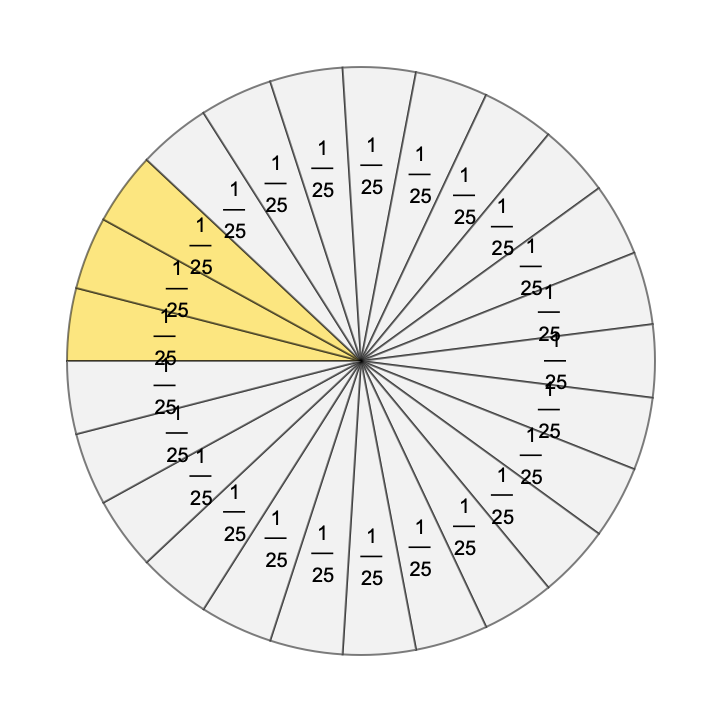
UnitLabels (3)
Unit labels are automatically hidden for small sectors:
Force showing unit labels by setting the "UnitLabels" option to True:
Customize the unit labels via the "UnitLabels" option:
Publisher
Wolfram|Alpha Math Team
Version History
-
2.0.0
– 23 March 2023
-
1.0.0
– 28 March 2022
Related Resources
Author Notes
To view the full source code for FractionPieChart, evaluate the following: