Wolfram Function Repository
Instant-use add-on functions for the Wolfram Language
Function Repository Resource:
Visualize fractions and mixed numbers using pie charts
ResourceFunction["FractionPieChart"][n/d] creates a pie chart or row of pie charts representing the fraction n/d. | |
ResourceFunction["FractionPieChart"][n] creates a pie chart or row of pie charts representing the integer n. | |
ResourceFunction["FractionPieChart"][n1/d1 + n2/d2 + …] creates a row of pie charts representing the addition of the fractions n1/d1,n2/d2,…. |
| FillingStyle | sets the color for the filled parts of the pie charts | |
| "PieColor" | sets the color for the unfilled parts of the pie charts | |
| "ShowAddition" | Automatic | determines whether to show plus signs between pie charts |
| FontColor | sets the color of the plus signs between pie charts | |
| “PlusFontSize" | Automatic | sets the size of the plus signs between pie charts |
| "UnitLabels" | Automatic | sets the text of the label displayed in the sections of the pie charts |
Get a pie chart representing the fraction 4/5:
| In[1]:= |
| Out[1]= | 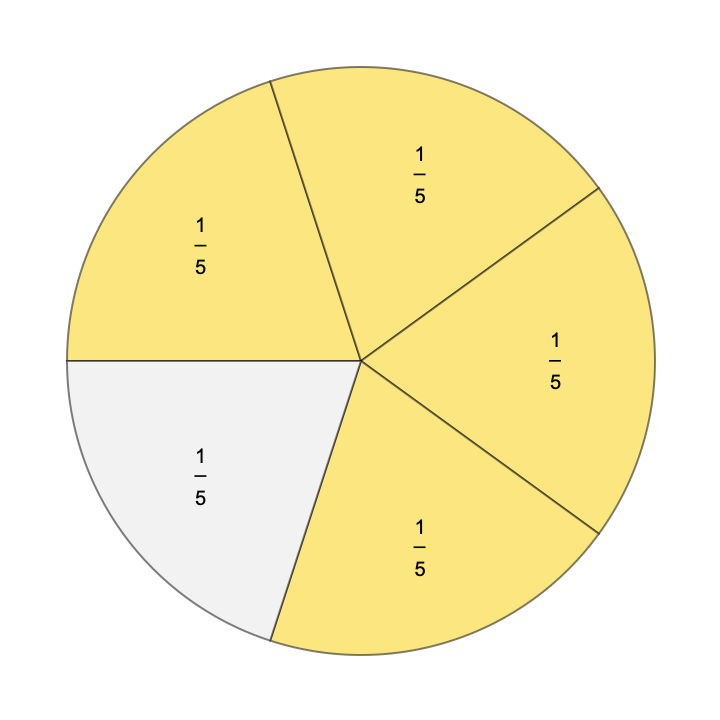 |
Get a row of pie charts representing the fraction 8/3:
| In[2]:= |
| Out[2]= |  |
Get a row of pie charts representing the addition 1/3 + 3/4 + 5/30:
| In[3]:= |
| Out[3]= | 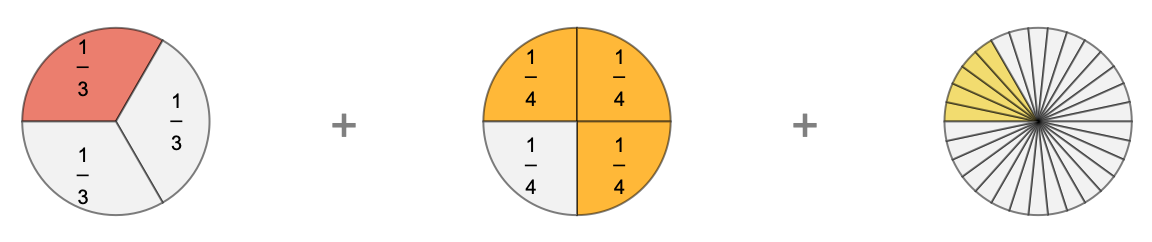 |
Use FractionPieChart to visually compare the mixed number and improper fraction forms of a number:
| In[4]:= |
| Out[4]= | 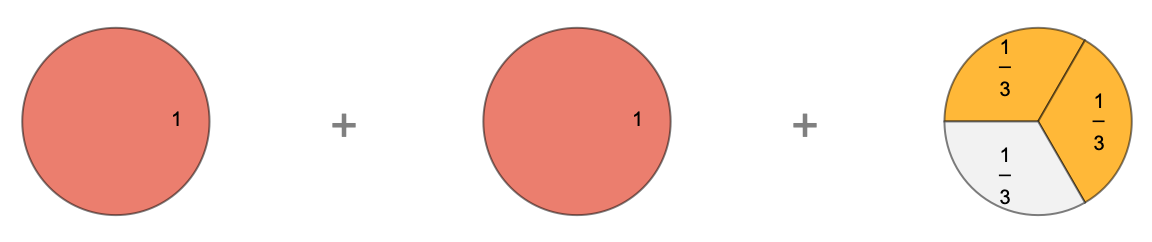 |
| In[5]:= |
| Out[5]= | 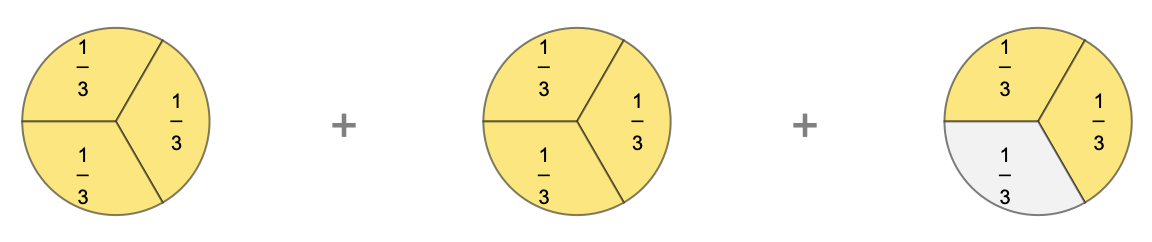 |
Use the FillingStyle option to set the color of the filled sections of the pie charts:
| In[6]:= |
| Out[6]= | 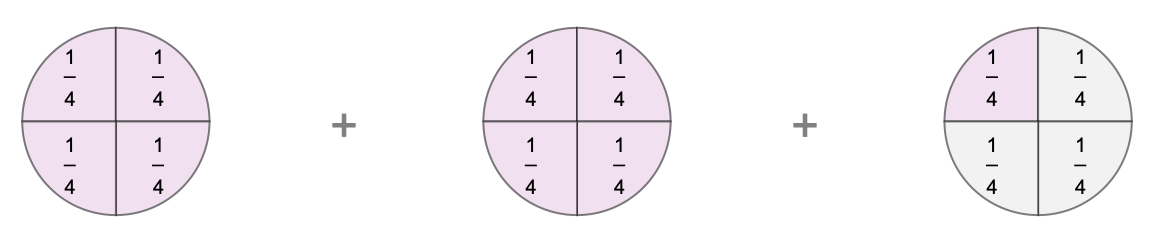 |
For addition of multiple fractions, FillingStyle can be a list of colors:
| In[7]:= |
| Out[7]= | 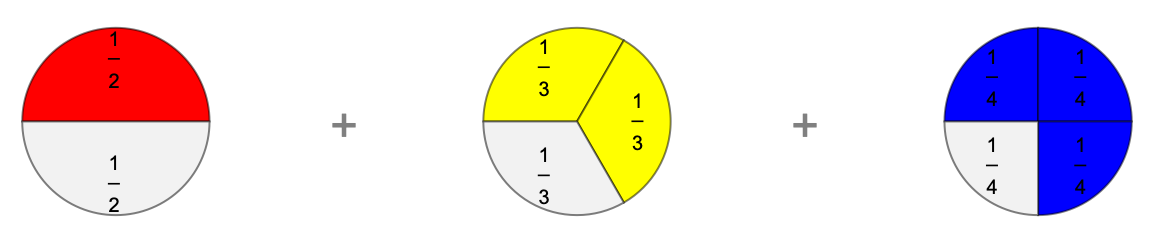 |
Use the "PieColor" option to set the color of the unfilled sections of the pie charts:
| In[8]:= |
| Out[8]= | 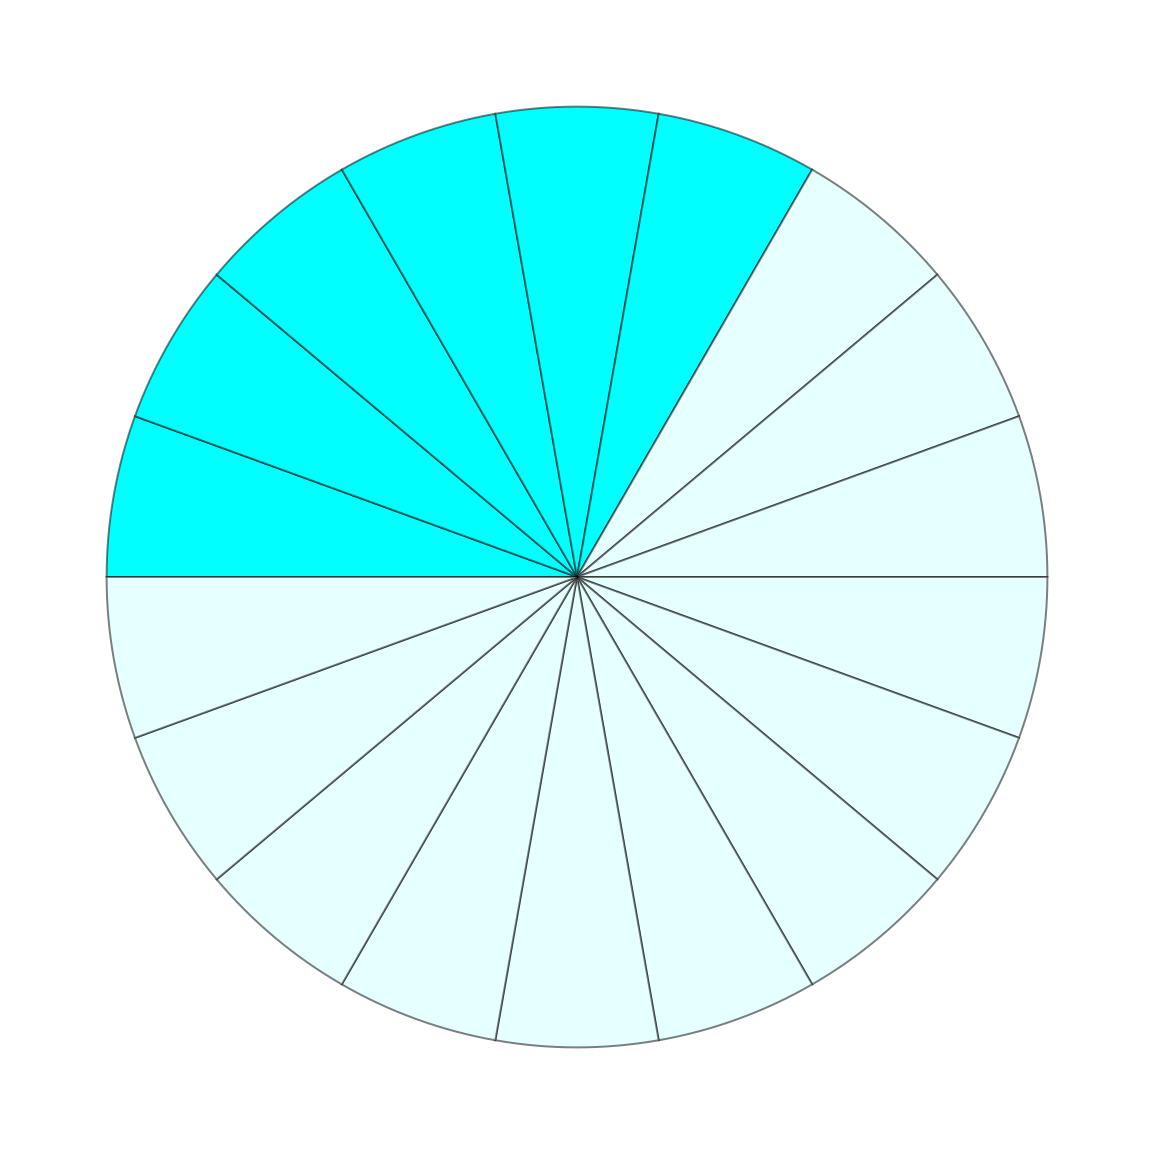 |
Set the "ShowAddition" to False to hide the plus signs between multiple pie charts:
| In[9]:= |
| Out[9]= | 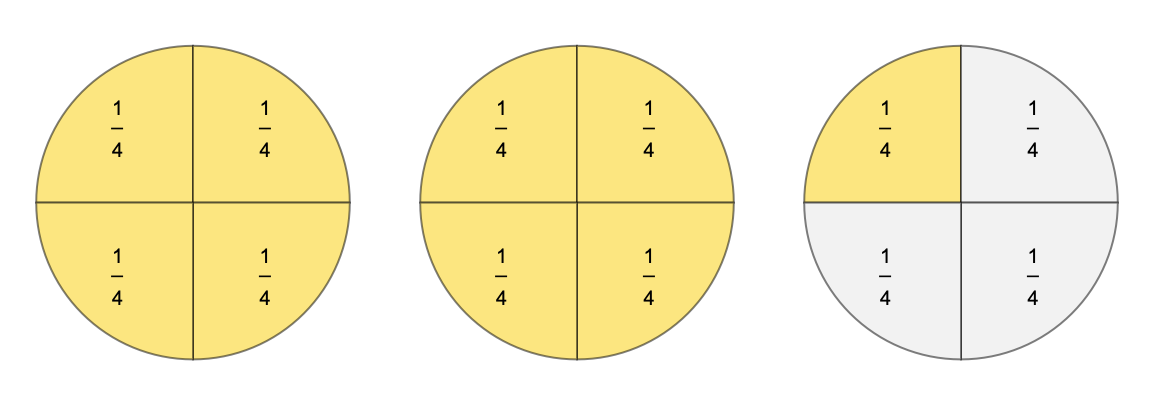 |
For large numbers of pie charts, the plus signs are automatically hidden. Set the "ShowAddition" option to True to force addition symbols:
| In[10]:= |
| Out[10]= |
Use the FontColor option to set the color of the plus signs between pie charts:
| In[11]:= |
| Out[11]= | 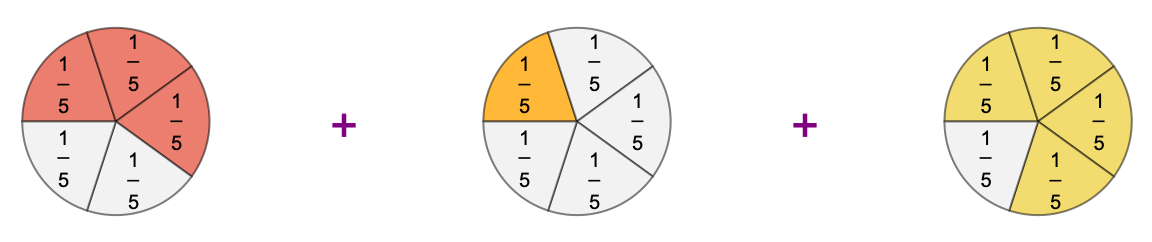 |
To change the color of the labels font, use the LabelStyle option:
| In[12]:= |
| Out[12]= | 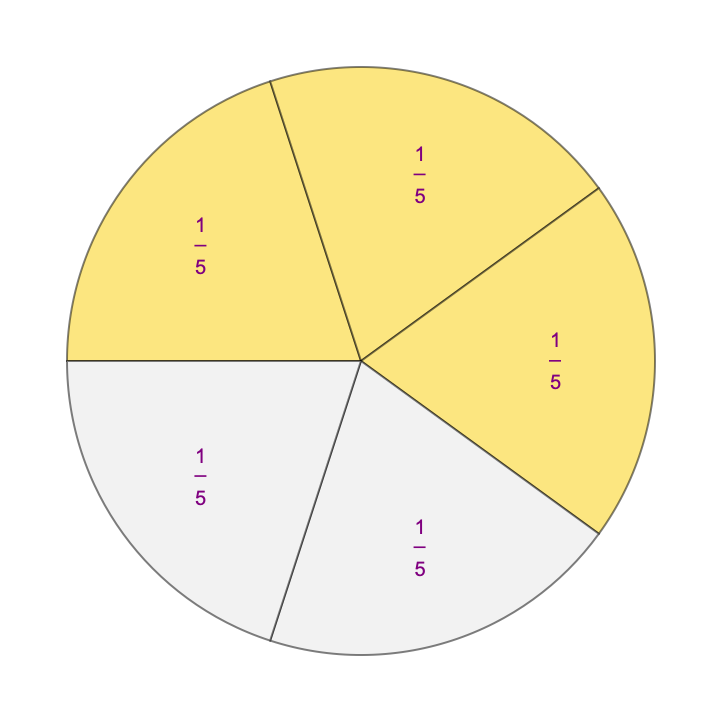 |
Use the "PlusFontSize" option to set the size of the plus signs between pie charts:
| In[13]:= |
| Out[13]= | 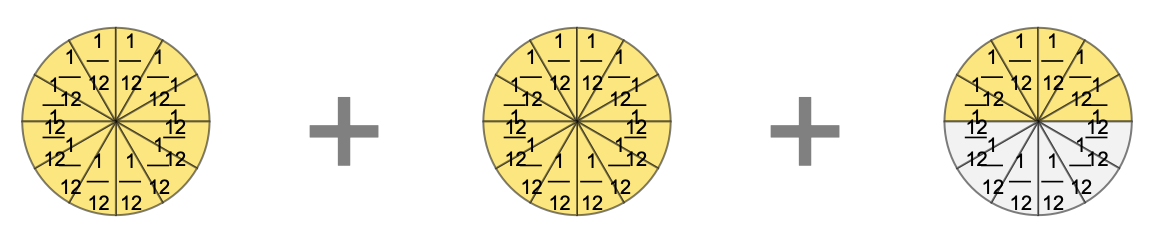 |
Unit labels are automatically hidden for small sectors:
| In[14]:= |
| Out[14]= | 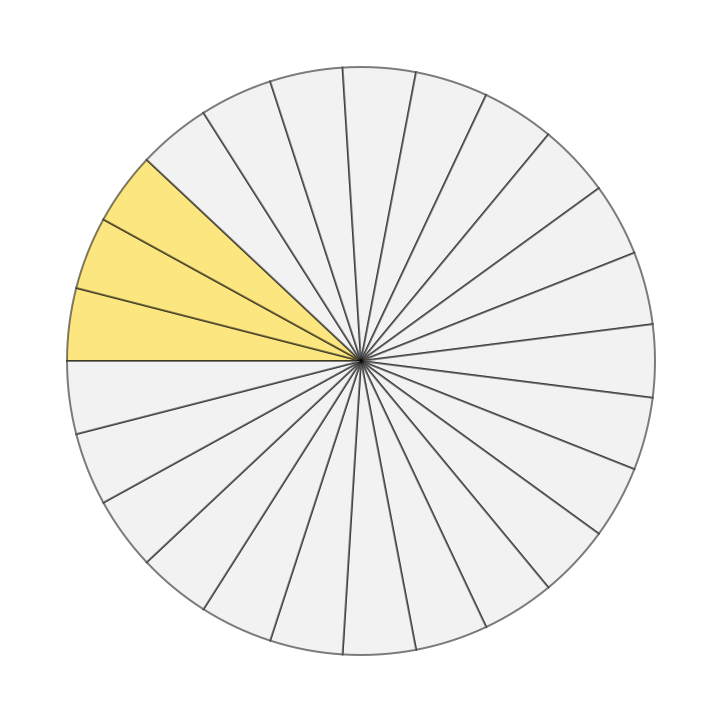 |
Force showing unit labels by setting the "UnitLabels" option to True:
| In[15]:= |
| Out[15]= | 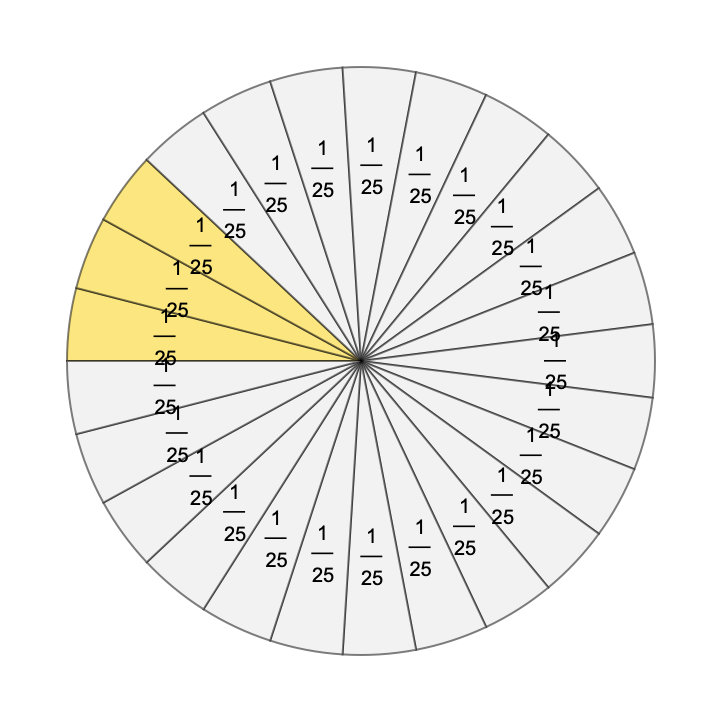 |
Customize the unit labels via the "UnitLabels" option:
| In[16]:= |
| Out[16]= | 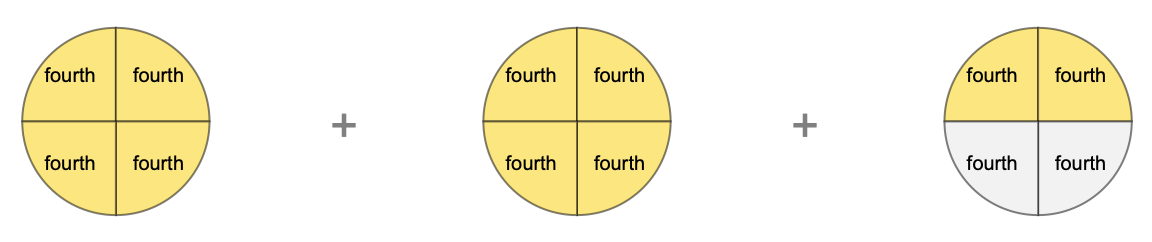 |
To view the full source code for FractionPieChart, evaluate the following:
| In[1]:= |
This work is licensed under a Creative Commons Attribution 4.0 International License