Wolfram Function Repository
Instant-use add-on functions for the Wolfram Language
Function Repository Resource:
Visualize data as a flame chart
ResourceFunction["FlameChart"][d] generates an interactive flame chart of the nested data d. |
Create a flame chart of nested profiler data:
| In[1]:= | ![ResourceFunction[
"FlameChart"][{fun1, 0.5, {{fun2, 0.1, {}}, {fun3, 0.3, {{fun4, 0.2, {{fun5, 0.05, {}}, {fun6, 0.05, {{fun7, 0.04, {}}}}}}}}}}]](https://www.wolframcloud.com/obj/resourcesystem/images/d5b/d5b6f86d-7343-4b88-bbd3-6509a4f25a72/69e44fe27cf97f59.png) |
| Out[1]= | 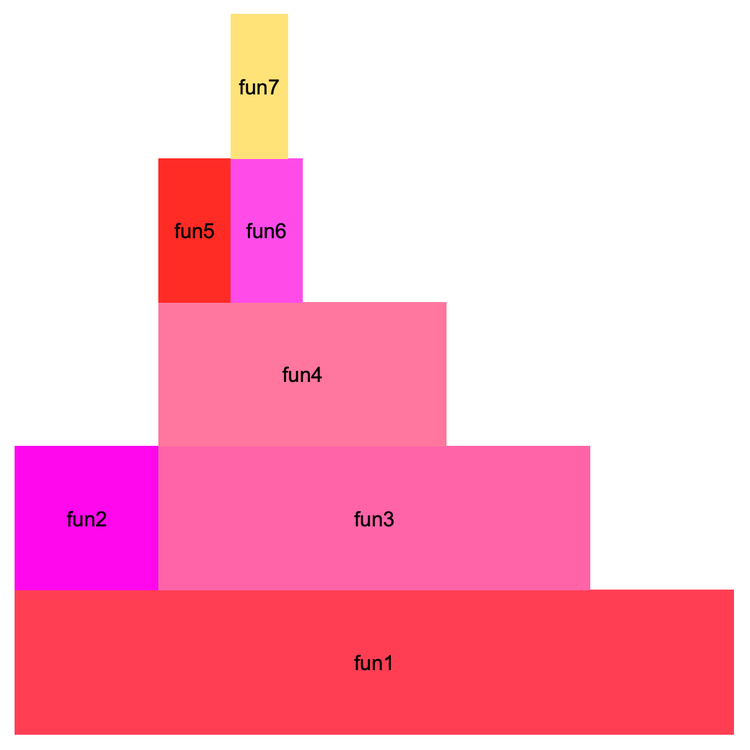 |
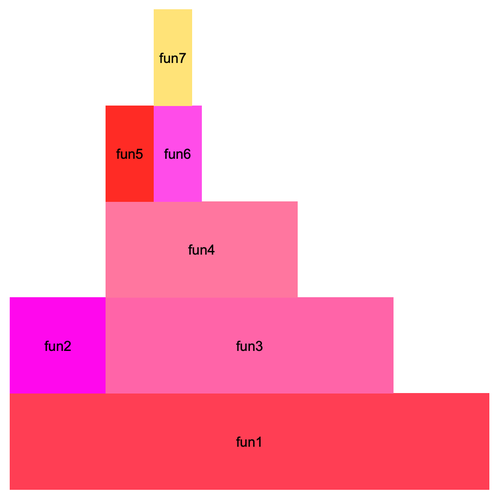
Click a frame, for instance fun3, to show only its stack:
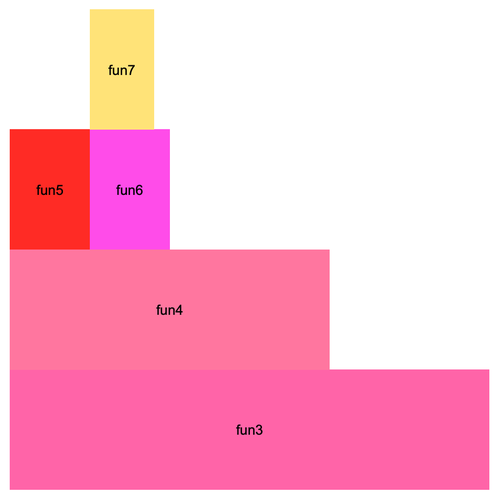
![]() any frame to reset the chart:
any frame to reset the chart:
Frames are sorted at each level in the canonical order of their labels:
| In[2]:= | ![ResourceFunction[
"FlameChart"][{fun1, 0.3, {{fun3, 0.1, {{fun32, 0.05, {}}, {fun31, 0.025, {}}}}, {fun2, 0.1, {{fun5b, .04, {}}, {fun5a, .04, {}}}}}}]](https://www.wolframcloud.com/obj/resourcesystem/images/d5b/d5b6f86d-7343-4b88-bbd3-6509a4f25a72/18454dd1f2c29d32.png) |
| Out[2]= | 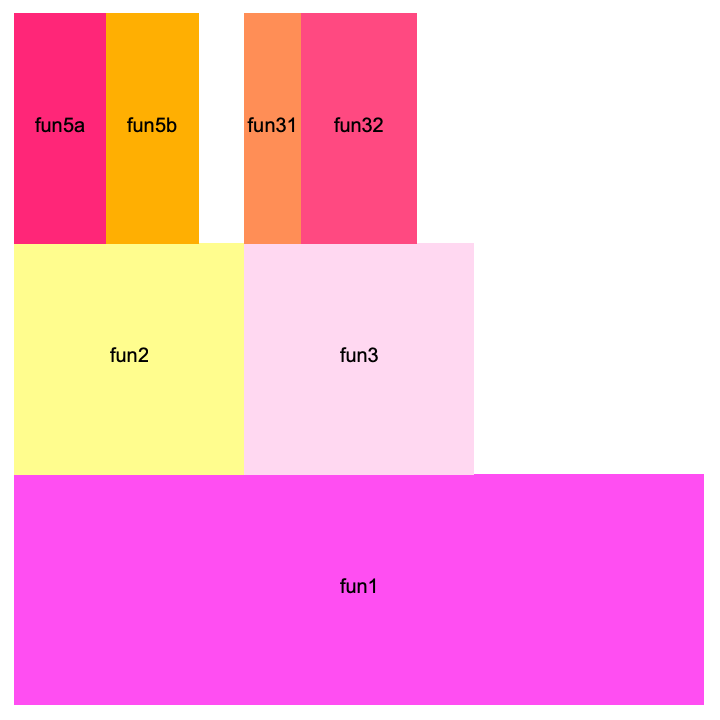 |
Frames corresponding to the same label are merged:
| In[3]:= | ![ResourceFunction[
"FlameChart"][{fun1, 0.3, {{fun3, 0.1, {{fun2, 0.025, {}}, {fun1, 0.025, {}}, {fun2, 0.025, {}}}}, {fun2, 0.1, {}}, {fun3, 0.1, {}}}}]](https://www.wolframcloud.com/obj/resourcesystem/images/d5b/d5b6f86d-7343-4b88-bbd3-6509a4f25a72/43315a4c4d04d6da.png) |
| Out[3]= | 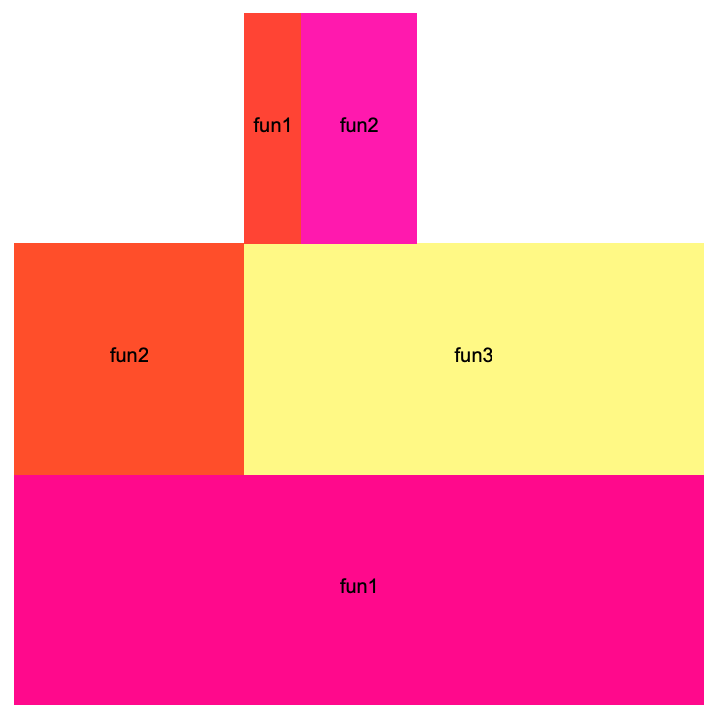 |
Apply a different color function to the chart:
| In[4]:= |
| Out[4]= | 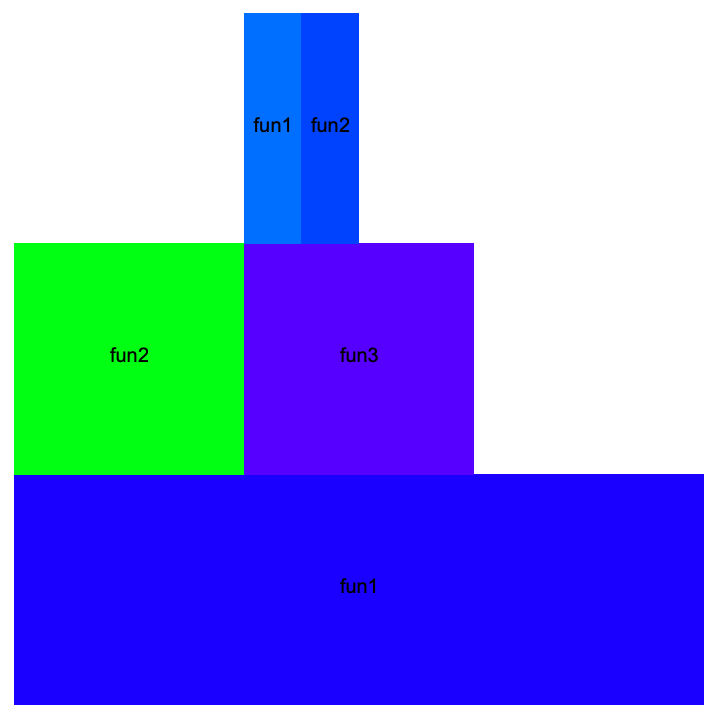 |
Use the specified color palette:
| In[5]:= |
| Out[5]= | 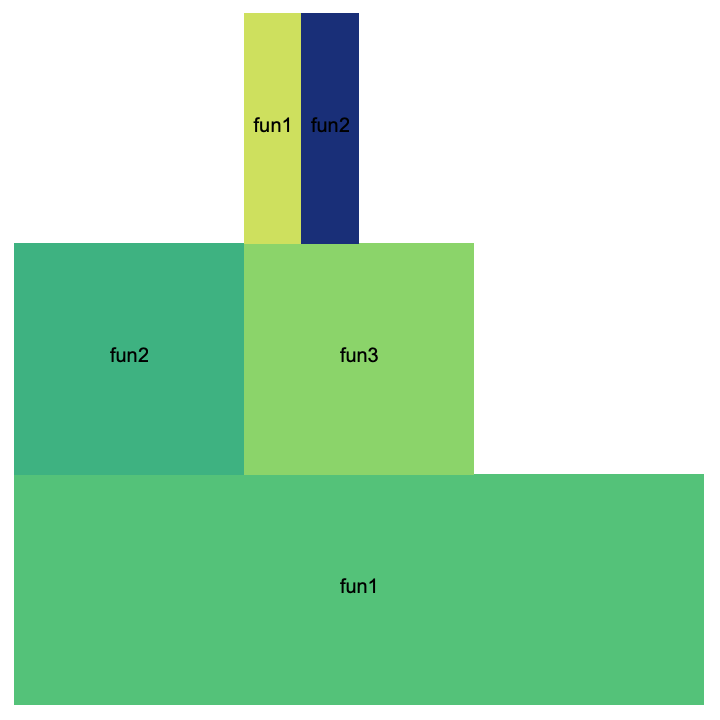 |
This work is licensed under a Creative Commons Attribution 4.0 International License