Wolfram Function Repository
Instant-use add-on functions for the Wolfram Language
Function Repository Resource:
Generate a restricted randomization between two groups, with a bias towards maintaining approximately equal allocation
ResourceFunction["EfronBiasedCoin"][p,n] generates a sequence of n restricted randomizations between two groups, maintaining approximately equal allocation with bias p. |
Generate a sequence of 100 options with a bias of (p = 2/3) towards equal allocation:
| In[1]:= |
| Out[1]= |  |
Different weighting can be given to the restriction of equal allocation:
| In[2]:= |
| Out[2]= |
| In[3]:= |
| Out[3]= |
| In[4]:= |
| Out[4]= |
Different sequence lengths can be generated:
| In[5]:= |
| Out[5]= |
| In[6]:= |
| Out[6]= |
| In[7]:= |
| Out[7]= |  |
Users may replace the default symbols for the groups in any way they like:
| In[8]:= |
| Out[8]= |
Find the count of all values that follow an "A” when p is near 1/2:
| In[9]:= |
| Out[10]= |
Compare to when p is near 1. This shows a strong bias for alternating:
| In[11]:= |
| Out[12]= |
Complete randomization is achieved by a (p = 1/2) weighting towards selection of the underrepresented group:
| In[13]:= |
| Out[13]= |  |
Complete randomization (p = 1/2) is thus equivalent to simple utilization of RandomChoice, albeit with the sequentially biased algorithm being slower:
| In[14]:= | ![randomChoiceData = EchoTiming[
Table["A" /. Rule @@@ Tally@RandomChoice[{"A", "B"}, 100], {10000}], "RandomChoice Runtime: "];
unbiasedEfronData = EchoTiming[
Table["A" /. Rule @@@ Tally@ResourceFunction["EfronBiasedCoin"][1/2, 100], {10000}], "Efron Runtime: "];
Histogram[{randomChoiceData, unbiasedEfronData}, PlotRange -> {{0, 100}, All},
Frame -> True, FrameTicksStyle -> Directive[Black, 12, FontFamily -> "Calibri"],
FrameLabel -> (Style[#, Black, 16, FontFamily -> "Calibri"] & /@ {"Treatment Percentage (A)", "Count (out of 10000)"}),
ChartLegends -> (Style[#, Black, 16, FontFamily -> "Calibri"] & /@ {"RandomChoice (Unbiased, p = 1/2)", "Efron's Design (p = 1/2)"}),
GridLines -> {{50}, None}]](https://www.wolframcloud.com/obj/resourcesystem/images/390/3906c758-d936-48f8-ae39-c029c4c38ab9/456e84bb013c41a8.png) |
| Out[16]= | 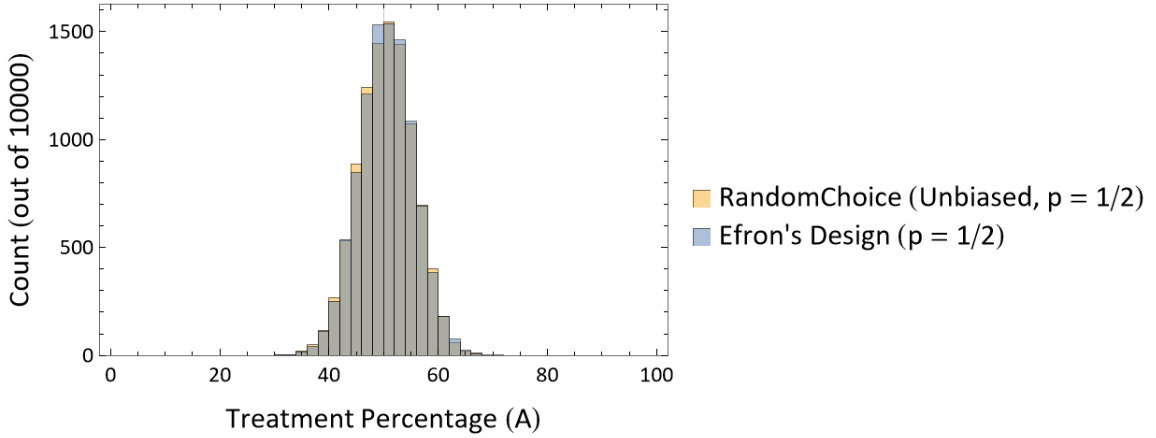 |
| In[17]:= |
| Out[17]= |
| In[18]:= |
| Out[19]= |
The variance in allocation percentage for a given group can be diminished by weighting the randomization scheme (p ≠ 1/2):
| In[20]:= | ![biasedEfronData = Table["A" /. Rule @@@ Tally@ResourceFunction["EfronBiasedCoin"][2/3, 100], {10000}];
Histogram[{randomChoiceData, biasedEfronData}, PlotRange -> {{0, 100}, All},
Frame -> True, FrameTicksStyle -> Directive[Black, 12, FontFamily -> "Calibri"],
FrameLabel -> (Style[#, Black, 16, FontFamily -> "Calibri"] & /@ {"Treatment Percentage (A)", "Count (out of 10000)"}),
ChartLegends -> (Style[#, Black, 16, FontFamily -> "Calibri"] & /@ {"RandomChoice (Unbiased, p = 1/2)", "Efron's Design (p = 2/3)"}),
GridLines -> {{50}, None}]](https://www.wolframcloud.com/obj/resourcesystem/images/390/3906c758-d936-48f8-ae39-c029c4c38ab9/0b2d71a55b05ffe7.png) |
| Out[21]= | 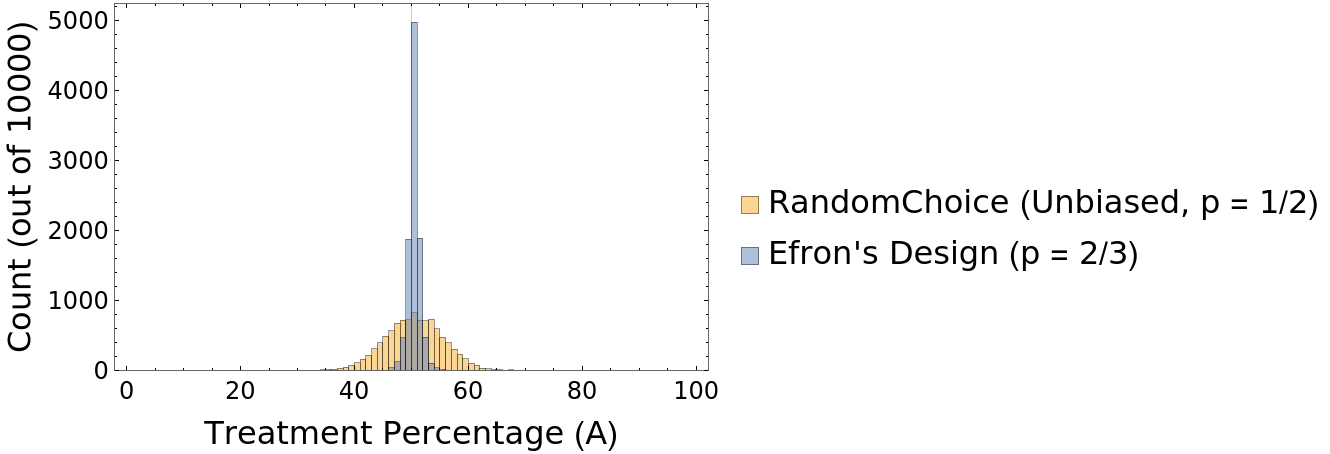 |
| In[22]:= |
| Out[22]= |
| In[23]:= |
| Out[24]= |
Explore the options in variance of allocation percentage as a function of the bias p:
| In[25]:= | ![ensembleData = Table["A" /. Rule @@@ Tally@ResourceFunction["EfronBiasedCoin"][p, 100], {p, {1/2, 3/5,
2/3, 3/4, 4/5, 1.}}, {1000}];
Histogram[ensembleData, PlotRange -> {{0, 100}, All},
Frame -> True, FrameTicksStyle -> Directive[Black, 12, FontFamily -> "Calibri"],
FrameLabel -> (Style[#, Black, 16, FontFamily -> "Calibri"] & /@ {"Treatment Percentage (A)", "Count (out of 10000)"}),
ChartLegends -> (Style[#, Black, 16, FontFamily -> "Calibri"] & /@ Table[StringForm["Efron's Design (p = `1` = `2`)", p, N@p], {p, {1/2, 3/5, 2/3, 3/4, 4/5, 1.}}]),
GridLines -> {{50}, None}]](https://www.wolframcloud.com/obj/resourcesystem/images/390/3906c758-d936-48f8-ae39-c029c4c38ab9/457f7ba69193b908.png) |
| Out[26]= | 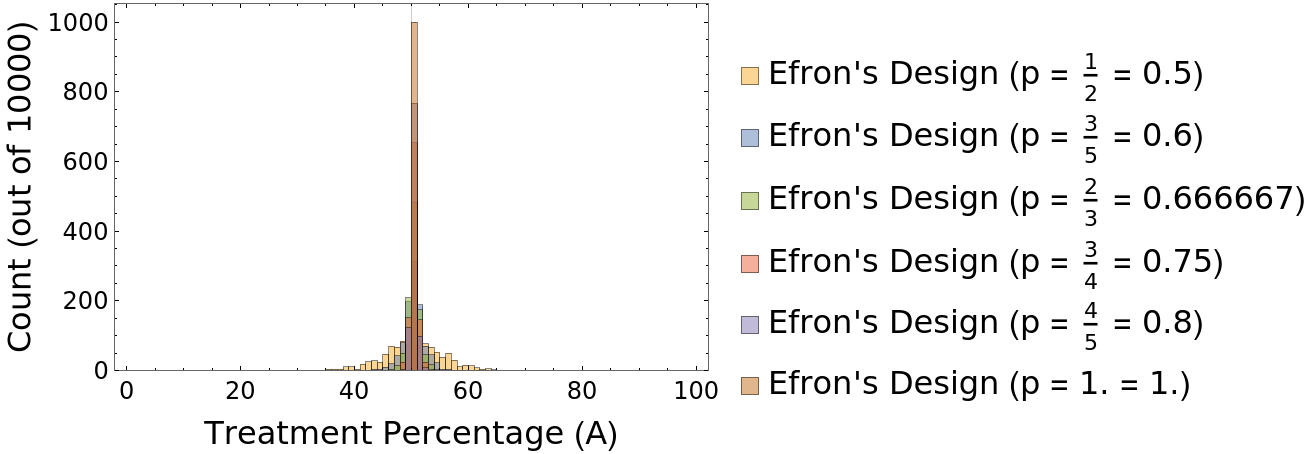 |
| In[27]:= | ![ListLinePlot[
Transpose[{Table[p, {p, {1/2, 3/5, 2/3, 3/4, 4/5, 1.}}], Variance /@ ensembleData}],
PlotRange -> {All, {0, All}}, PlotMarkers -> Automatic, Frame -> True, FrameTicksStyle -> Directive[Black, 12, FontFamily -> "Calibri"],
FrameLabel -> (Style[#, Black, 16, FontFamily -> "Calibri"] & /@ {"Bias \!\(\*
StyleBox[\"p\",\nFontSlant->\"Italic\"]\)", "Allocation Variance \!\(\*SuperscriptBox[\(\[Sigma]\), \(2\)]\)"})]](https://www.wolframcloud.com/obj/resourcesystem/images/390/3906c758-d936-48f8-ae39-c029c4c38ab9/63bdd24f7882762b.png) |
| Out[27]= | 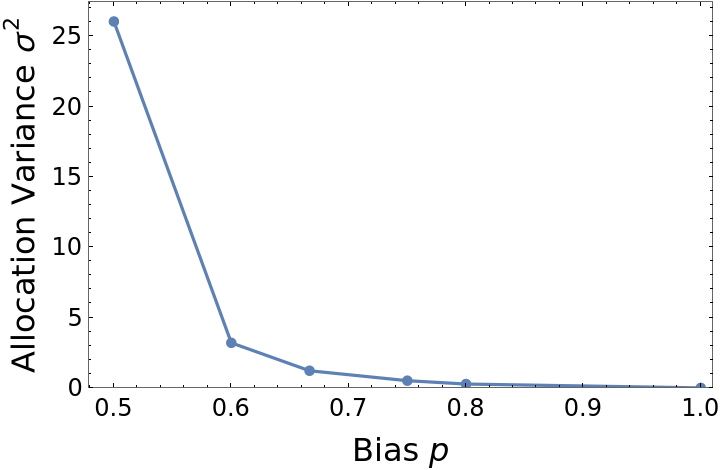 |
To view the full source code for EfronBiasedCoin, evaluate the following:
This work is licensed under a Creative Commons Attribution 4.0 International License