Wolfram Function Repository
Instant-use add-on functions for the Wolfram Language
Function Repository Resource:
Create a dot plot for a set of real-valued univariate data
ResourceFunction["DotPlot"][data] plots the integer data on a number line, stacking repeated values. |
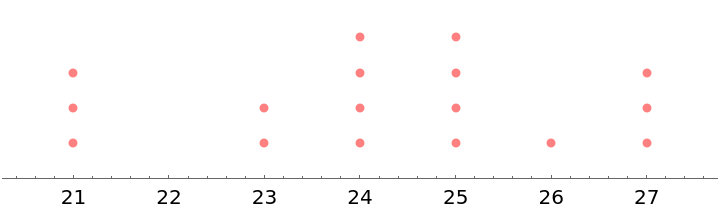
Get a dot plot for a set of univariate data:
| In[1]:= |
| Out[1]= | 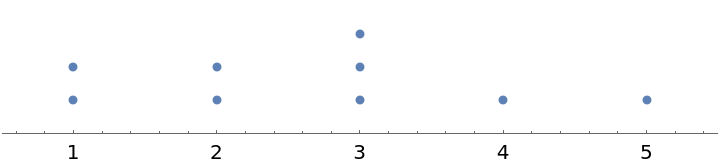 |
Get a dot plot for a random dataset:
| In[2]:= |
| Out[2]= |
| Out[3]= | 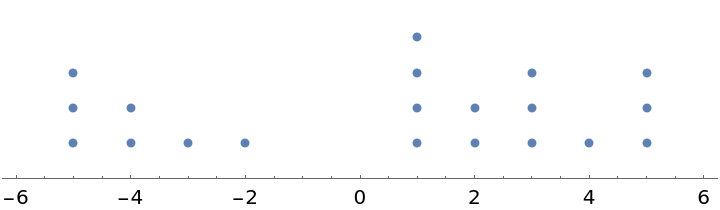 |
DotPlot only supports real-valued datasets:
| In[5]:= |
| Out[5]= |
To view the full source code for DotPlot, evaluate the following:
This work is licensed under a Creative Commons Attribution 4.0 International License