Wolfram Function Repository
Instant-use add-on functions for the Wolfram Language
Function Repository Resource:
Get a grid of sign charts for a function and its first and second derivatives
ResourceFunction["DerivativeSignCharts"][f, x] creates a grid of sign charts for f(x),f'(x) and f''(x). |
| FontSize | Medium | adjust the font size of sign chart labels |
| "PlusColor" | set the color corresponding to positive points/intervals | |
| "MinusColor" | set the color corresponding to negative points/intervals | |
| "ZeroColor" | set the color corresponding to zero or discontinuous points/intervals | |
| "ShowPlots" | False | include plots of the function and its derivatives in the grid |
| "ShowEquations" | False | include equations of the function and its derivatives in the grid |
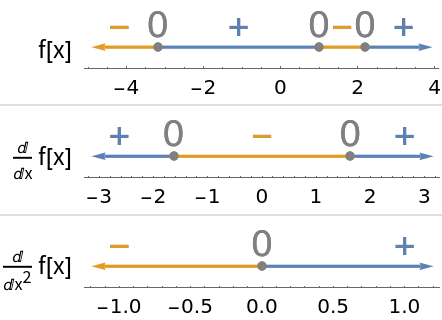
Get sign charts for x3 and its first and second derivatives (3x2 and 6x, respectively):
| In[1]:= |
| Out[1]= | 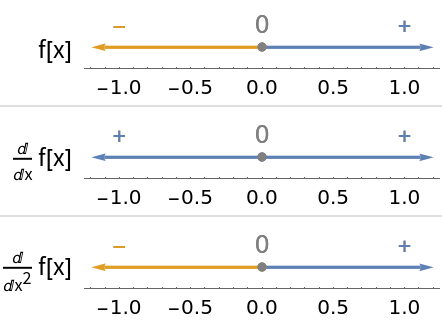 |
Include the equations and plots of the given function and its derivatives:
| In[2]:= |
| Out[2]= | 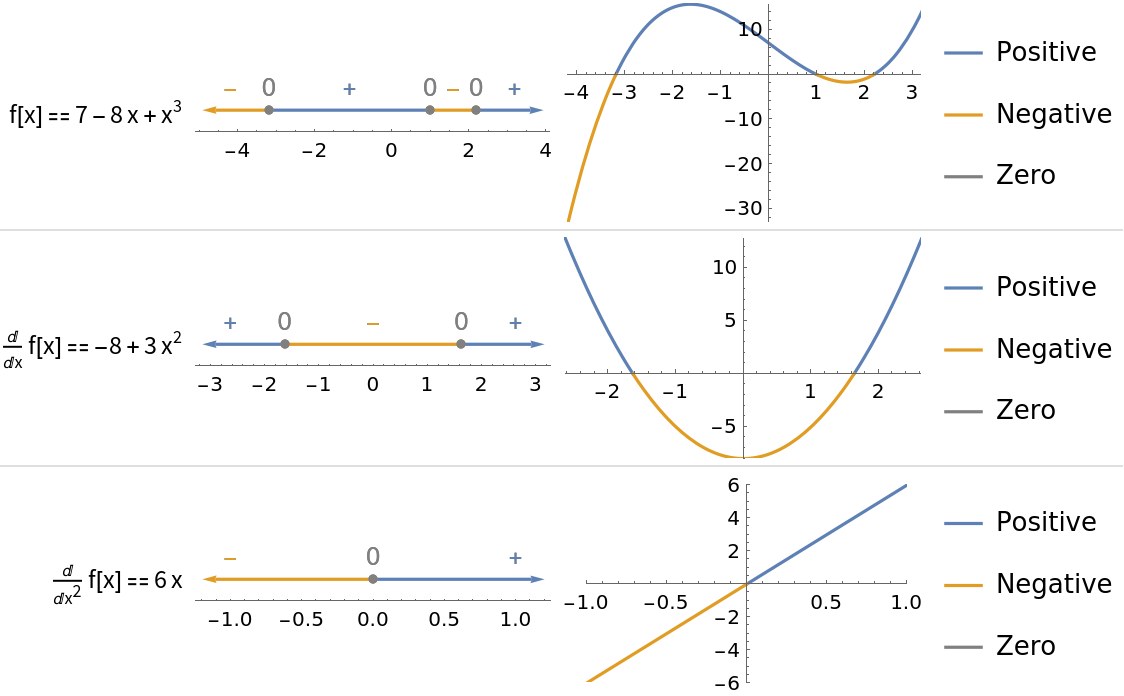 |
If there are infinitely many places where a function or one of its derivatives changes signs, the sign chart displays information for an interval surrounding x = 0:
| In[3]:= |
| Out[3]= | 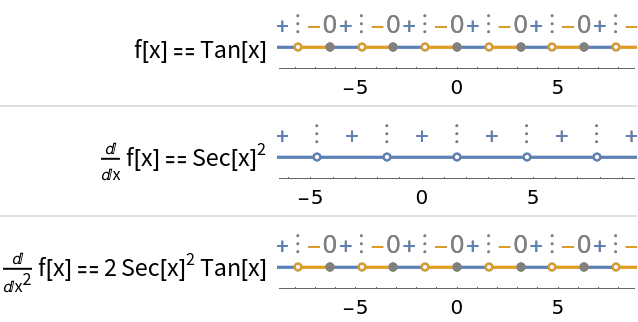 |
Use the option "MinusColor" to adjust the color of the negative intervals and minus signs:
| In[5]:= |
| Out[5]= | 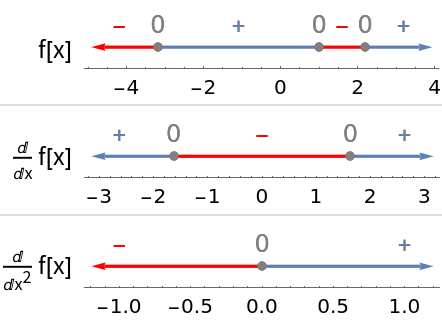 |
Use the option "PlusColor" to adjust the color of the positive intervals and plus signs:
| In[6]:= |
| Out[6]= | 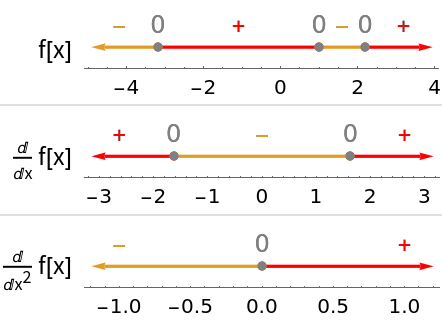 |
Use the option "ZeroColor" to adjust the color of the zero or discontinuous intervals and zeros:
| In[7]:= |
| Out[7]= | 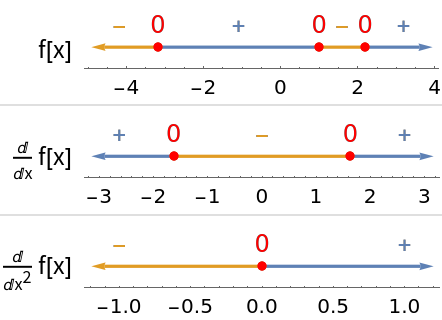 |
Set option “ShowEquations” to True to show the equations of the inputted function and its derivatives:
| In[8]:= |
| Out[8]= | 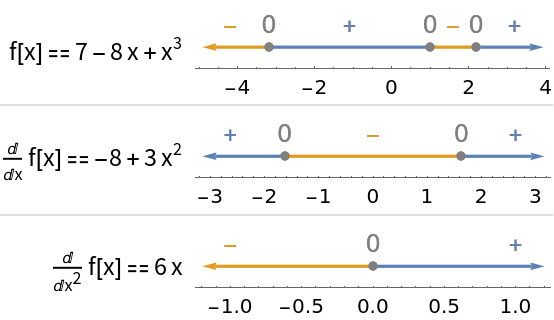 |
Set option “ShowPlots” to True to show plots of the inputted function and its derivatives:
| In[9]:= |
| Out[9]= | 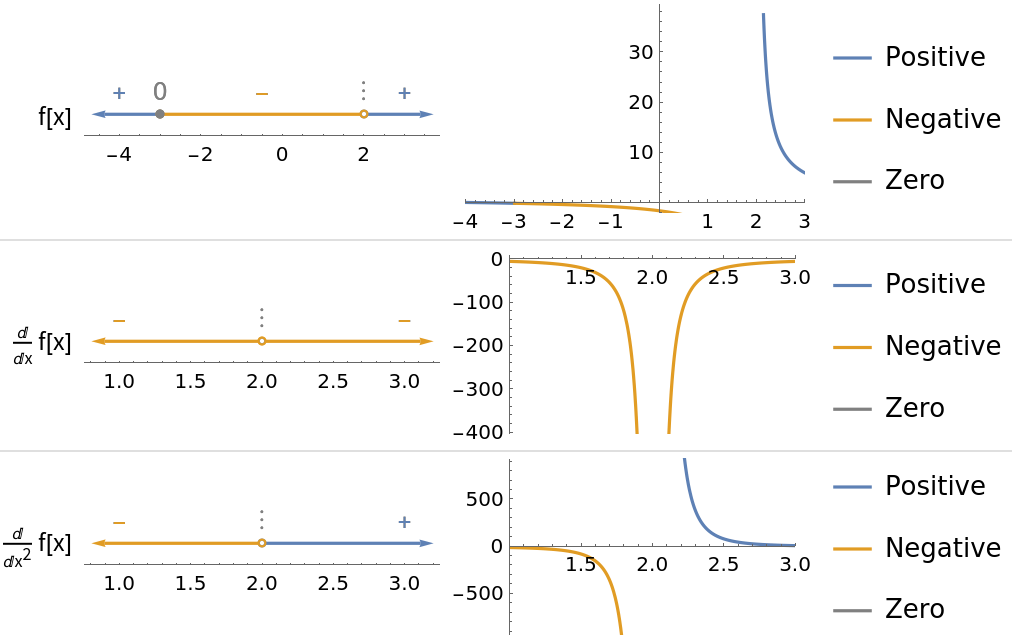 |
Sign charts are a useful reasoning tool in many contexts, especially calculus and functional analysis. Comparing the behavior of a function to the signs of its derivatives is foundational to the first and second derivative tests:
| In[10]:= |
| Out[10]= | 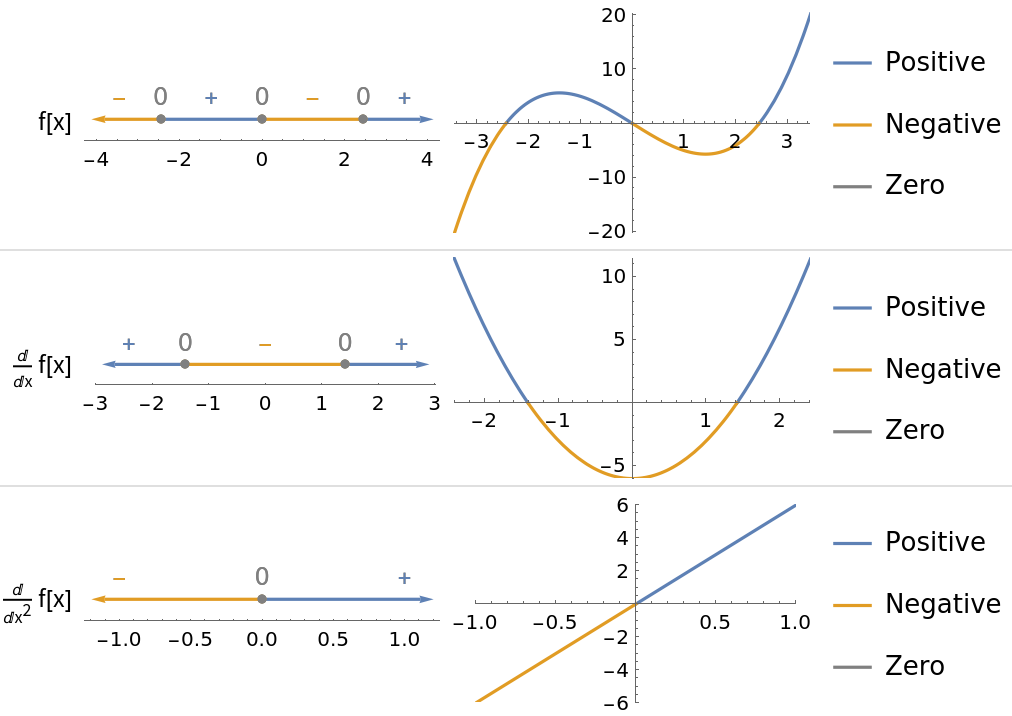 |
To view the full source code for DerivativeSignCharts, evaluate the following:

This work is licensed under a Creative Commons Attribution 4.0 International License