Details and Options
The following options can be given:
| "Start" | 1/2 | beginning hue |
| "Rotations" | -3/2 | cycles of all hues |
| "Hue" | 1 | colorfulness of median values |
| "Gamma" | 1 | emphasis on higher/lower values |
| "MinLight" | 0 | lightness for minimum values |
| "MaxLight" | 1 | lightness for maximum values |
| "MinHue" | 0 | colorfulness of extreme values |
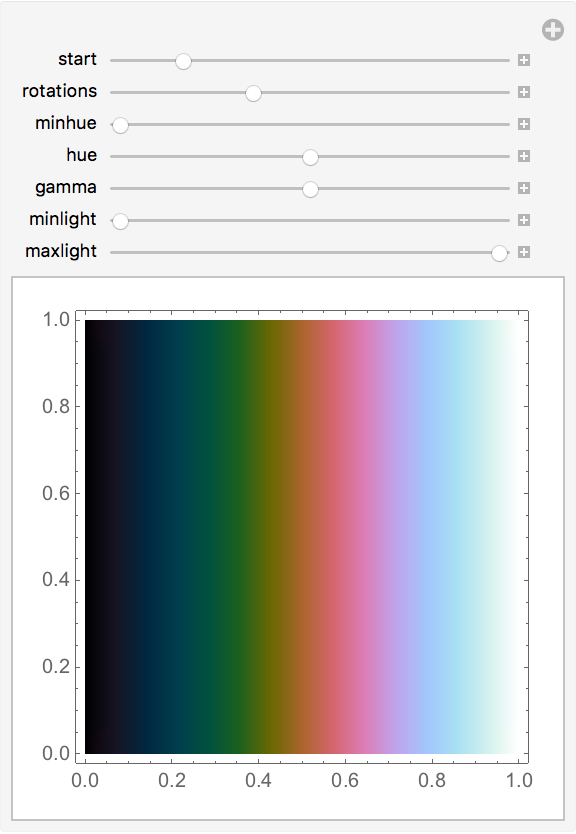
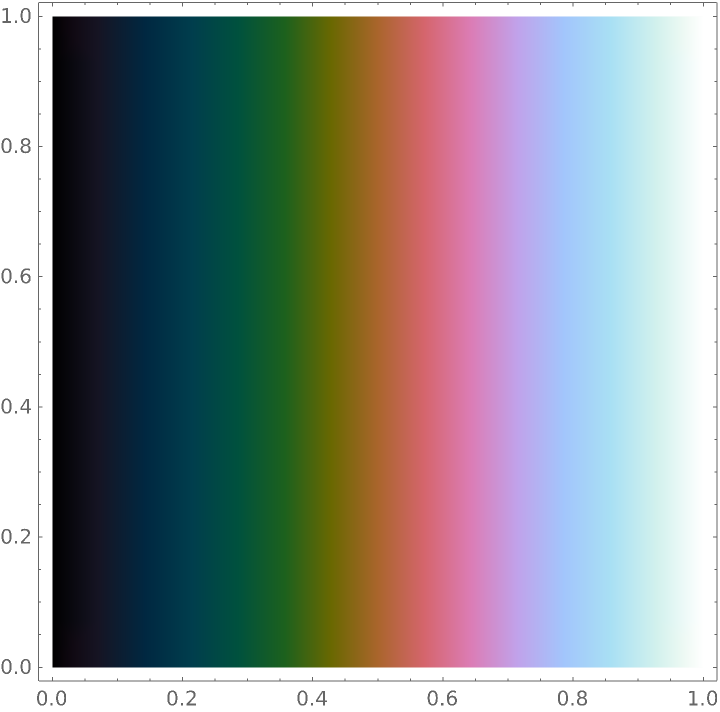
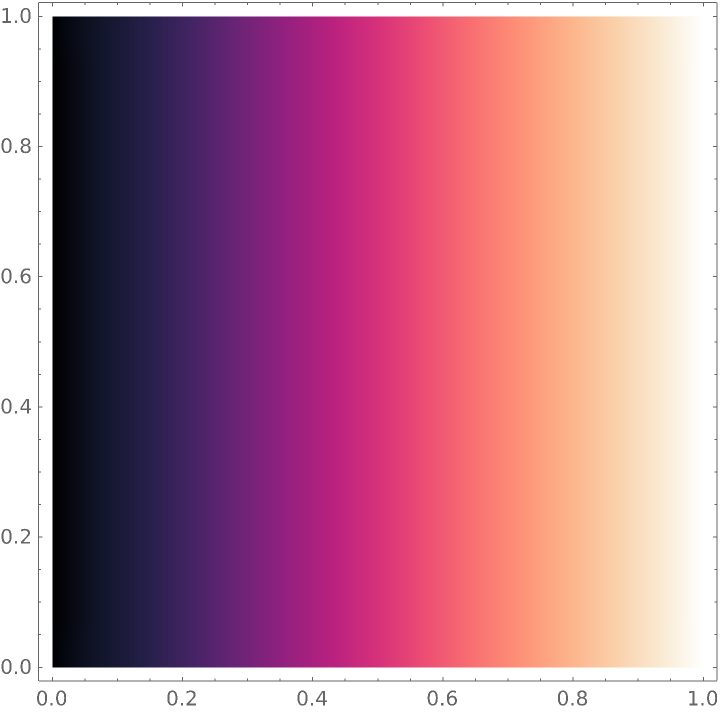
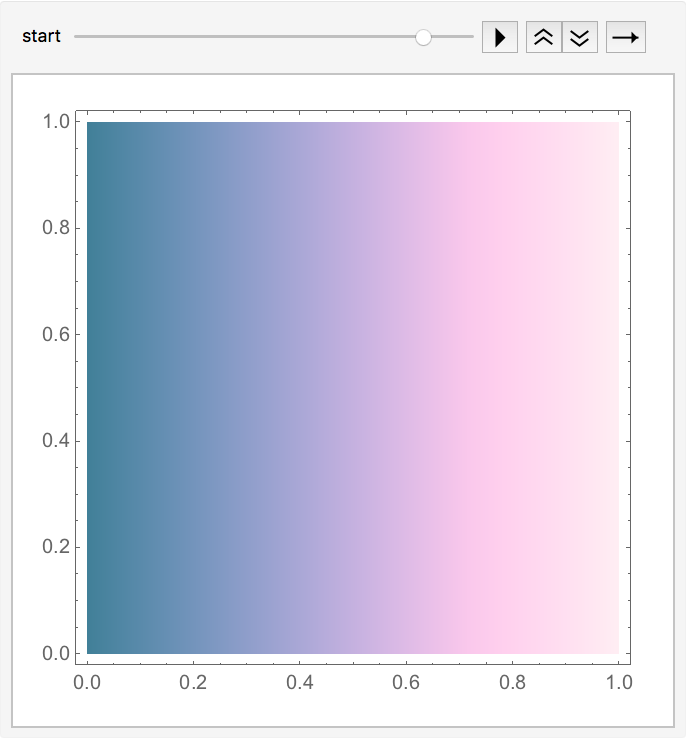
"Start" defines the starting hue of the color function, where 1 = red, 2 = green and 3 = blue. The default value (1/2) is purple.
"Rotations" defines how many times we cycle through all hues. 0 means that we only use one hue, 1 means that we cycle through all hues once and -2 means that we cycle through all hues twice but in a reverse direction. The default value (-3/2) means that we cycle through all hues one and a half times in a reverse direction.
"Hue" (which is really chroma) defines how colorful the function is. 0 means that there is no color and 1 (the default value) means that there is a default amount of color. You can use values greater than 2.6, but they will tend to be oversaturated.
"Gamma" shifts the lightness curve and should be a value greater than 0 but less than 2. The default value (1) provides a linear curve. Lower values (like 1/4) will lighten all colors but will leave low values dark. Higher values (like 3/4) will darken all colors but will leave high values light.
"MinLight" defines the lightness value for minimum values. The default value is 0, meaning that the minimum value will be black.
"MaxLight" defines the lightness value for maximum values. The default value is 1, meaning that the maximum value will be white.
"MinHue" defines how colorful the extreme values of the function will be. The default value is 0, meaning that the function will be most colorful in the middle and the minimum/maximum values will have no color.
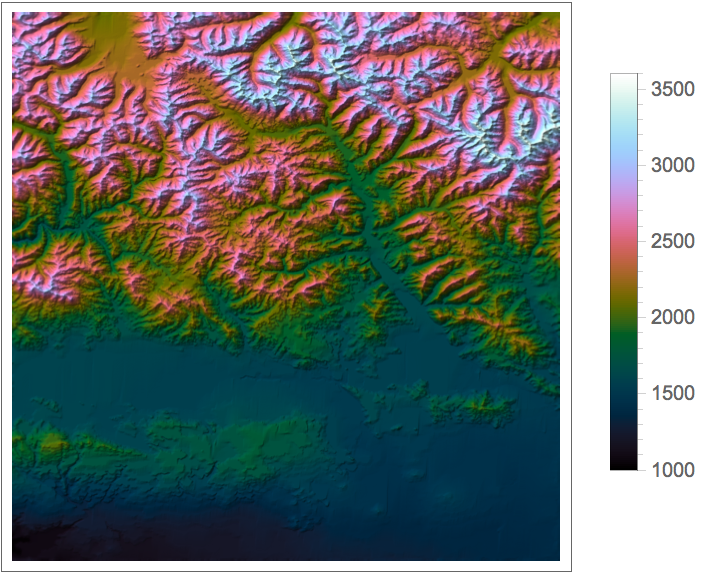
![Multicolumn[(# -> DensityPlot[x, {x, 0, 1}, {y, 0, 1}, ColorFunction -> ResourceFunction["CubehelixColorFunction"]["Start" -> #]] & /@ Range[0, 3, 1/2])]](https://www.wolframcloud.com/obj/resourcesystem/images/79d/79d427f5-0a33-43e4-83d7-8754f137eea6/47aa1a189fa688ce.png)
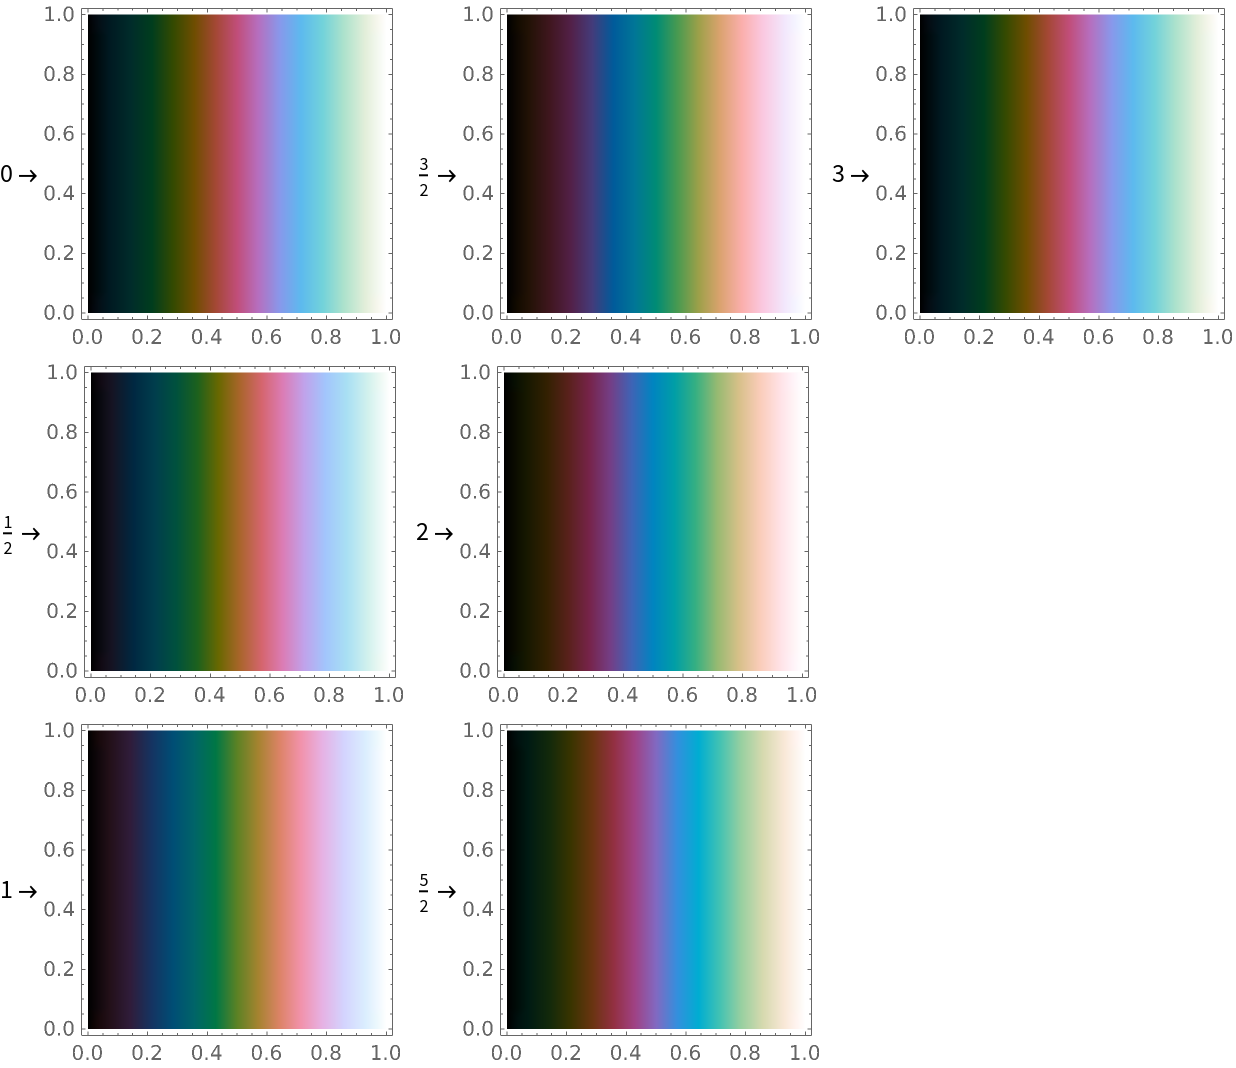
![Multicolumn[(# -> DensityPlot[x, {x, 0, 1}, {y, 0, 1}, ColorFunction -> ResourceFunction["CubehelixColorFunction"][
"Rotations" -> #]] & /@ {-3, -2, -1, -1/2, 0, 1/2, 1, 2, 3})]](https://www.wolframcloud.com/obj/resourcesystem/images/79d/79d427f5-0a33-43e4-83d7-8754f137eea6/23432cd6ccbf4803.png)
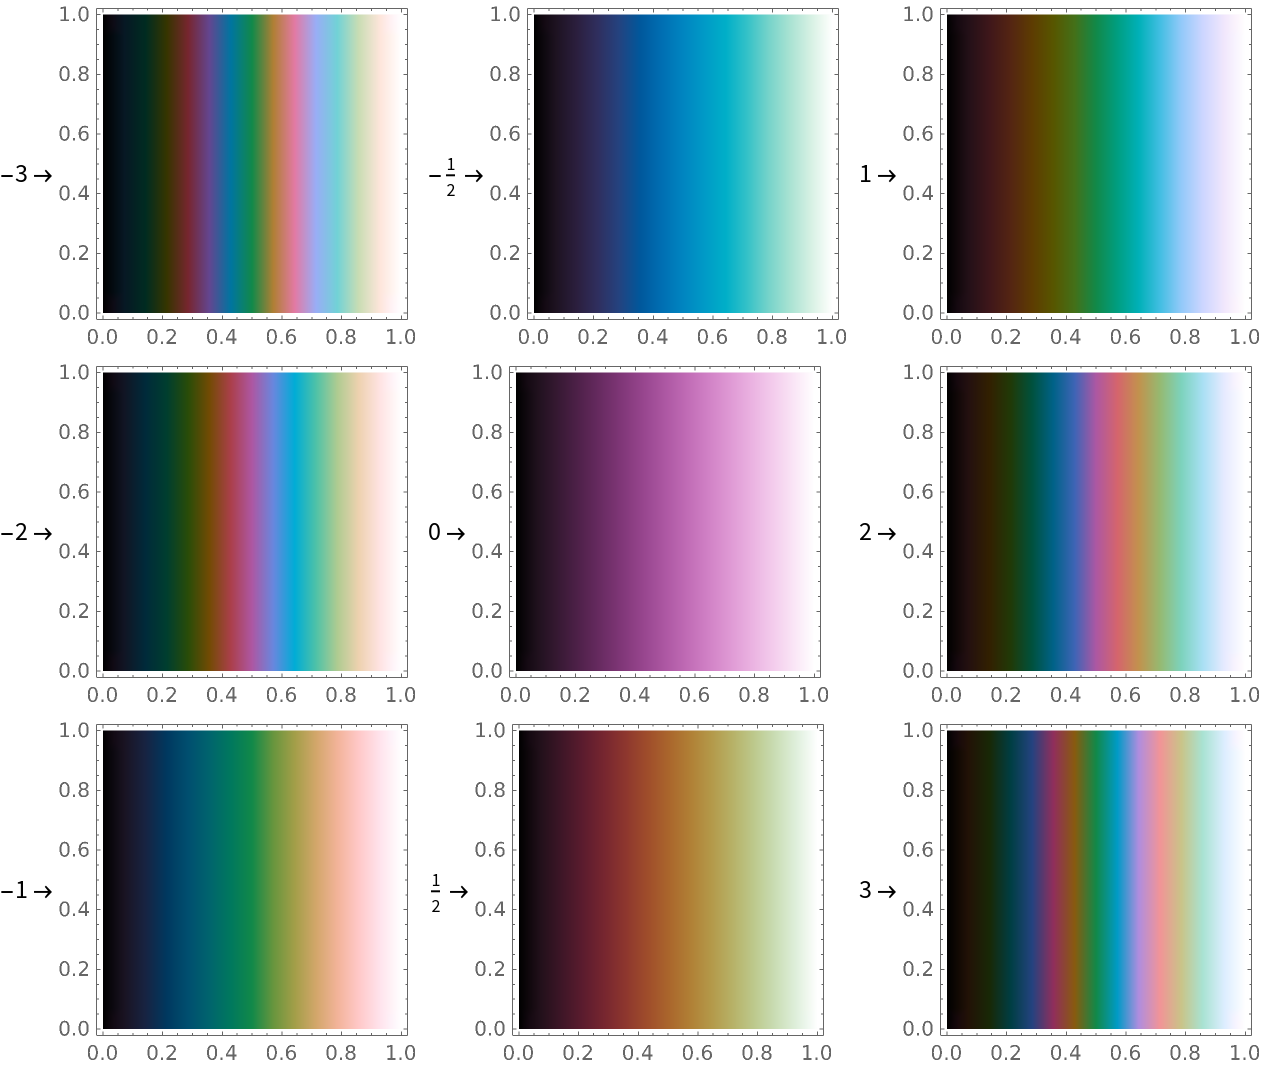
![Multicolumn[(# -> DensityPlot[x, {x, 0, 1}, {y, 0, 1}, ColorFunction -> ResourceFunction["CubehelixColorFunction"][
"Hue" -> #]] & /@ {0, 1/2, 1, 3/2, 2})]](https://www.wolframcloud.com/obj/resourcesystem/images/79d/79d427f5-0a33-43e4-83d7-8754f137eea6/241599a57665626b.png)
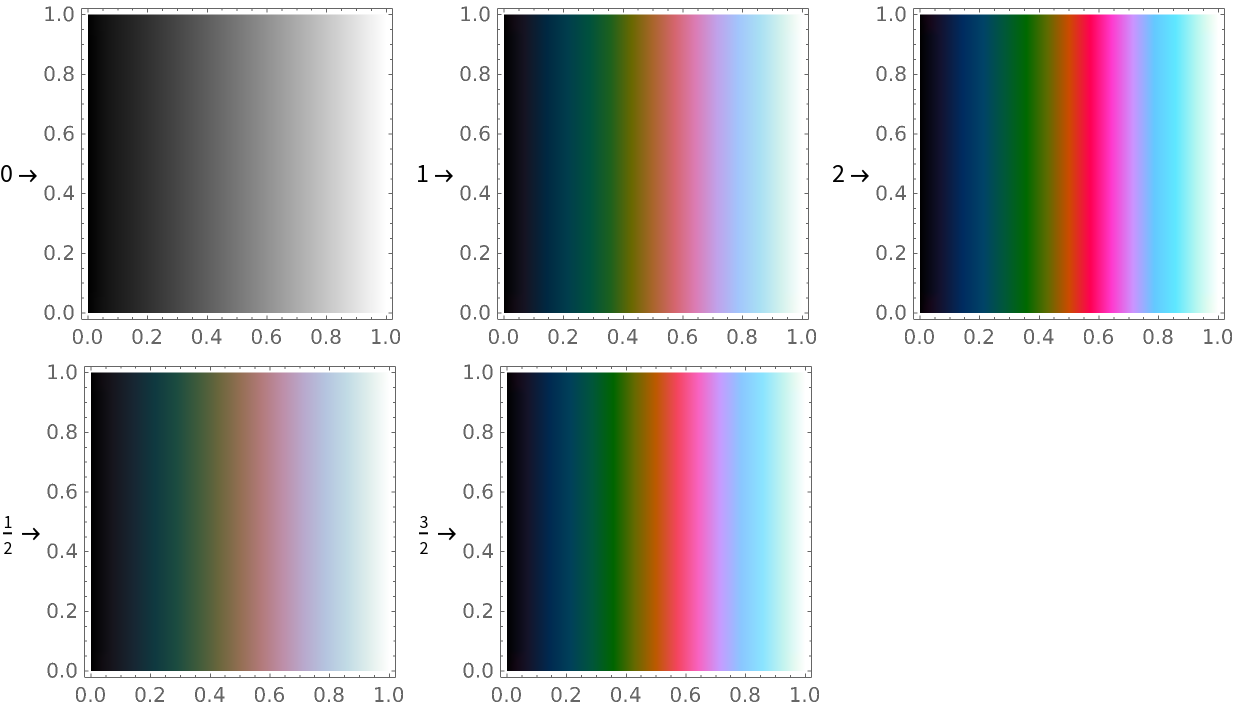
![Multicolumn[(# -> DensityPlot[x, {x, 0, 1}, {y, 0, 1}, ColorFunction -> ResourceFunction["CubehelixColorFunction"][
"Gamma" -> #]] & /@ {1/4, 1/2, 1, 3/2, 2})]](https://www.wolframcloud.com/obj/resourcesystem/images/79d/79d427f5-0a33-43e4-83d7-8754f137eea6/589a69ba4895cf3a.png)
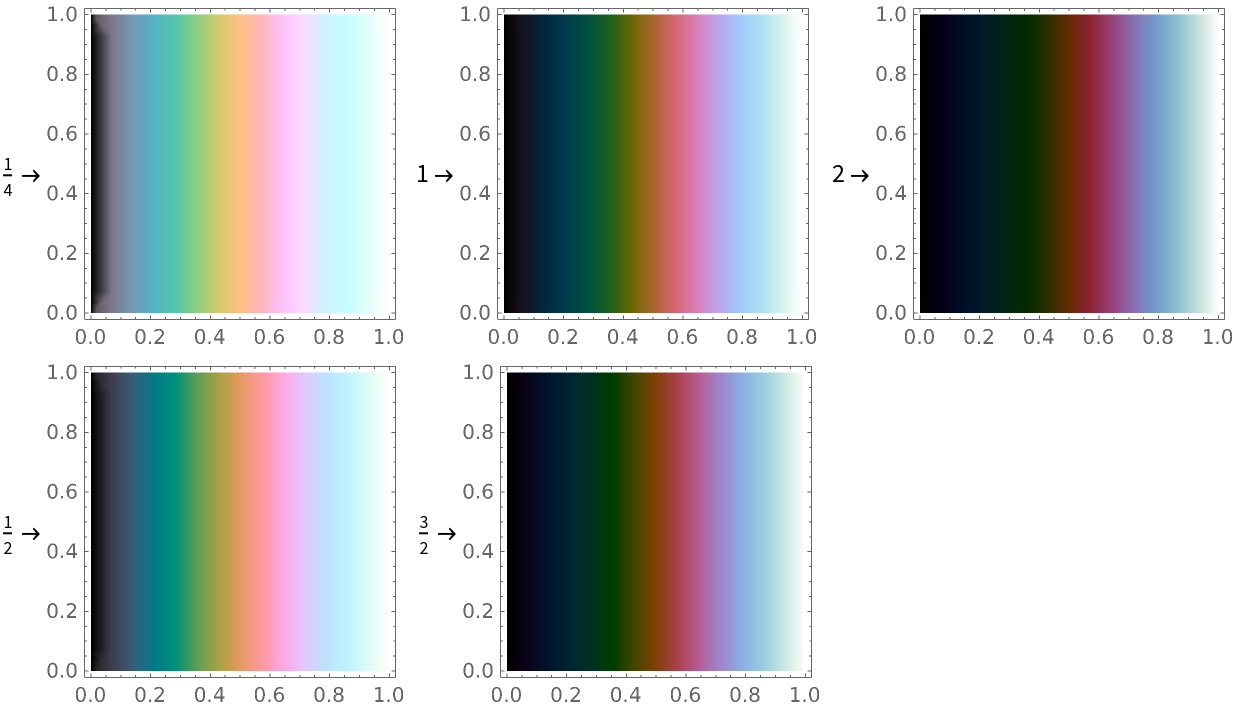
![rainbowColorFunction = ResourceFunction["CubehelixColorFunction"]["Start" -> 3/4, "Rotations" -> 1, "MinLight" -> 3/4, "MaxLight" -> 3/4, "MinHue" -> 2, "Hue" -> 2];
DensityPlot[x, {x, 0, 1}, {y, 0, 1}, ColorFunction -> rainbowColorFunction]](https://www.wolframcloud.com/obj/resourcesystem/images/79d/79d427f5-0a33-43e4-83d7-8754f137eea6/5a17e8fa77ae52fd.png)
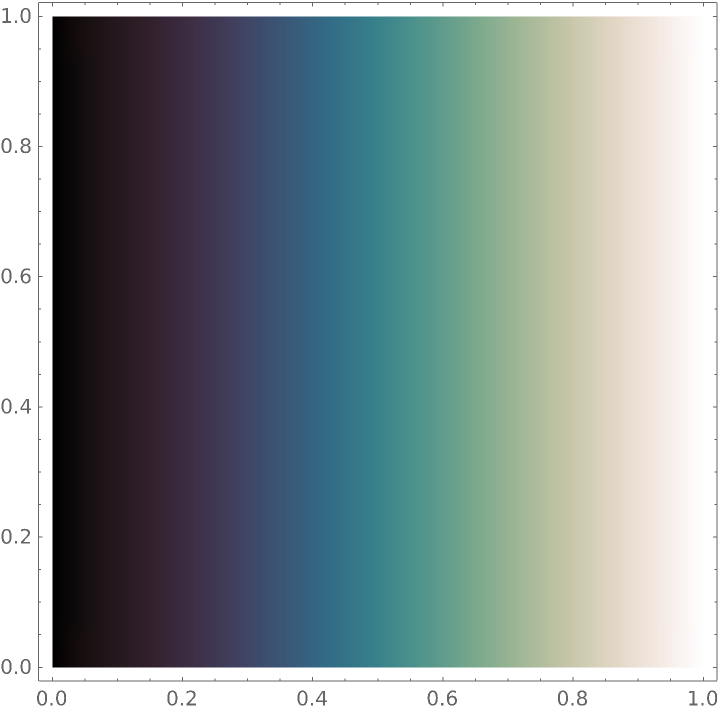
![thermogramColorFunction = ResourceFunction["CubehelixColorFunction"]["Start" -> 0, "Rotations" -> 1/2, "Hue" -> 4/3];
DensityPlot[x, {x, 0, 1}, {y, 0, 1}, ColorFunction -> thermogramColorFunction]](https://www.wolframcloud.com/obj/resourcesystem/images/79d/79d427f5-0a33-43e4-83d7-8754f137eea6/638691b47cebe9a9.png)
![Animate[DensityPlot[x, {x, 0, 1}, {y, 0, 1}, ColorFunction -> ResourceFunction["CubehelixColorFunction"]["Start" -> start, "Rotations" -> 2/5, "MinLight" -> 1/2, "Hue" -> 1/2, "MinHue" -> 1/2]], {start, 0, 3}]](https://www.wolframcloud.com/obj/resourcesystem/images/79d/79d427f5-0a33-43e4-83d7-8754f137eea6/330d9d35856c9633.png)
![Manipulate[
DensityPlot[x, {x, 0, 1}, {y, 0, 1}, ColorFunction -> ResourceFunction["CubehelixColorFunction"]["Start" -> start, "Rotations" -> rotations, "Hue" -> hue, "Gamma" -> gamma, "MinLight" -> minlight, "MaxLight" -> maxlight, "MinHue" -> minhue], ColorFunctionScaling -> True], {{start, .5}, 0, 3}, {{rotations, -1.5}, -5, 5}, {{minhue, 0}, 0, 2}, {{hue, 1}, 0, 2}, {{gamma, 1}, 0, 2}, {{minlight, 0}, 0, 1}, {{maxlight, 1}, 0,
1}]](https://www.wolframcloud.com/obj/resourcesystem/images/79d/79d427f5-0a33-43e4-83d7-8754f137eea6/7777405db0a09885.png)
