Wolfram Function Repository
Instant-use add-on functions for the Wolfram Language
Function Repository Resource:
Generate a chart showing pairwise correlations between values
ResourceFunction["CorrelationChart"][data] generates a chart showing pairwise correlations between values in data. |
| "NumericalValues" | True | display of correlation values in the upper triangle of the chart |
| "EllipsoidQuantile" | 0.95 | confidence quantile used to create ellipsoids |
| ChartLabels | False | whether variable labels are displayed |
| "Colors" | True | coloring of ellipses according to correlation value |
| "Points" | True | whether to include the underlying scatter values |
Generate a correlation chart from a small list of values:
| In[1]:= |
| Out[1]= | 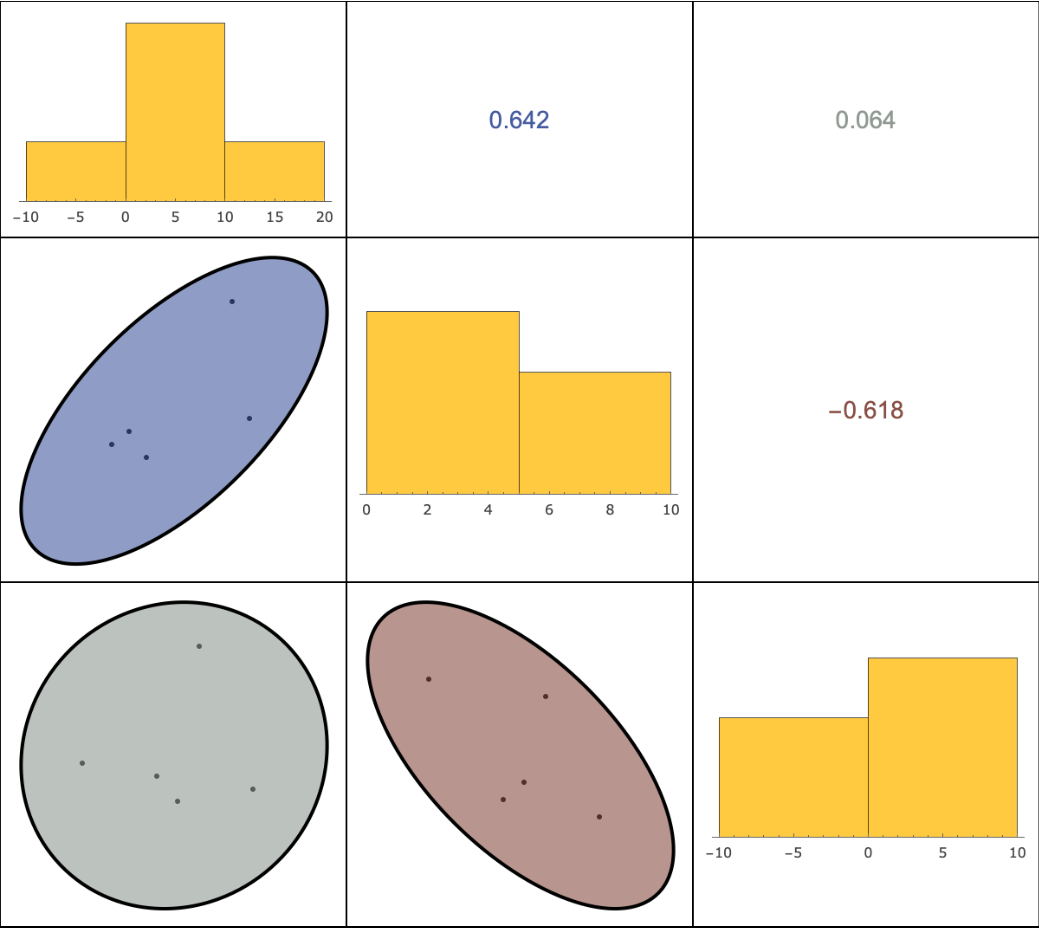 |
Generate data with 4 dimensions:
| In[2]:= | ![n = 100;
x = RandomReal[{-1, 1}, n];
data = <|"X" -> x,
"Y" -> x + RandomReal[{-1, 1}, n],
"Z" -> x + RandomReal[{-10, 10}, n],
"W" -> -x + RandomReal[{-1, 1}, n]
|>;](https://www.wolframcloud.com/obj/resourcesystem/images/bd1/bd1db2d7-7b12-4c22-b9fc-46ea96cd85ce/2e3a3ac2e7bd1ed2.png) |
Show its correlation chart:
| In[3]:= |
| Out[3]= | 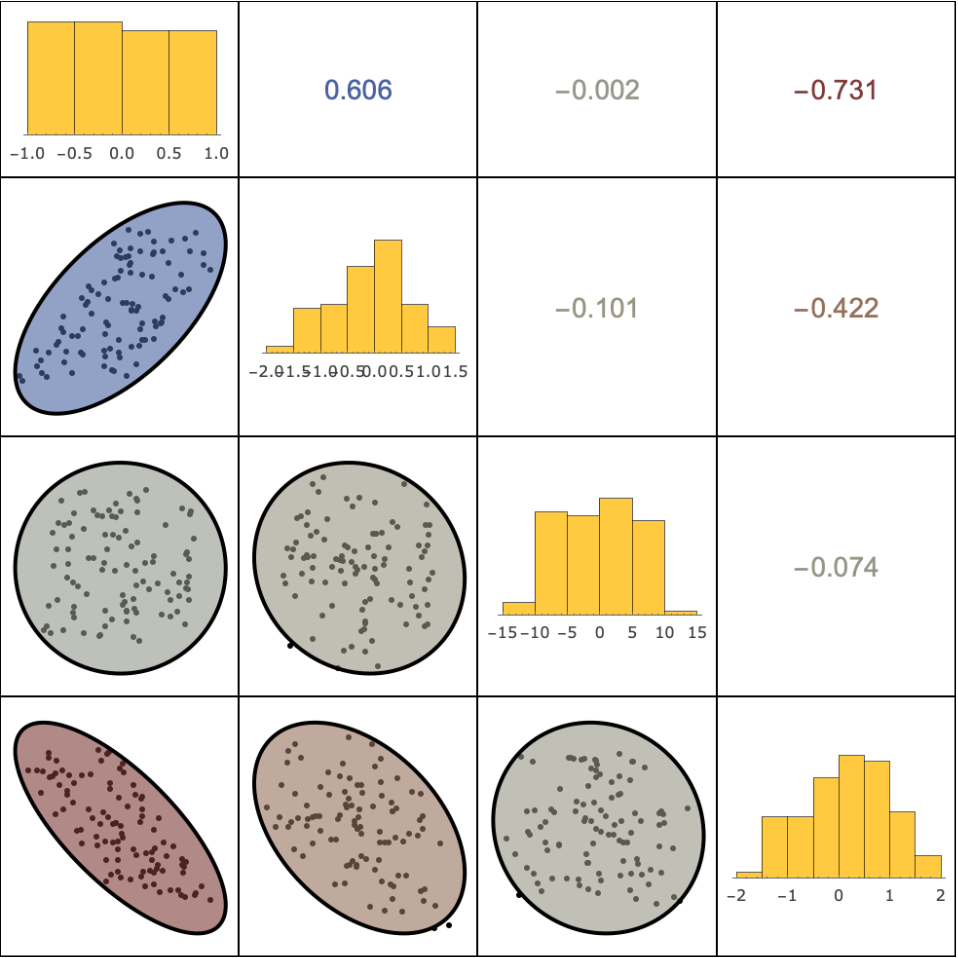 |
Get some tabular data:
| In[4]:= |
| Out[4]= | 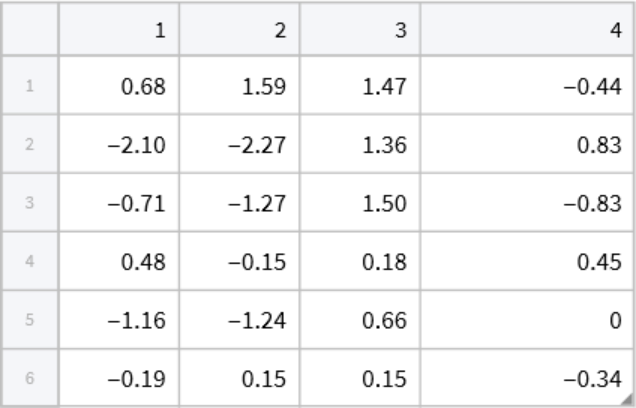 |
CorrelationChart also supports Tabular objects as input data:
| In[5]:= |
| Out[5]= | 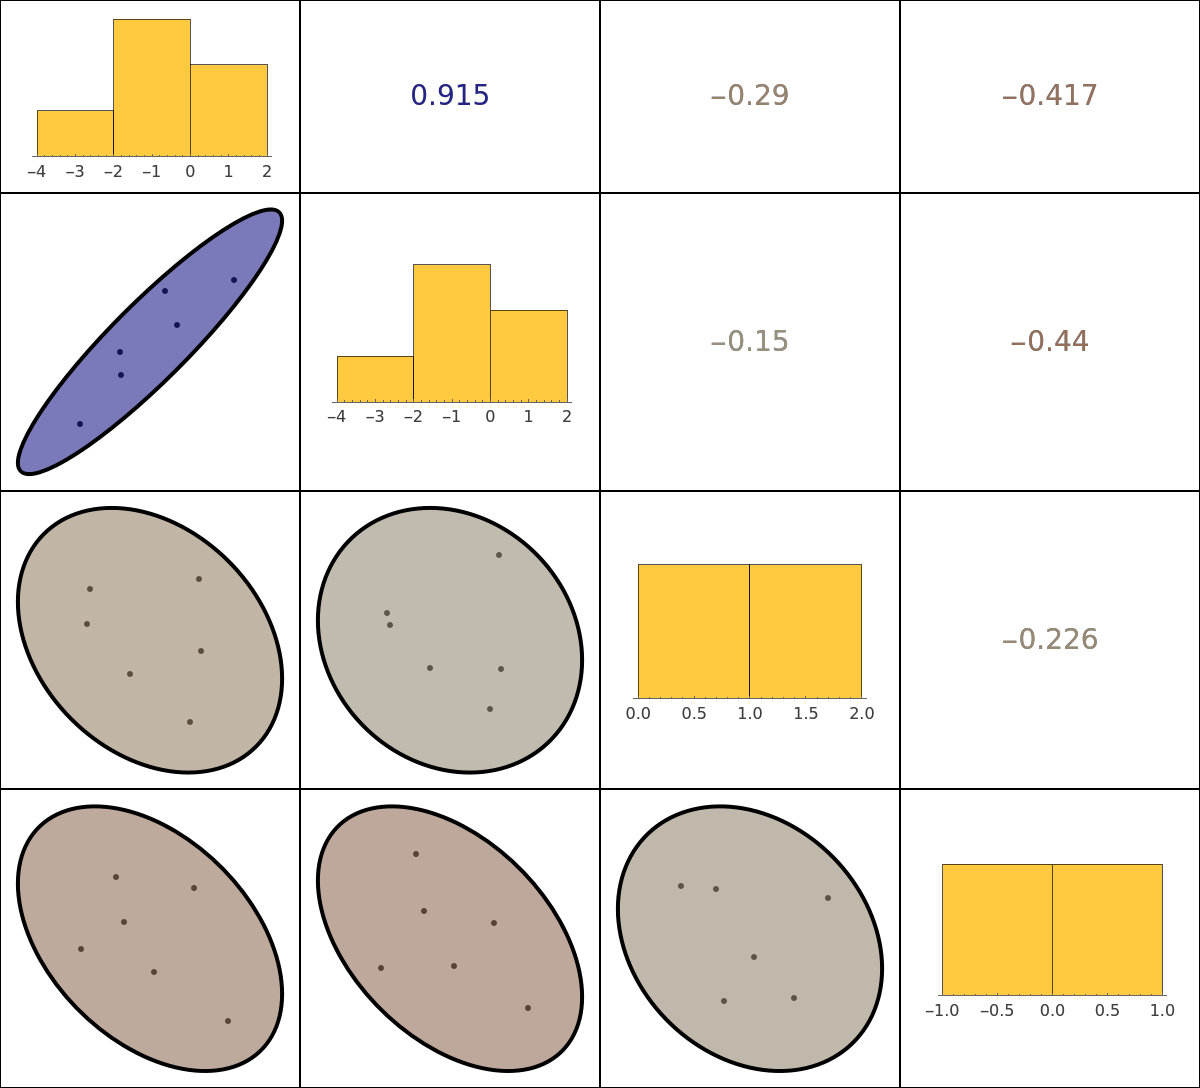 |
Start with some data containing Missing values:
| In[6]:= |
| Out[6]= | 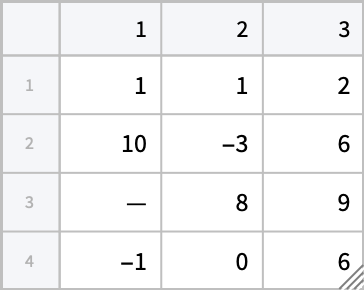 |
CorrelationChart will exclude those values containing missing elements. In this case, notice how only three out of four data values are shown:
| In[7]:= |
| Out[7]= | 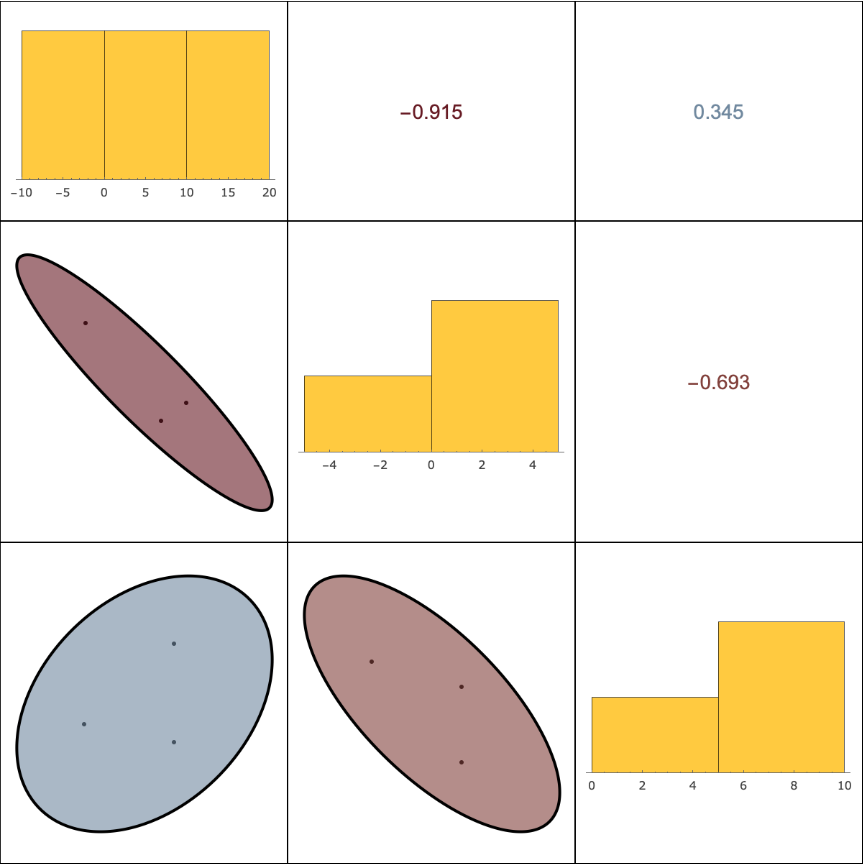 |
Use the "NumericalValues" option to suppress the display of correlation values in the upper triangle:
| In[8]:= |
| Out[8]= | 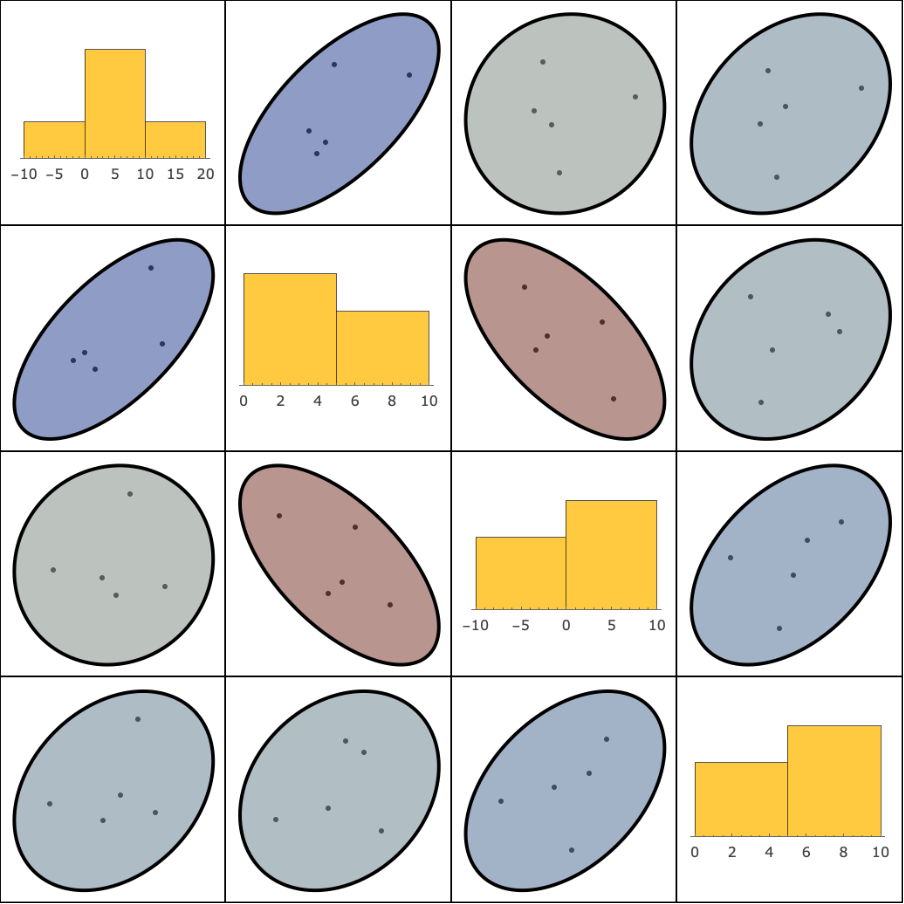 |
Set the "EllipsoidQuantile" option to different confidence quantile values used to create ellipsoids:
| In[9]:= | ![n = 100;
x = RandomReal[{-1, 1}, n]; data = Tabular[Transpose[{x, x + RandomReal[{-1, 1}, n], x + RandomReal[{-10, 10}, n]}]]](https://www.wolframcloud.com/obj/resourcesystem/images/bd1/bd1db2d7-7b12-4c22-b9fc-46ea96cd85ce/362fcf92005b0136.png) |
| Out[10]= | 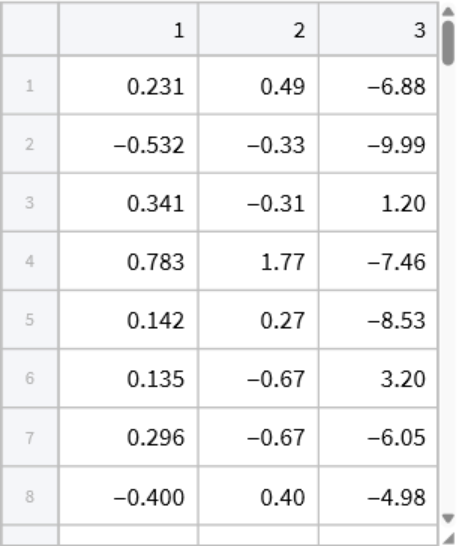 |
| In[11]:= |
| Out[11]= | 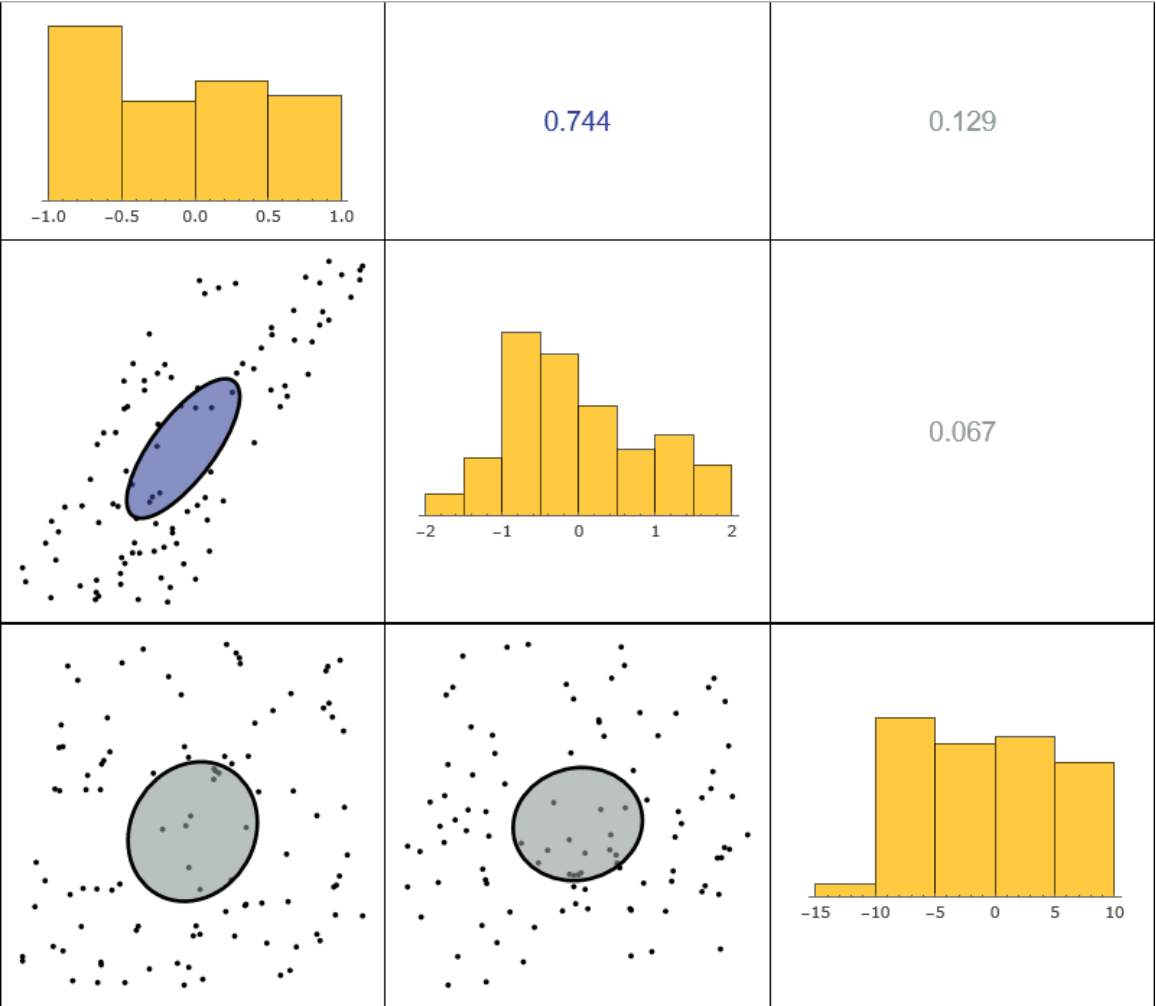 |
Use the ChartLabels option to specify labels:
| In[12]:= |
| Out[12]= | 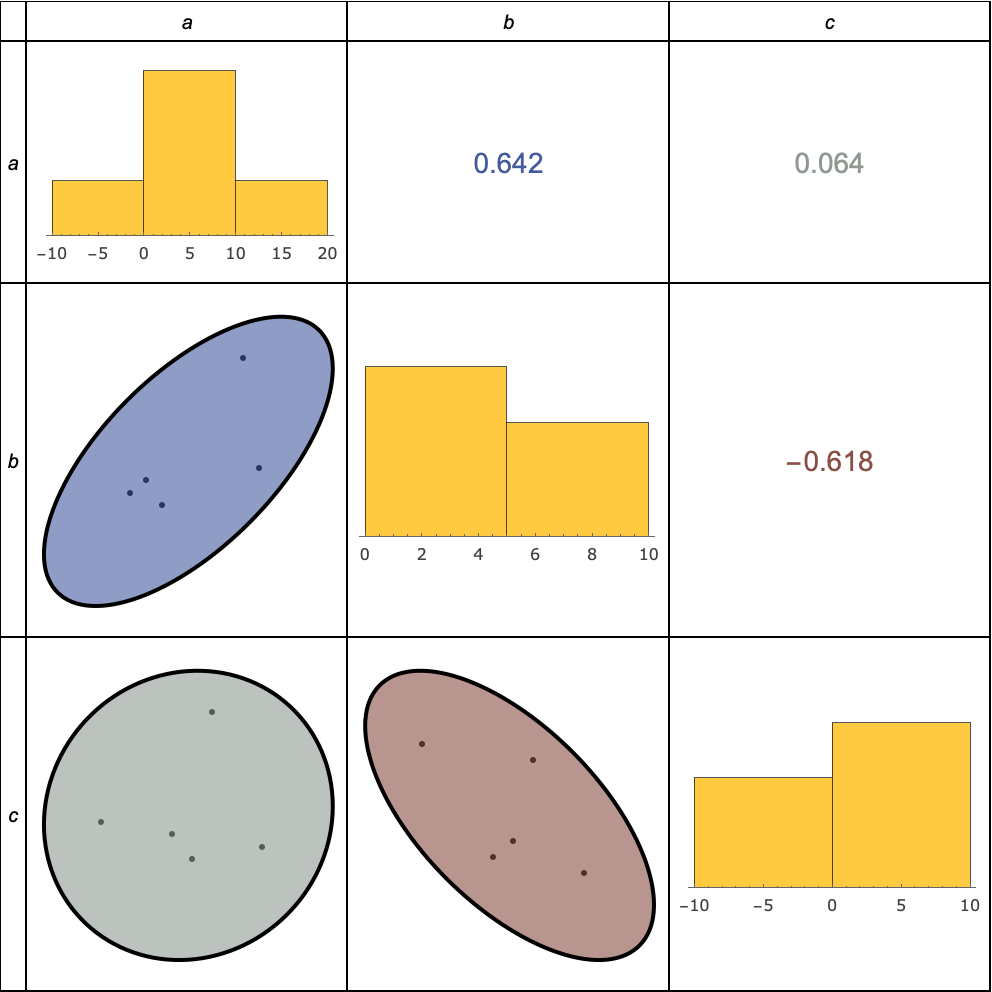 |
If no specific label is given, setting ChartLabels to True will automatically generate synthetic labels:
| In[13]:= |
| Out[13]= | 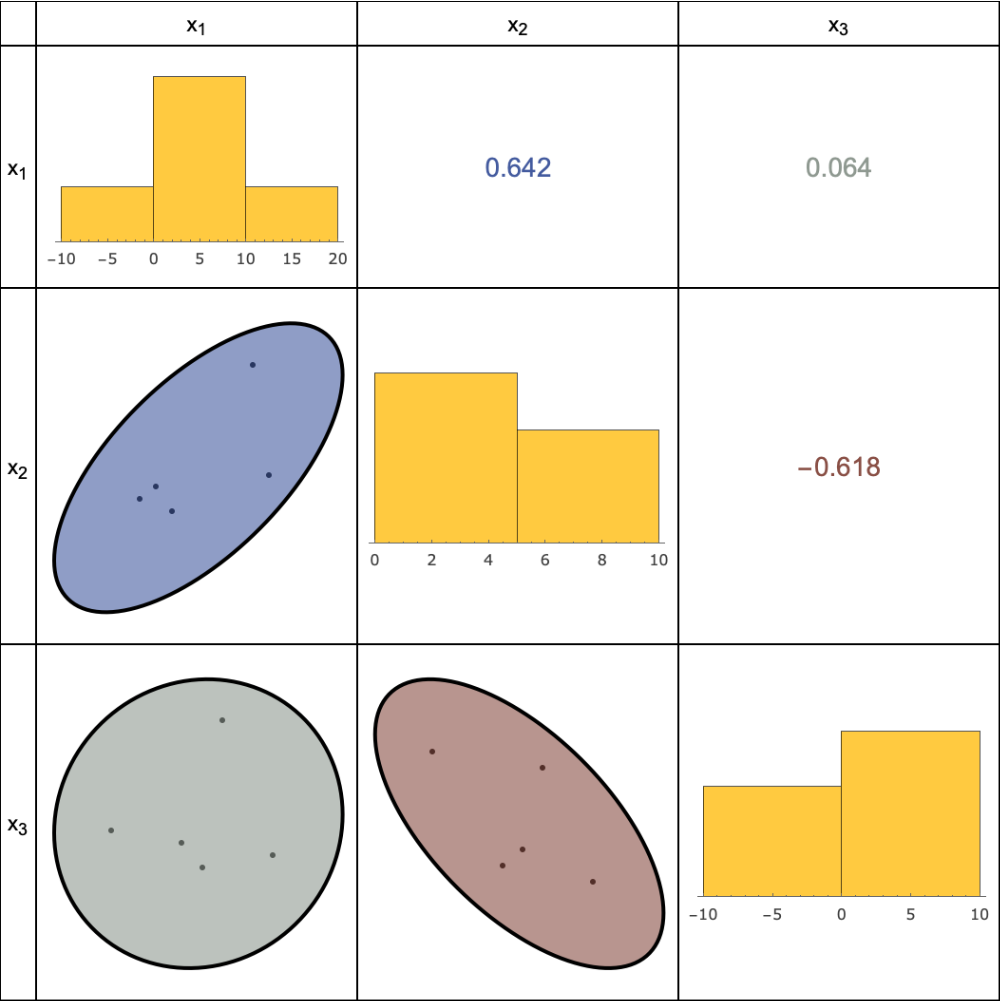 |
Start with input data given as an Association with key names:
| In[14]:= | ![n = 100;
x = RandomReal[{-1, 1}, n];
data = <|"X" -> x,
"Y" -> x + RandomReal[{-1, 1}, n],
"Z" -> x + RandomReal[{-10, 10}, n],
"W" -> -x + RandomReal[{-1, 1}, n]
|>;](https://www.wolframcloud.com/obj/resourcesystem/images/bd1/bd1db2d7-7b12-4c22-b9fc-46ea96cd85ce/5321dd24db4d3240.png) |
Setting ChartLabels to True will automatically use key names as labels:
| In[15]:= |
| Out[15]= | 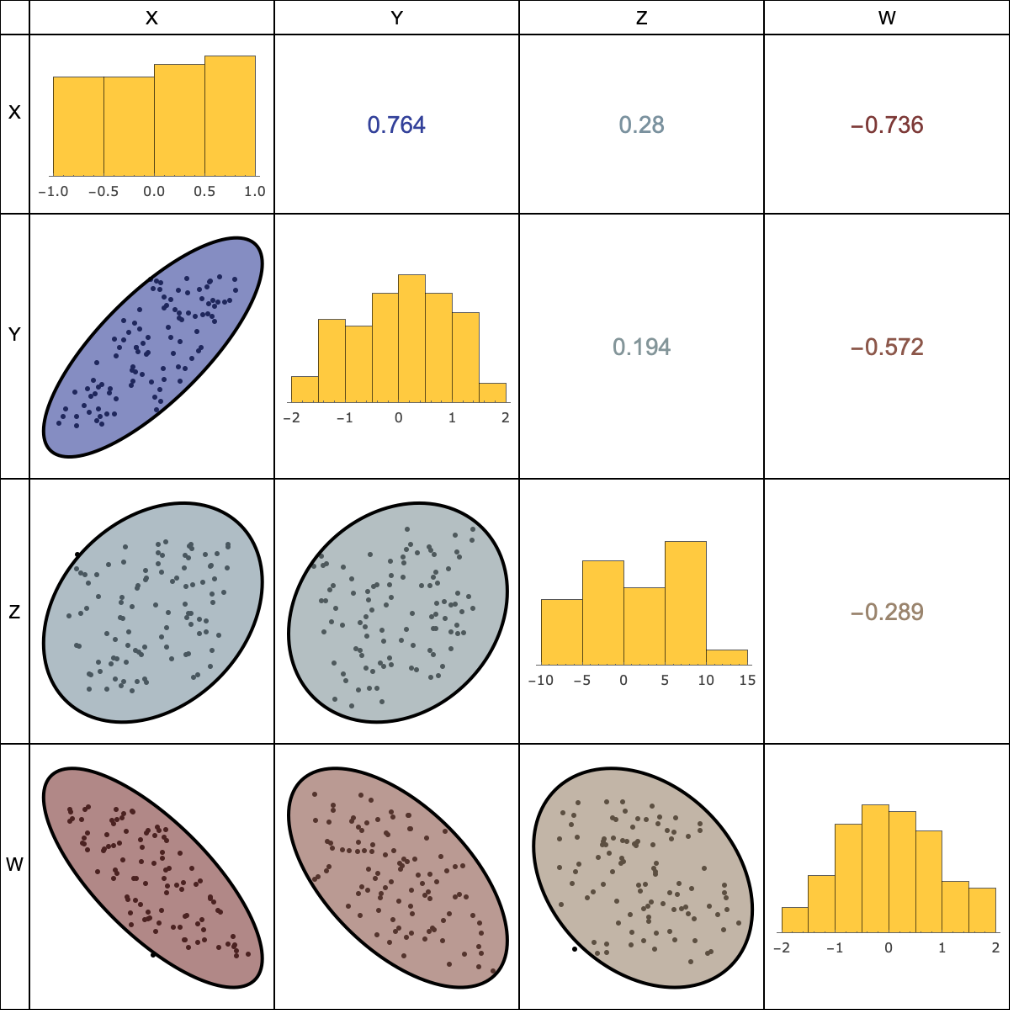 |
Remove colors representing correlation values:
| In[16]:= |
| Out[16]= | 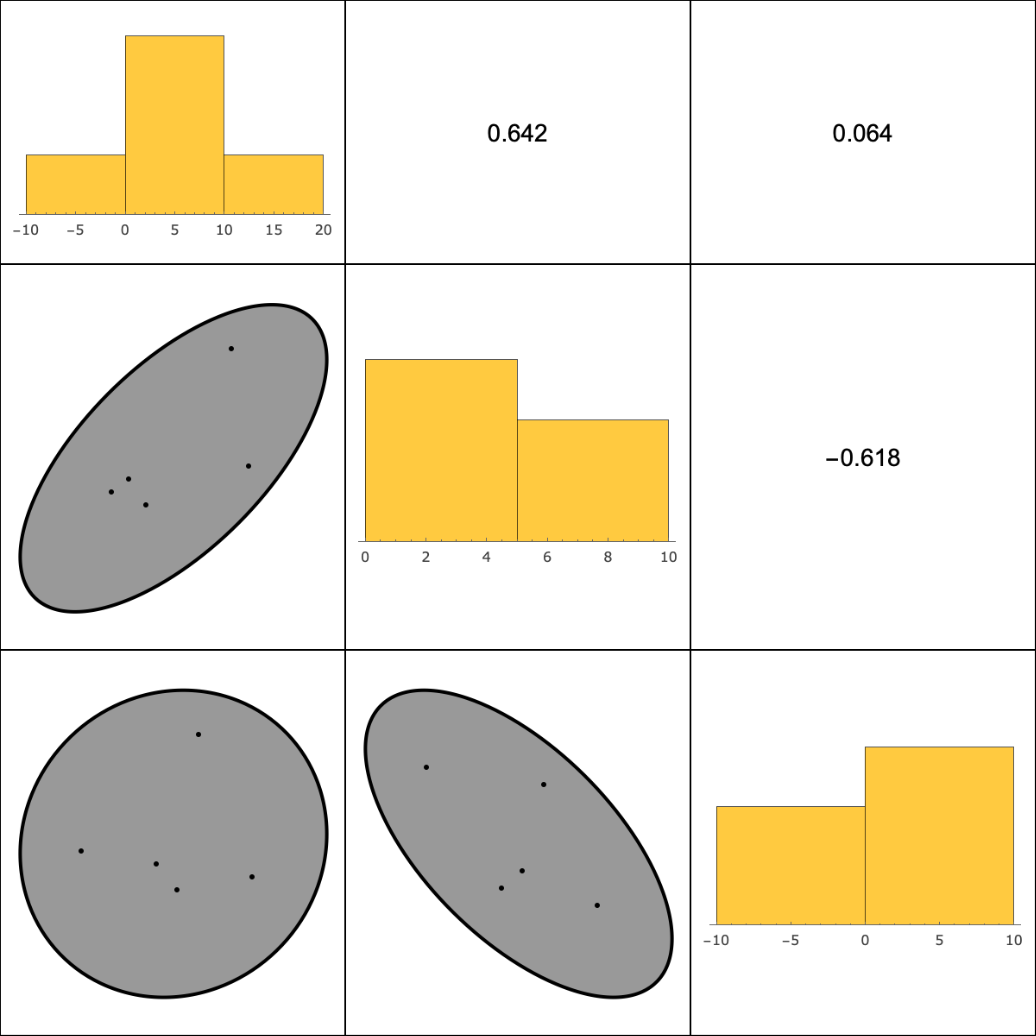 |
Remove points from ellipses:
| In[17]:= |
| Out[17]= | 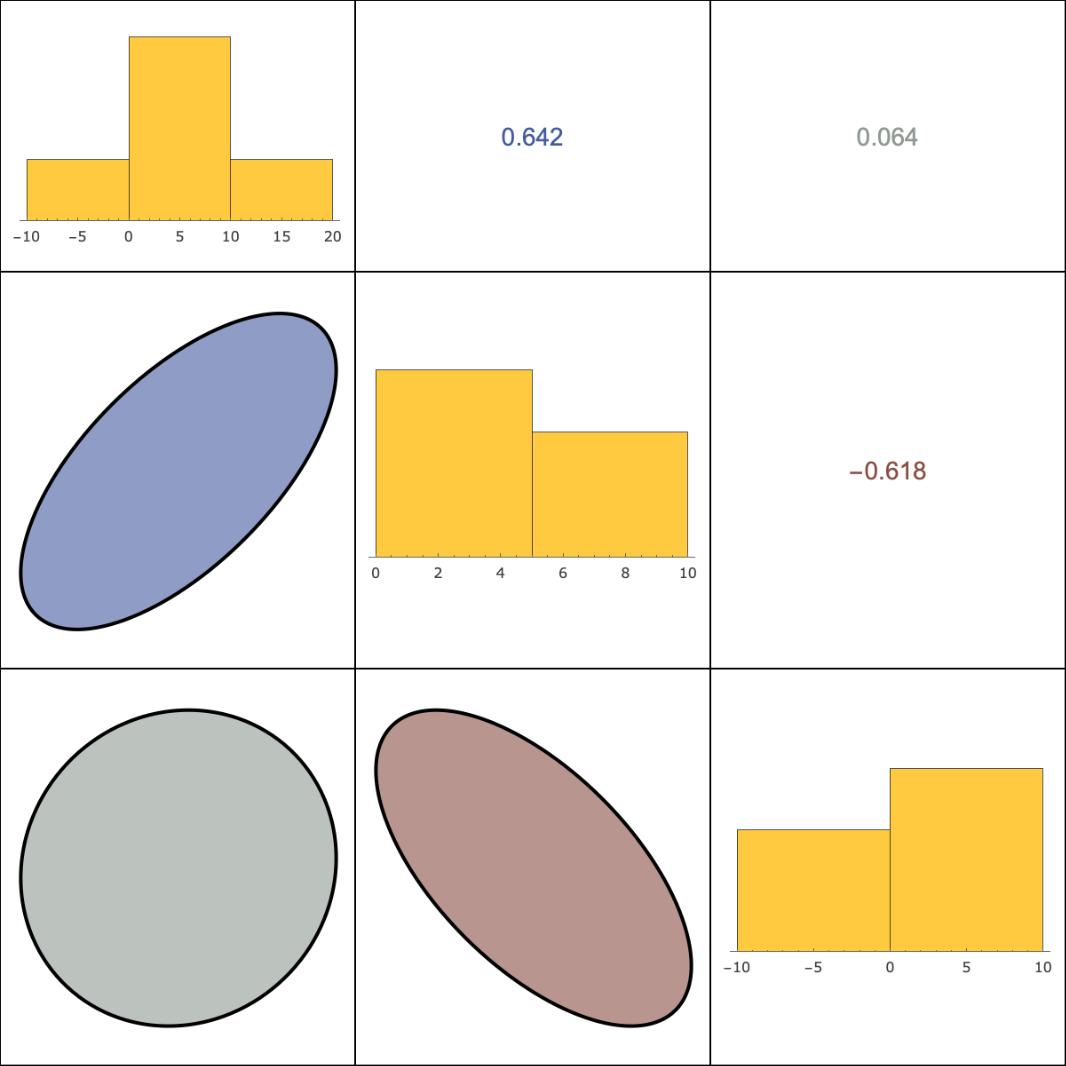 |
Get area, GDP and population density data from all countries:
| In[18]:= |
| Out[18]= | 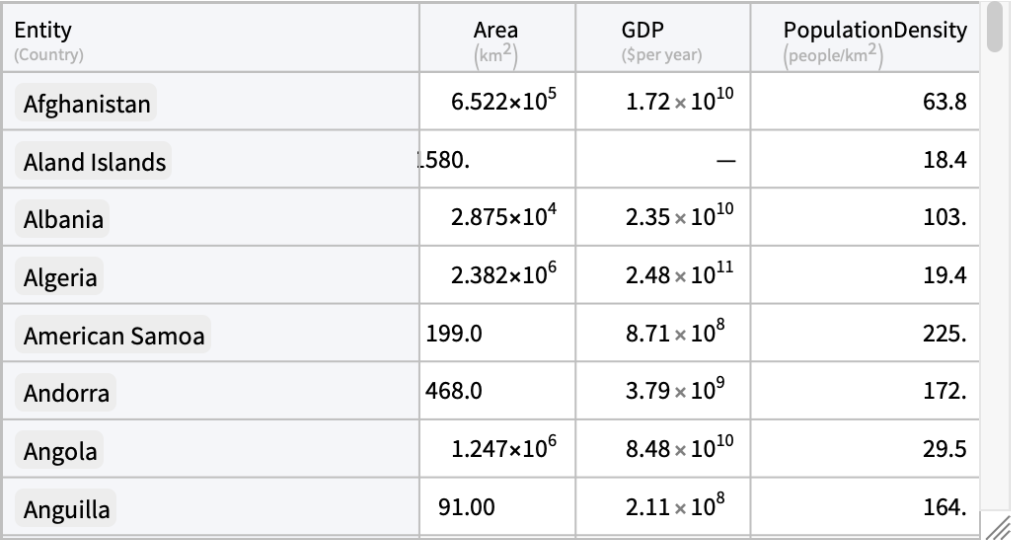 |
Generate a correlation chart from numerical values:
| In[19]:= |
| Out[19]= | 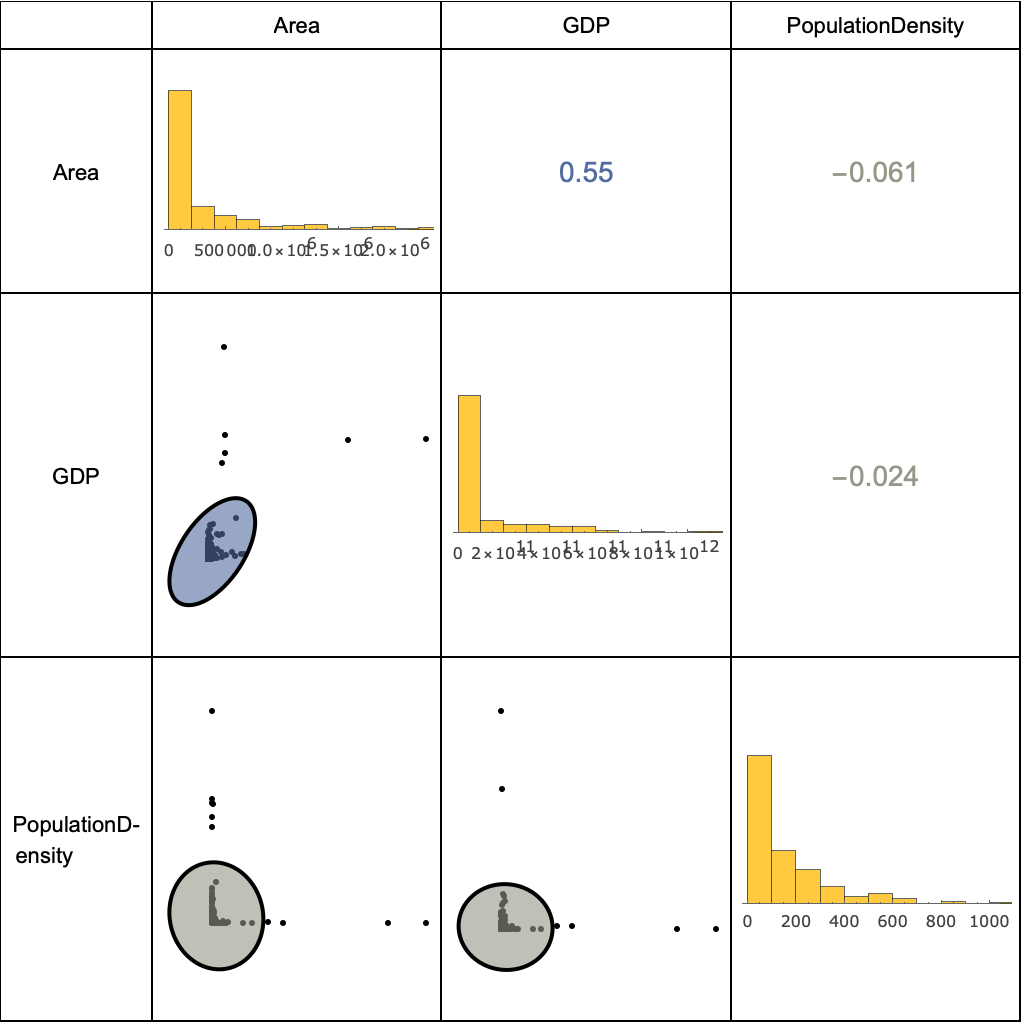 |
Get flower data from the Fisher's iris dataset:
| In[20]:= |
| Out[20]= | 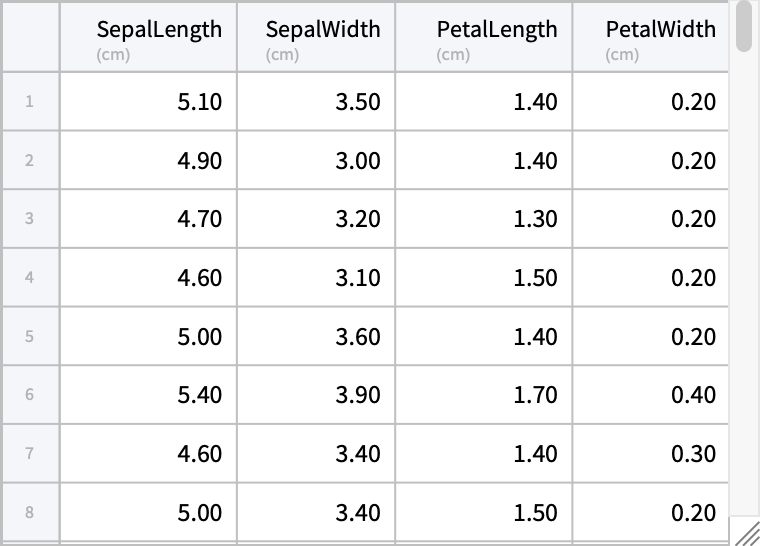 |
Visualize their correlations:
| In[21]:= |
| Out[21]= | 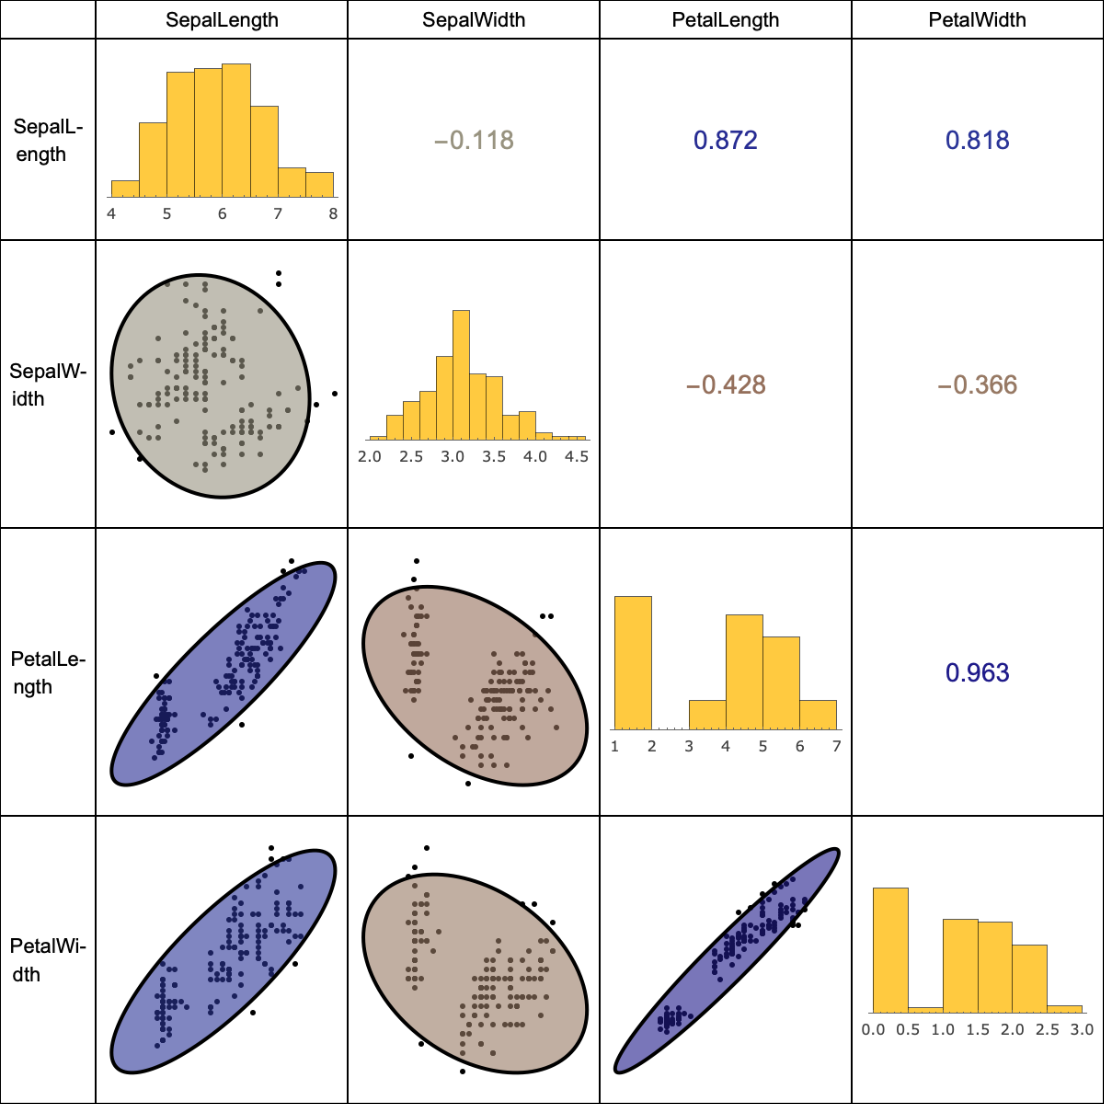 |
Input data must be of numeric or Quantity types:
| In[22]:= |
| Out[22]= |
ChartLabels must match the number of columns in the data:
| In[23]:= |
| Out[23]= |
Get monthly stock price data for a variety of companies:
| In[24]:= | ![stocks = {"AAPL", "MSFT", "NOK", "GOOG", "KO", "META", "AMZN", "XOM"};
stocksData = AssociationThread[
stocks -> (FinancialData[#, "Close", {{2022, 1, 1}, Today, "Month"}][
"Values"] & /@ stocks)];](https://www.wolframcloud.com/obj/resourcesystem/images/bd1/bd1db2d7-7b12-4c22-b9fc-46ea96cd85ce/40d0577421bf232e.png) |
Visualize how they correlate:
| In[25]:= |
| Out[25]= | 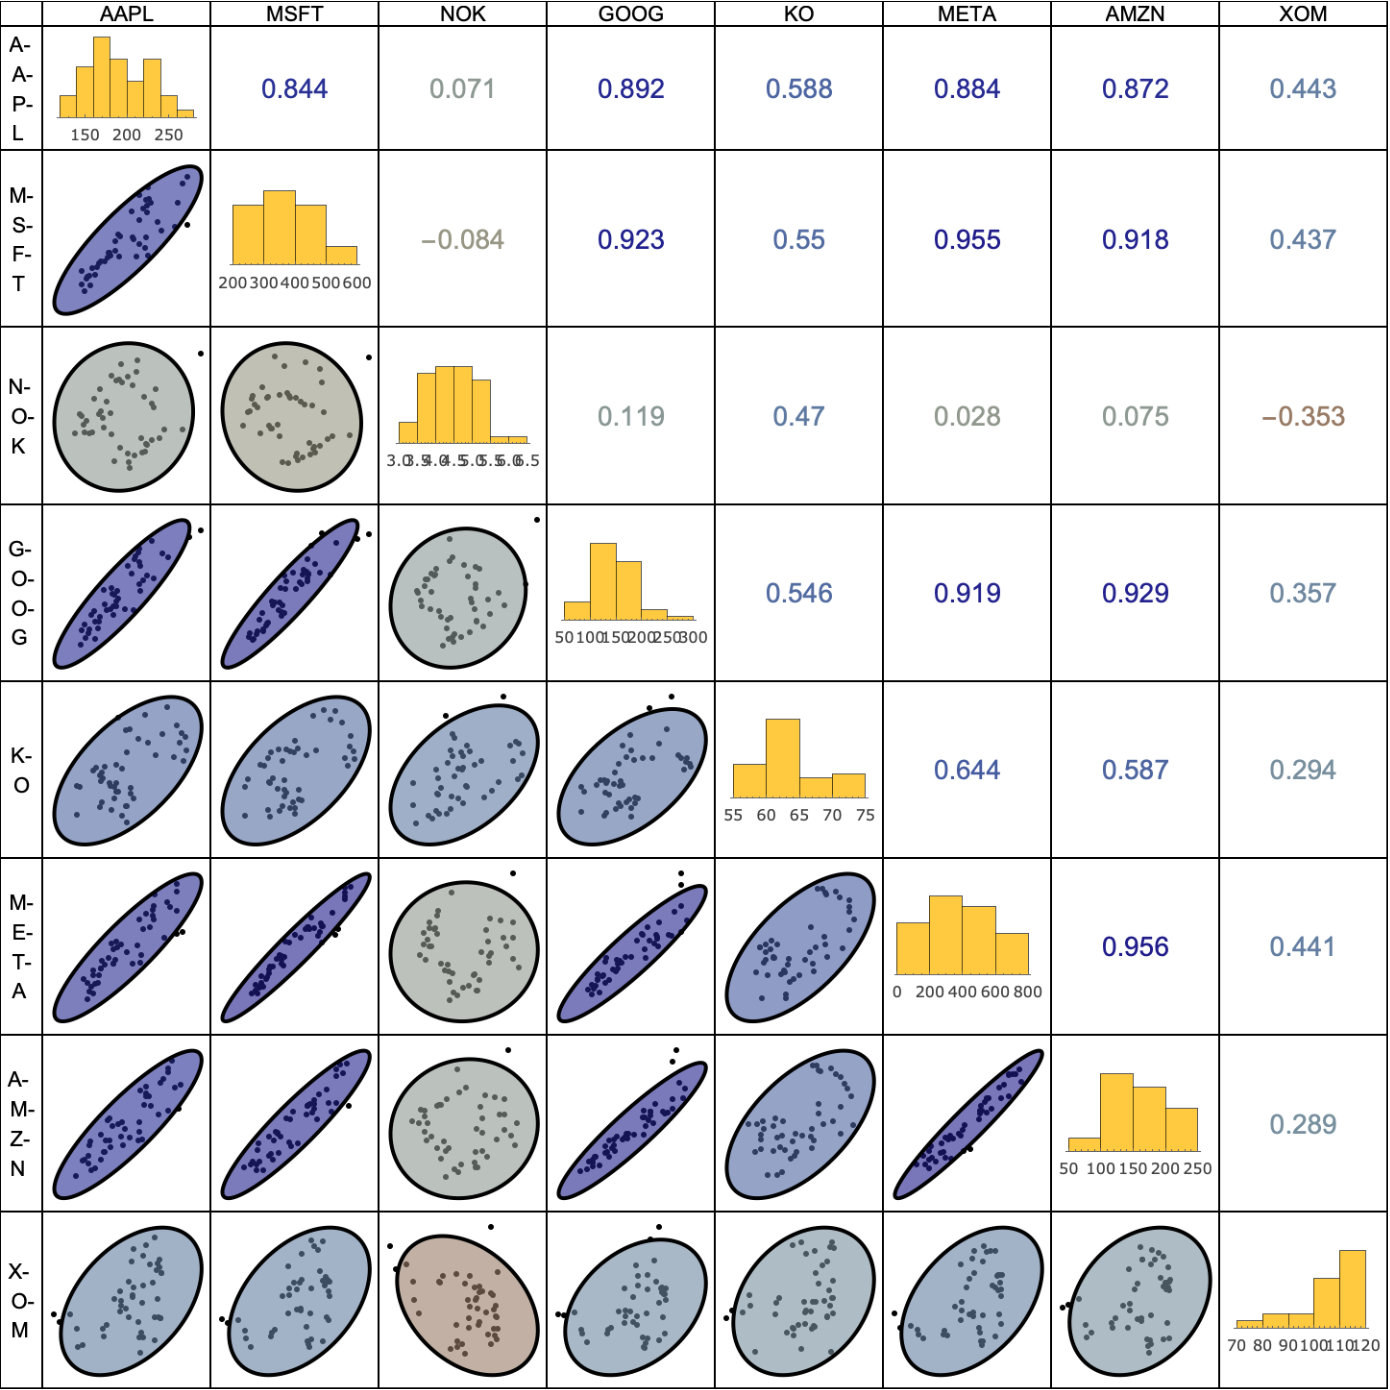 |
This work is licensed under a Creative Commons Attribution 4.0 International License