Basic Examples (5)
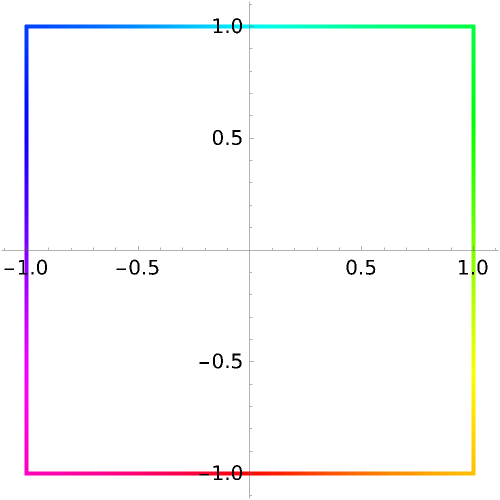
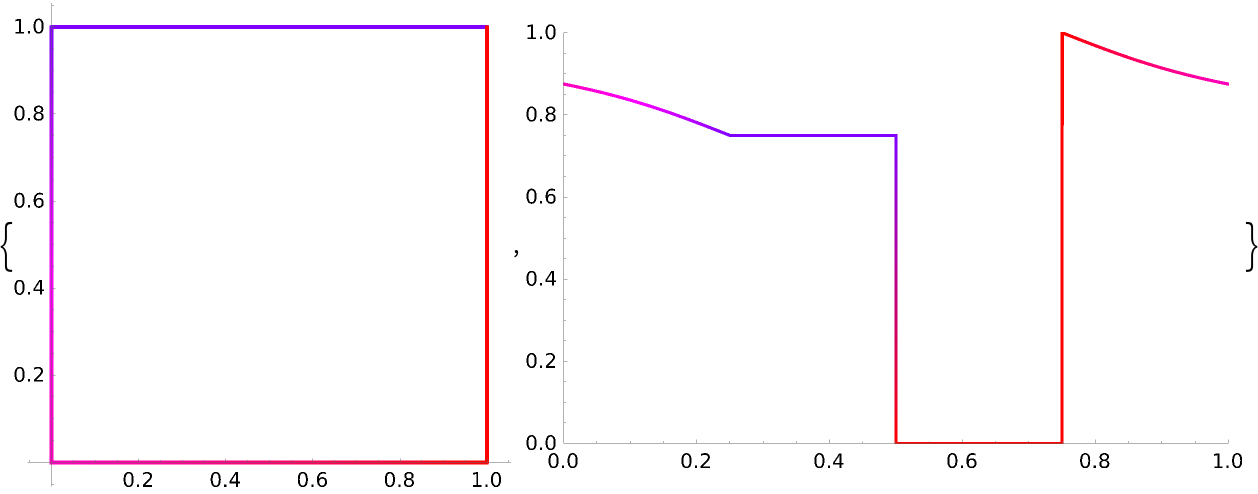
After the identity mapping is applied, the domain coloring of the unit square centered at the origin winds around the color wheel once:
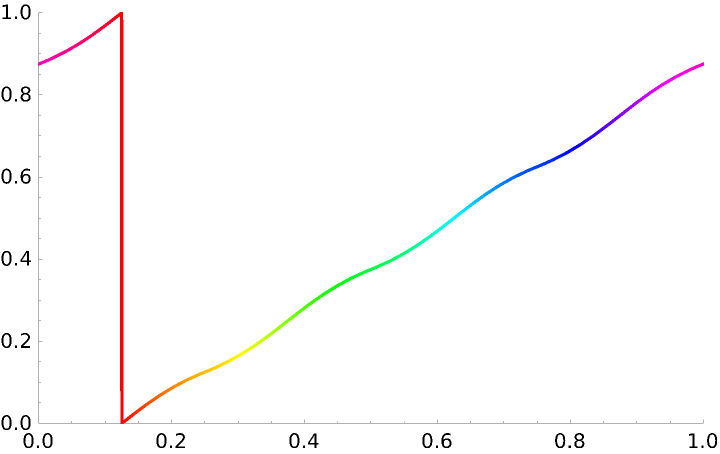
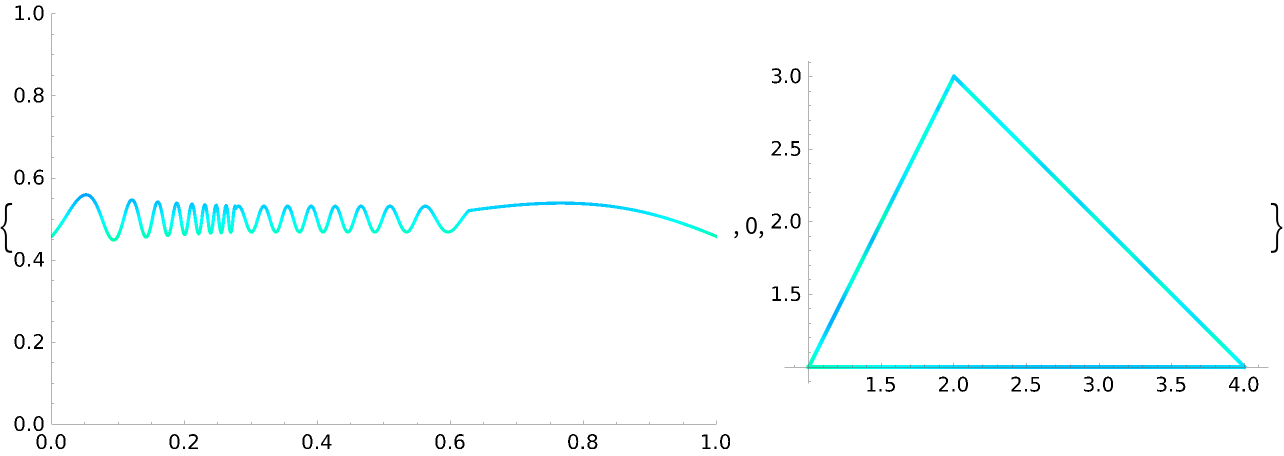
The domain coloring along this curve can be visualized:
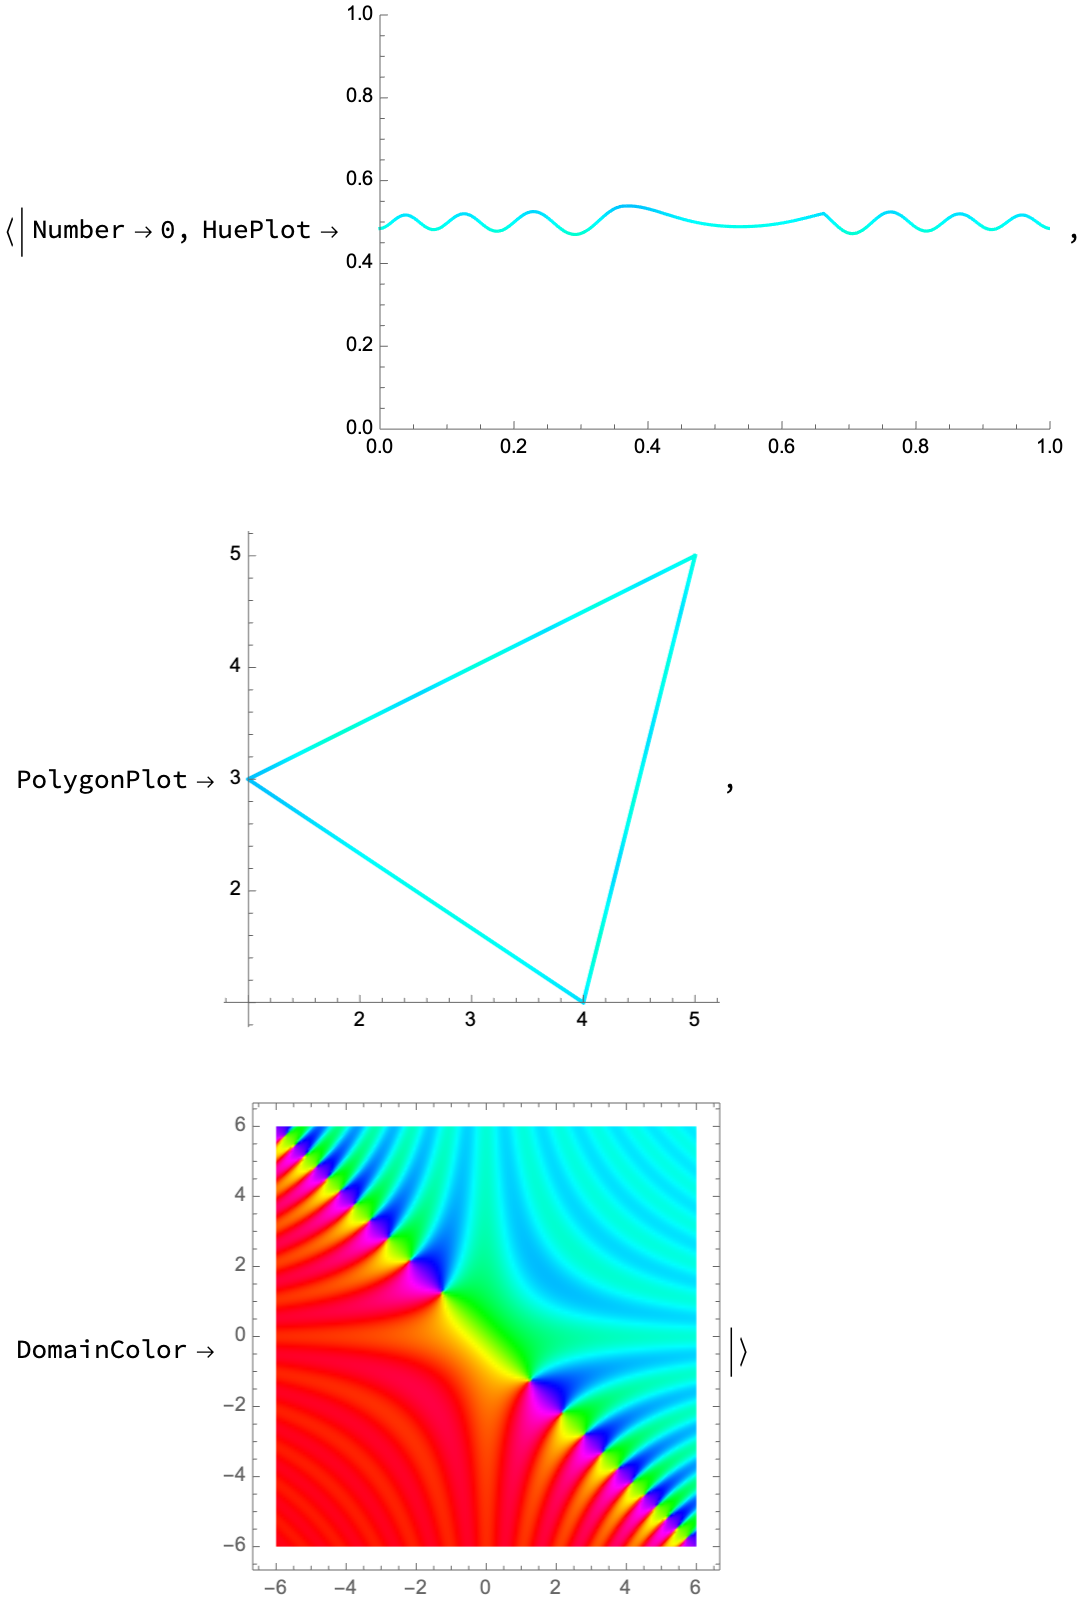
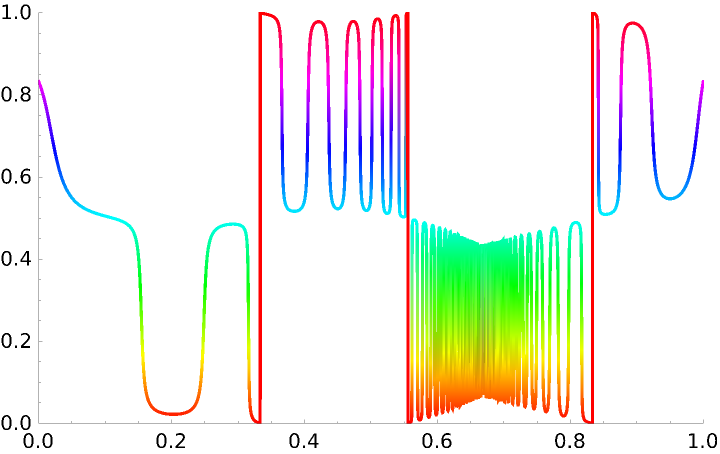
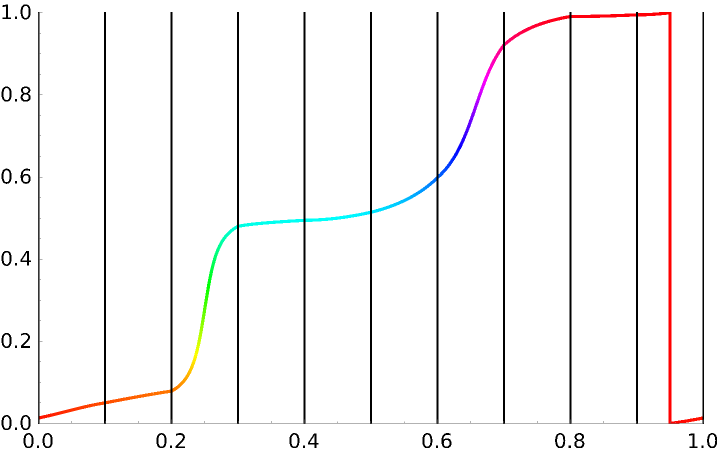
The "HuePlot" output plots the domain coloring Hue value along the curve:
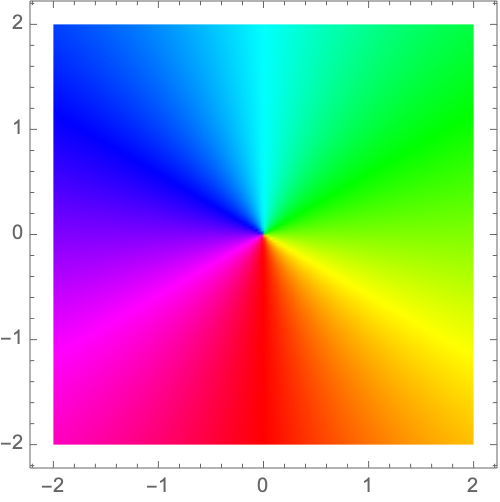
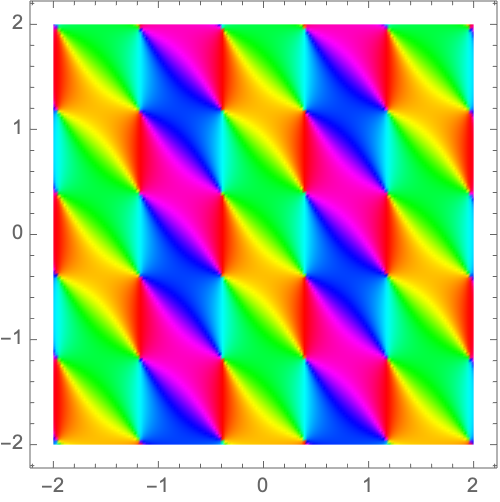
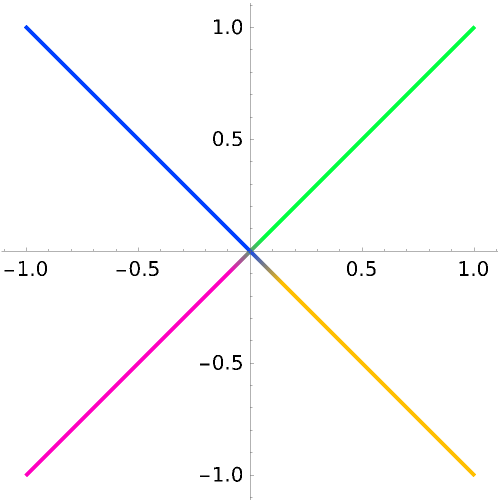
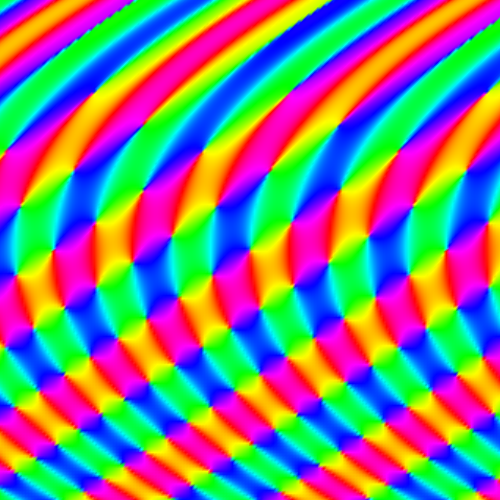
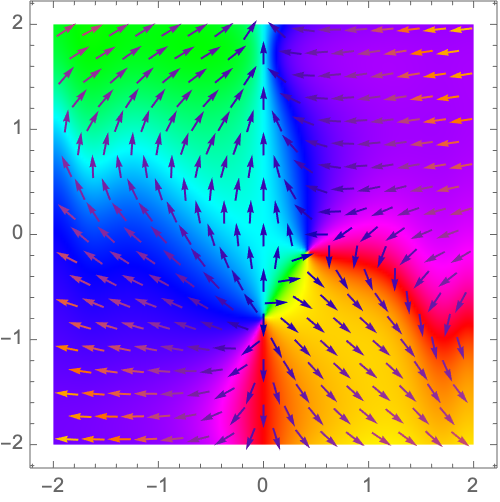
Over the entire plane, the domain coloring of the identity mapping preserves the color wheel centered at the origin:
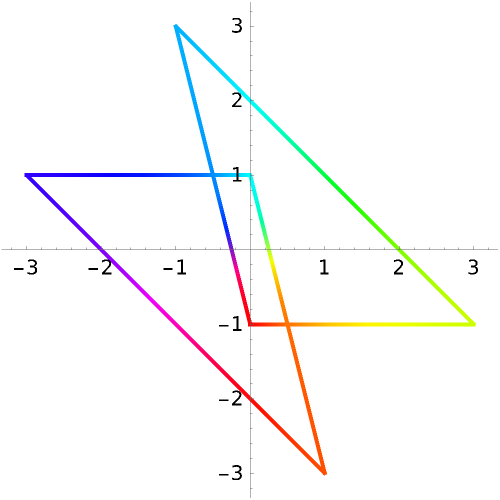
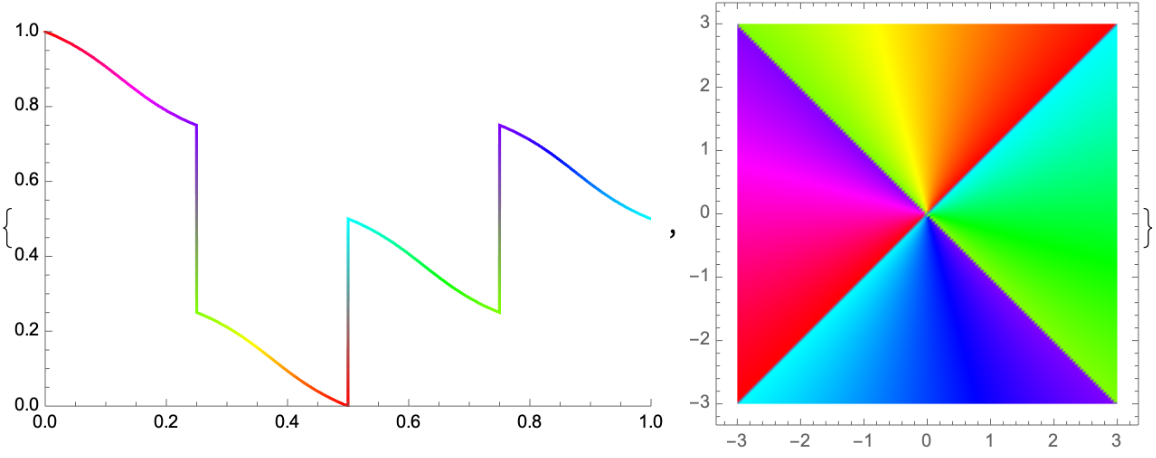
If the order of the points is reversed, the winding number is negated:
Scope (4)
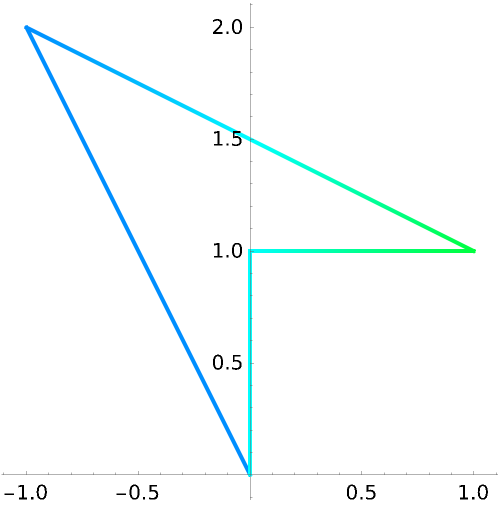
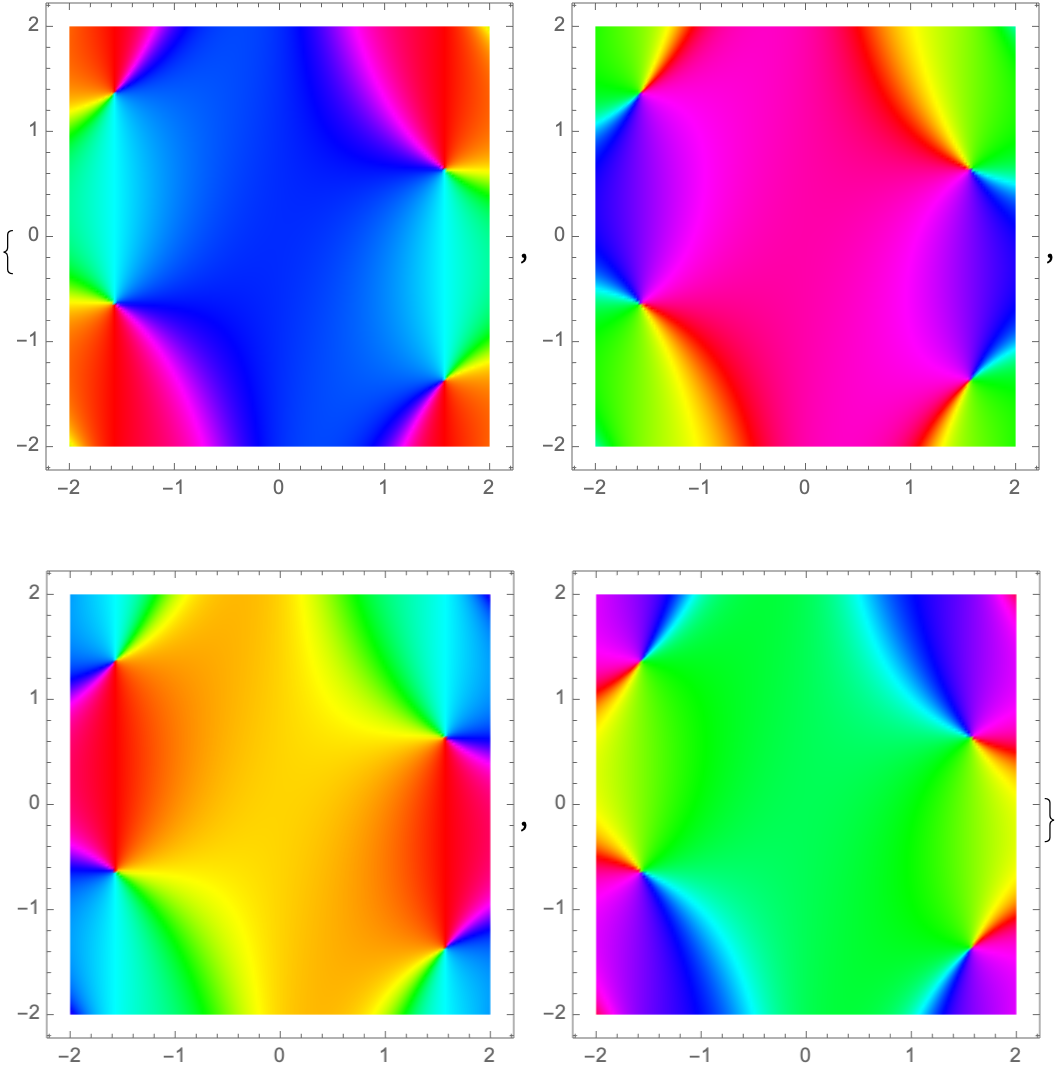
Each 2D transformation produces its own domain coloring:
Specify a collection of curves:
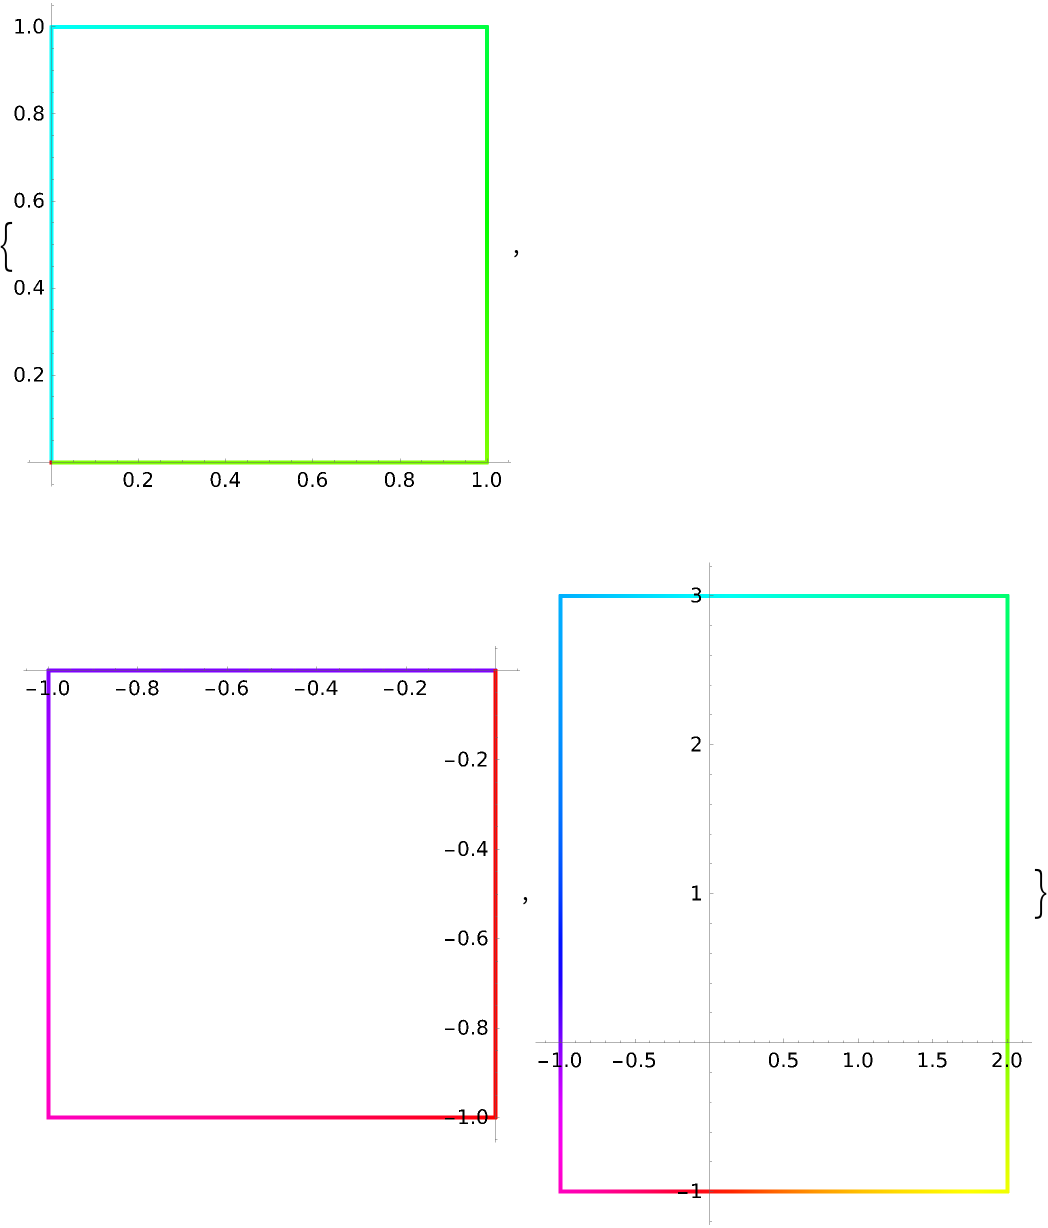
All forms of Rectangle are recognized as valid lists of points:
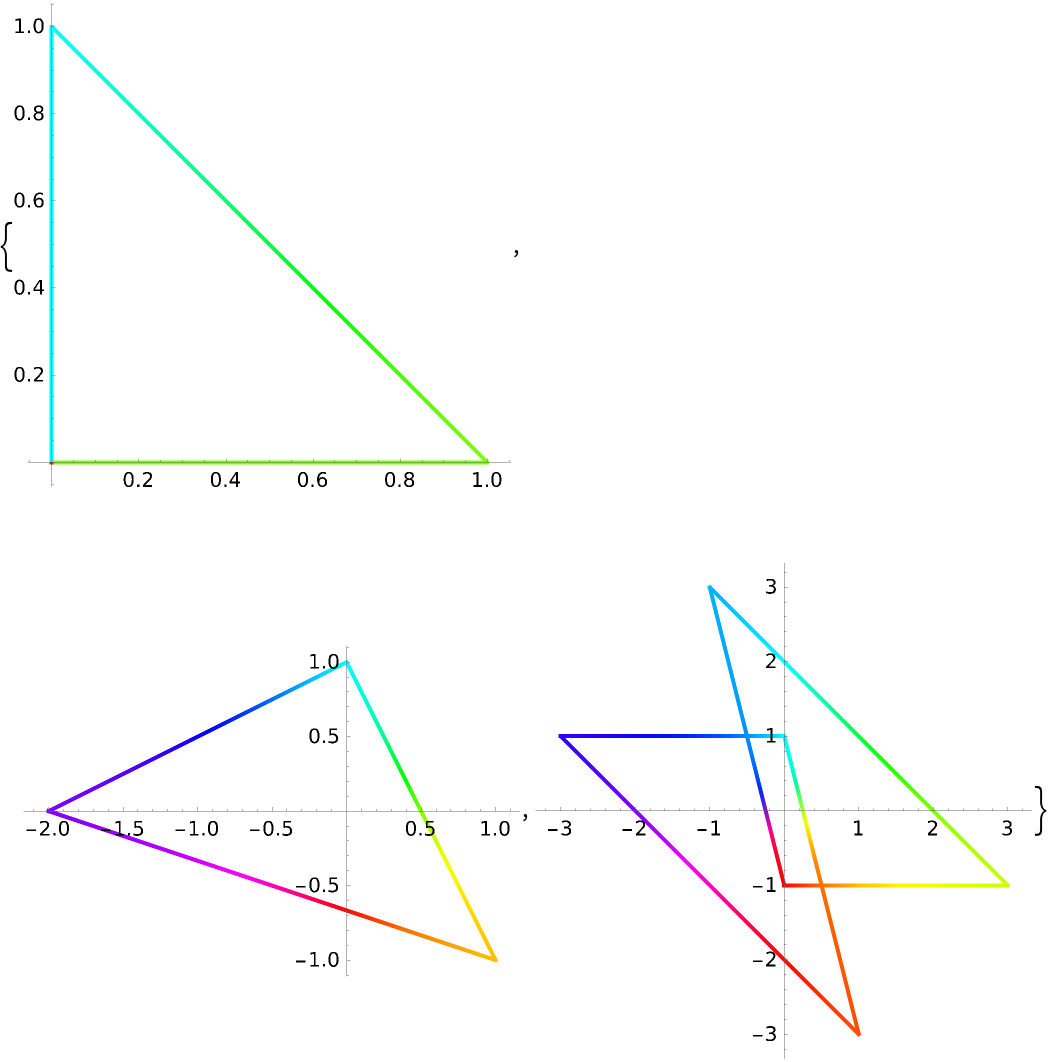
All forms of Triangle are also supported:
The heads Polygon and Line are supported:
Multiple output types can be selected in a list and their input order is reflected in the output:
If All is used as the output type, the function returns an Association:
Options (5)
Determine if the list of points defines a closed curve:
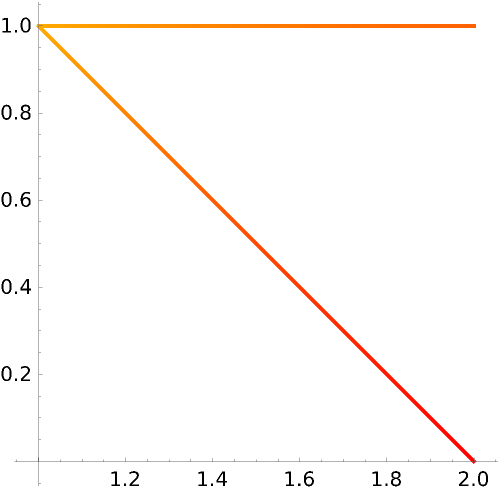
The "IterationLength" option determines how frequently the Hue value is sampled along the curve, which produces more accurate results:
The actual winding number is -1, as seen by inspecting the jumps in the below plot:
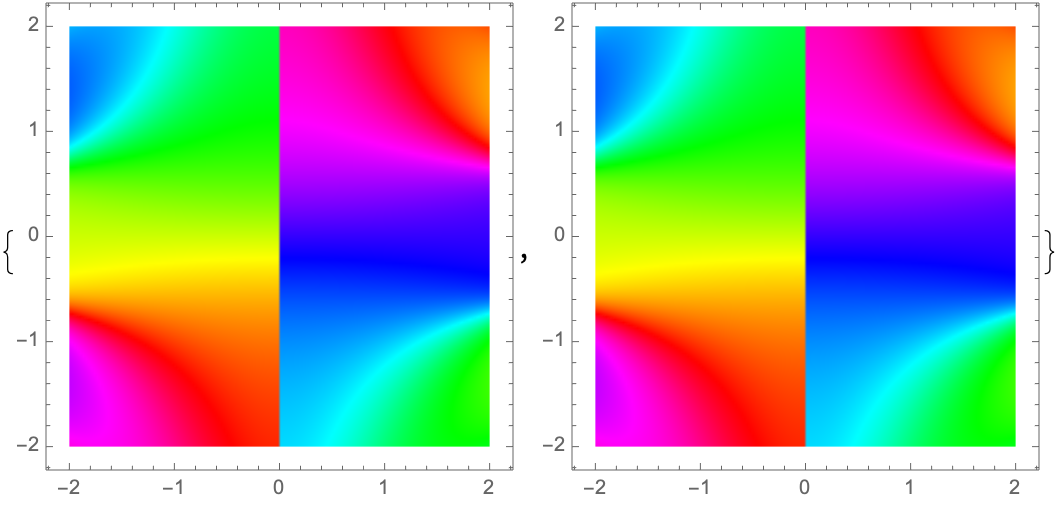
The color wheel can be shifted by a selected amount:
Only the decimal value affects the hue shift:
The value of "IterationLength" determines how frequently the Hue value is sampled, as visualized below:
The options for ParametricPlot are also supported:
Applications (5)
For continuous transformations, any closed curve with a nonzero winding number contains a zero of the transformation:
If a boundary with nonzero winding number is halved, one half must also have a nonzero winding number:
Locate the zero by repeatedly decreasing the boundary size, ignoring areas where the winding number is zero:
The resulting boundary after repeating for a total of 10 times:
The midpoints of the boundaries approach a zero of the transformation:
Properties and Relations (2)
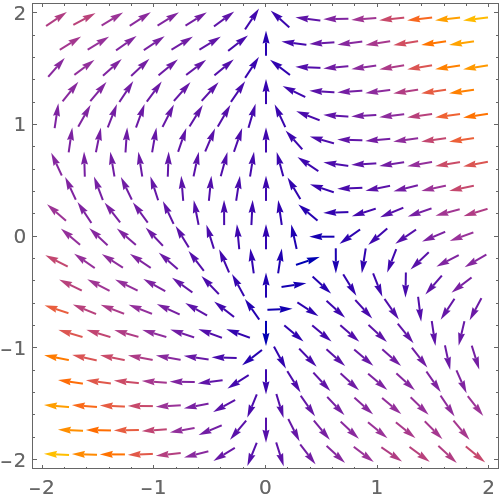
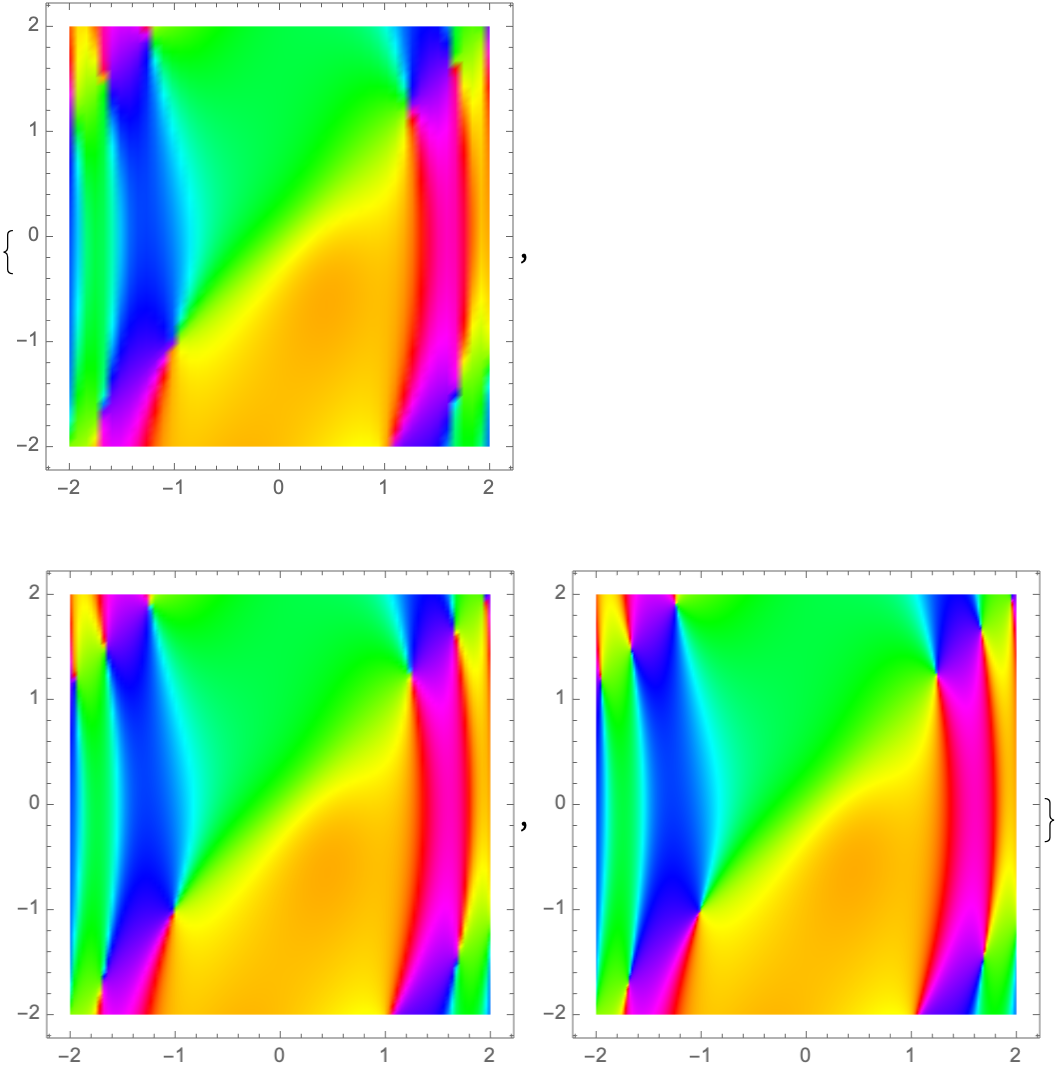
Vector plots provide another visualization of 2D transformations:
Shown together, the similarities between vector plots and domain coloring become apparent:
Possible Issues (3)
Discontinuities may occur in the color winding of a curve passing through a zero of the transformation:
A similar effect occurs for a curve passing though any asymptotes of the transformation:
Low values of the "IterationLength" option may produce inaccurate results:
Increasing the value of PlotPoints improves the resolution of the domain coloring:
Neat Examples (4)
Create neat shapes by overlapping several domain coloring curves:
Visualize how changing the transformation alters the domain coloring:
Draw the domain coloring using a collection of triangular boundaries:
Find the winding number along famous curves:
![ResourceFunction["ColorWinding"][{x, y}, {x, y}, #, "PolygonPlot"] & /@ {Triangle[], Triangle[{{-2, 0}, {0, 1}, {1, -1}}], Triangle[{{{0, -1}, {3, -1}, {-1, 3}}, {{-3, 1}, {1, -3}, {0, 1}}}]}](https://www.wolframcloud.com/obj/resourcesystem/images/fb9/fb91b9dc-fd5d-4fa3-a31e-c0ee7904ecc5/38043efefa3d684e.png)
![Table[ResourceFunction[
"ColorWinding"][{Sin[x*y], Sin[23/(1 + x)]}, {x, y}, Polygon[CirclePoints[3]], "IterationLength" -> 10^-k], {k, 0, 4}]](https://www.wolframcloud.com/obj/resourcesystem/images/fb9/fb91b9dc-fd5d-4fa3-a31e-c0ee7904ecc5/6154147afb4b6603.png)
![Show[ResourceFunction[
"ColorWinding"][{Cos[x + y]*x, 3 y - x^2}, {x, y}, CirclePoints[10],
"HuePlot", "IterationLength" -> 1/10], Graphics[Table[Line[{{k, 0}, {k, 1}}], {k, 0, 1, 1/10}]]]](https://www.wolframcloud.com/obj/resourcesystem/images/fb9/fb91b9dc-fd5d-4fa3-a31e-c0ee7904ecc5/3d2d11acfd25e3fd.png)
![ResourceFunction[
"ColorWinding"][{Sin[5 x - y^2], Sin[3 y - 2 x]}, {x, y}, "DomainColor", PlotRange -> 4, Frame -> False, PlotPoints -> 200]](https://www.wolframcloud.com/obj/resourcesystem/images/fb9/fb91b9dc-fd5d-4fa3-a31e-c0ee7904ecc5/408f4b2d40bd1ac3.png)
![Table[ResourceFunction[
"ColorWinding"][{Sin[5 x - y^2], Sin[3 y - 2 x]}, {x, y}, {{-2, -1}, {-2, -5}, {4, 2}}, "IterationLength" -> 10^(-k)], {k, 1, 4}]](https://www.wolframcloud.com/obj/resourcesystem/images/fb9/fb91b9dc-fd5d-4fa3-a31e-c0ee7904ecc5/56200a7478c9dff2.png)
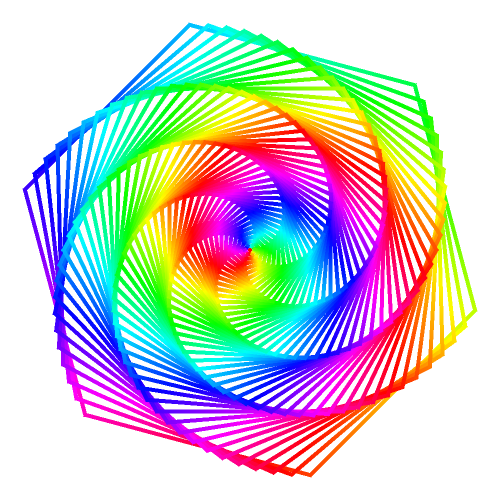
![Show[Table[
ResourceFunction["ColorWinding"][{x, y}, {x, y}, CirclePoints[{k, k*\[Pi]/4}, 6], "PolygonPlot", "HueShift" -> k/5, Axes -> False], {k, 5, 0, -1/10}]]](https://www.wolframcloud.com/obj/resourcesystem/images/fb9/fb91b9dc-fd5d-4fa3-a31e-c0ee7904ecc5/6b44e96843fef762.png)
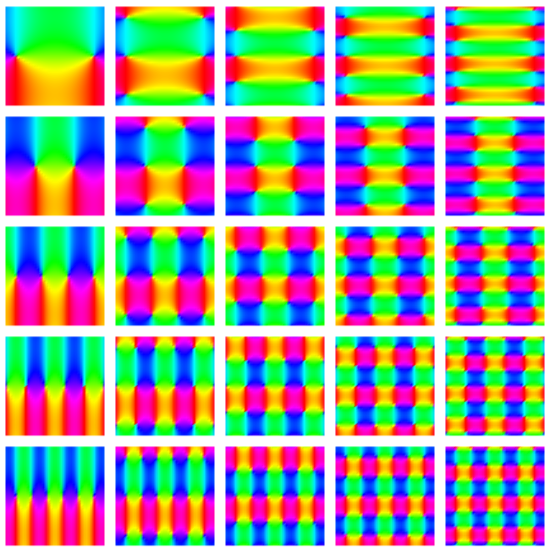
![TableForm[
Array[ResourceFunction[
"ColorWinding"][{Cos[#1 x], Sin[#2 y]}, {x, y}, "DomainColor", ImageSize -> 55, Frame -> False, PlotPoints -> 40] &, {5, 5}, {1, 1}], TableSpacing -> {0, 0}]](https://www.wolframcloud.com/obj/resourcesystem/images/fb9/fb91b9dc-fd5d-4fa3-a31e-c0ee7904ecc5/17031bcfde81e94b.png)
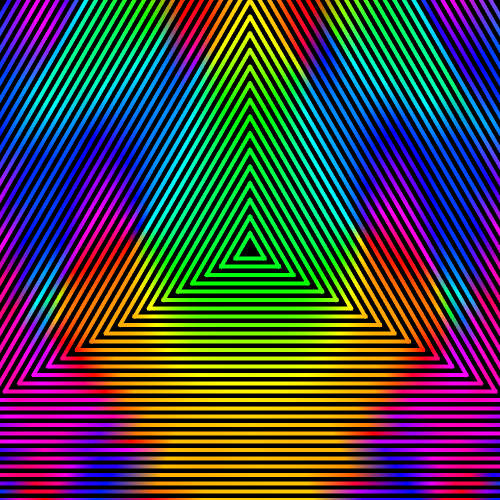
![Show[Table[
ResourceFunction[
"ColorWinding"][{Cos[x + Sin[x*y]], Sin[y + Cos[x^2]]}, {x, y}, CirclePoints[k, 3], "PolygonPlot", PlotRange -> 3, Axes -> False, Background -> Black], {k, 0.2, 8, 0.2}]]](https://www.wolframcloud.com/obj/resourcesystem/images/fb9/fb91b9dc-fd5d-4fa3-a31e-c0ee7904ecc5/0a6f2e52d270f6bc.png)
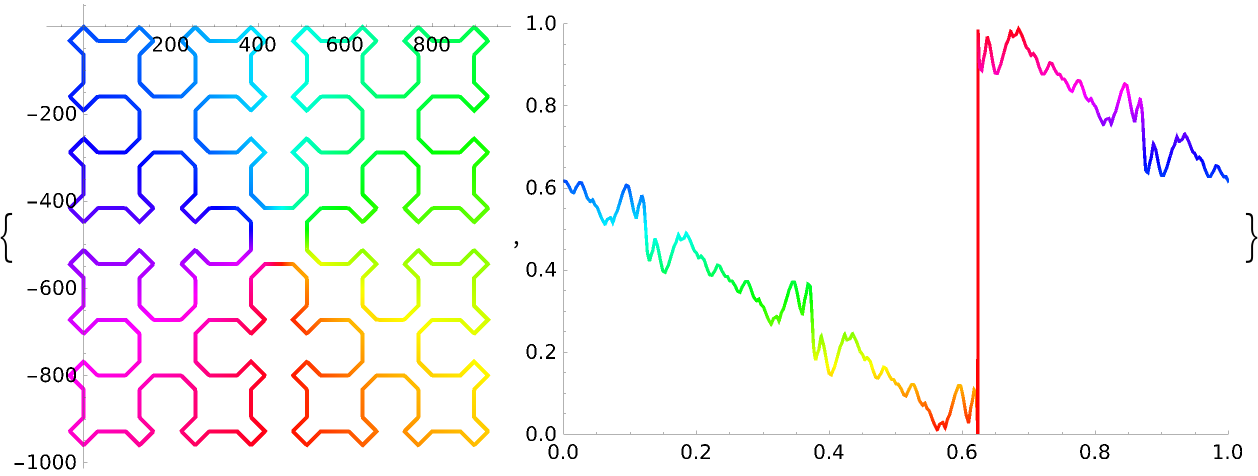
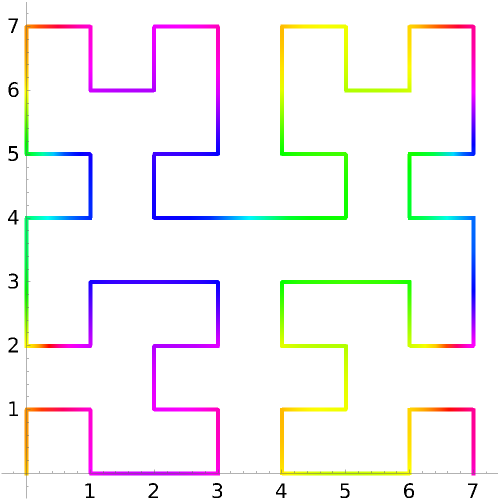
![ResourceFunction["ColorWinding"][{2 Sin[x - 3.5], Cos[y - 4]}, {x, y},
HilbertCurve[3], "PolygonPlot", "ClosedCurve" -> False]](https://www.wolframcloud.com/obj/resourcesystem/images/fb9/fb91b9dc-fd5d-4fa3-a31e-c0ee7904ecc5/73adbf846132f52c.png)