Wolfram Function Repository
Instant-use add-on functions for the Wolfram Language
Function Repository Resource:
Interactively substitute colors in a graphic
ResourceFunction["ColorChanger"][gr] creates a dynamic interface for changing the most common colors in a Graphics or Graphics3D object. | |
ResourceFunction["ColorChanger"][gr,n] makes the n most common colors changeable. |
Create a color changer for a plot:
| In[1]:= |
| Out[1]= | 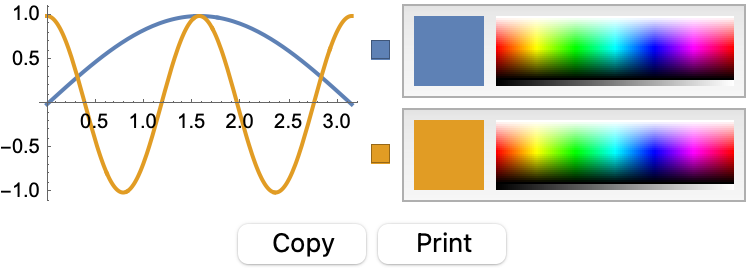 |
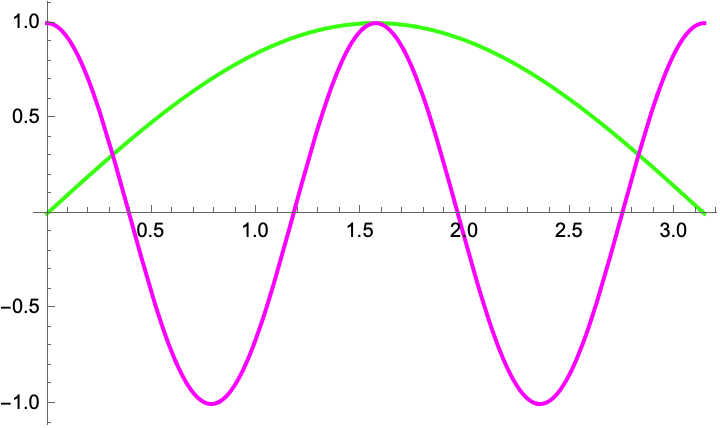
Change a color and use the Print button:
| Out[2]= | 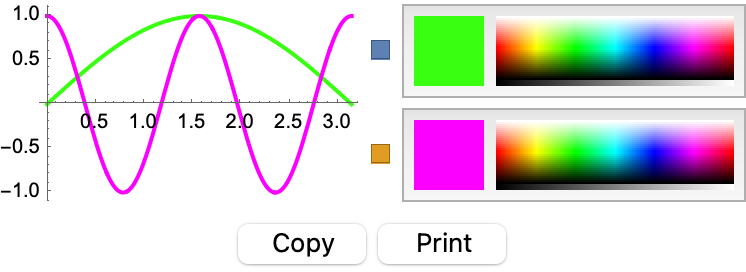 |
A ListPlot with three colors:
| In[3]:= |
| Out[3]= | 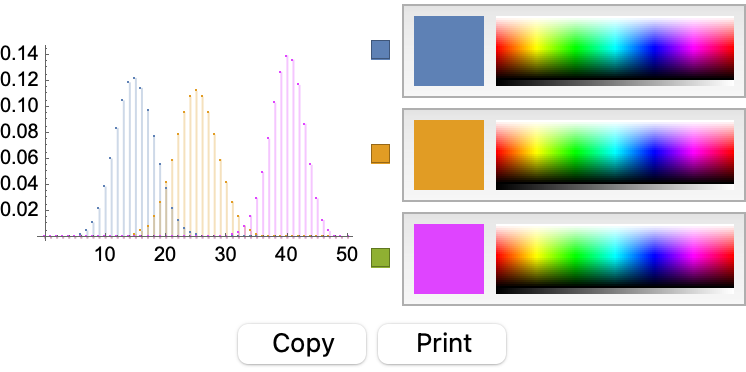 |
Modify colors of a graph in 3D:
| In[4]:= |
| Out[4]= | 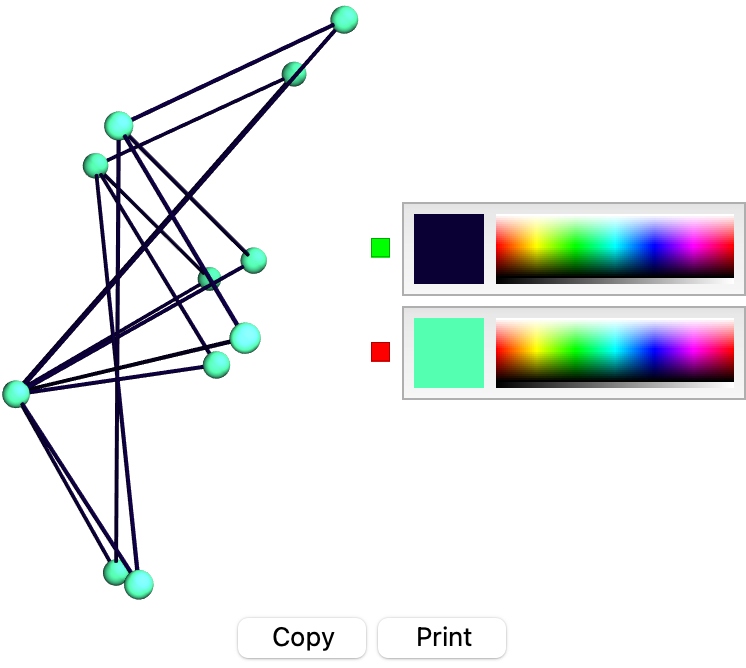 |
This work is licensed under a Creative Commons Attribution 4.0 International License