Wolfram Function Repository
Instant-use add-on functions for the Wolfram Language
Function Repository Resource:
Visualize one-dimensional iterated functions
ResourceFunction["CobwebPlot"][f,x0,n,{a,b}] plots the real function f along with the diagonal line over the range a to b and, starting from x0, computes n iterates of the function, reflecting each iteration of the function in the diagonal line. |
Display a cobweb plot of 10 iterations of the map ![]() starting at x0=2:
starting at x0=2:
| In[1]:= |
| Out[1]= | 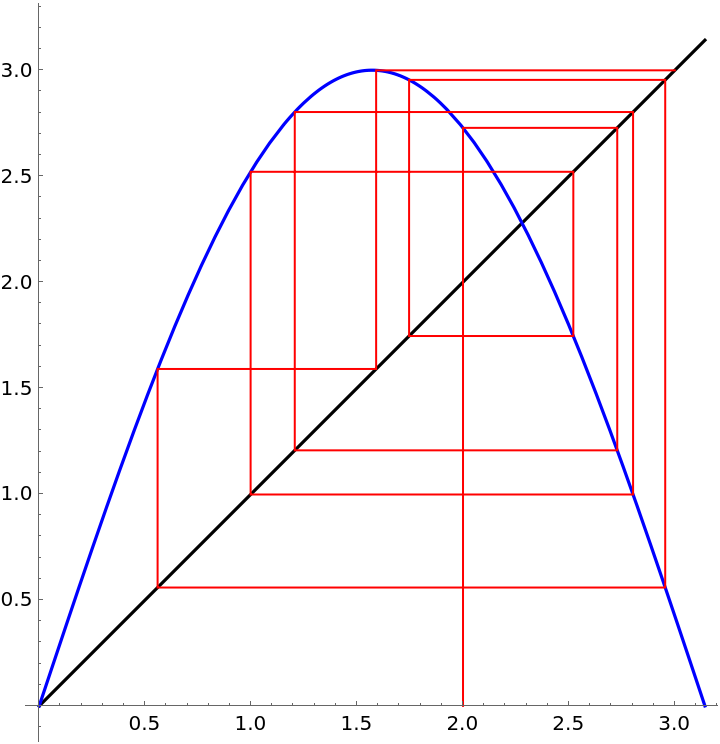 |
Show the cobweb as a dashed red line:
| In[2]:= |
| Out[2]= | 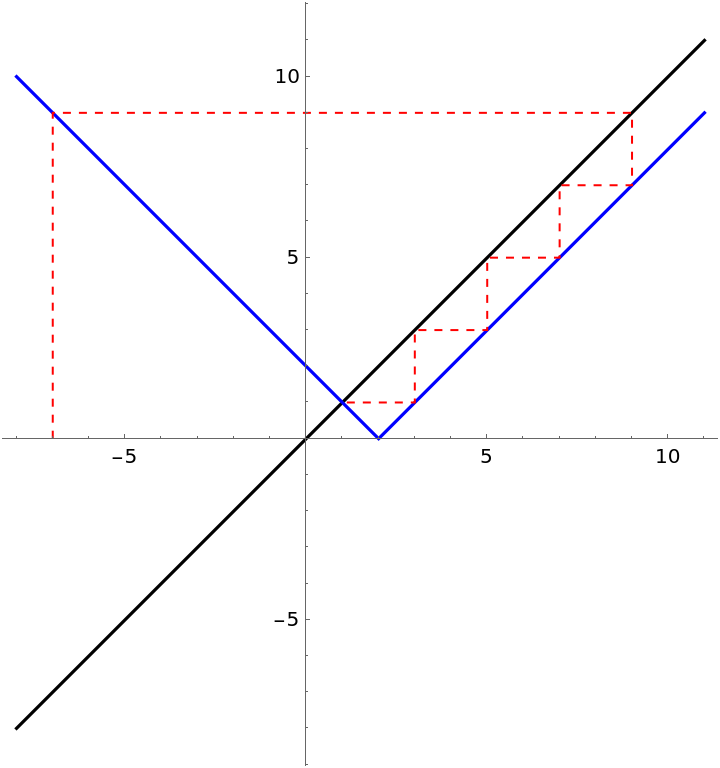 |
For the logistic map, xn+1:=α xn(1-xn), display the cobweb plot of ![]() , varying the parameter α, the starting value x0 and the number of iterations n:
, varying the parameter α, the starting value x0 and the number of iterations n:
| In[3]:= | ![Manipulate[
ResourceFunction["CobwebPlot"][x |-> \[Alpha] x (1 - x), Subscript[x,
0], n, {0, 1}, AspectRatio -> Automatic, Frame -> True, Axes -> True, PlotRange -> {{0, 1}, {-0.06, 1.05}}, GridLines -> Automatic, Epilog -> Text["\!\(\*SubscriptBox[\(x\), \(0\)]\)", {Subscript[x, 0], -0.05}]], {\[Alpha], 3, 4, 0.01}, {{Subscript[x, 0], 0.2}, 0.0001, 1}, {{n, 60}, 1, 200, 1}]](https://www.wolframcloud.com/obj/resourcesystem/images/cf5/cf51482f-bd01-4b17-9f74-1a37759a62b1/383ba0ebef4aabd6.png) |
| Out[3]= | 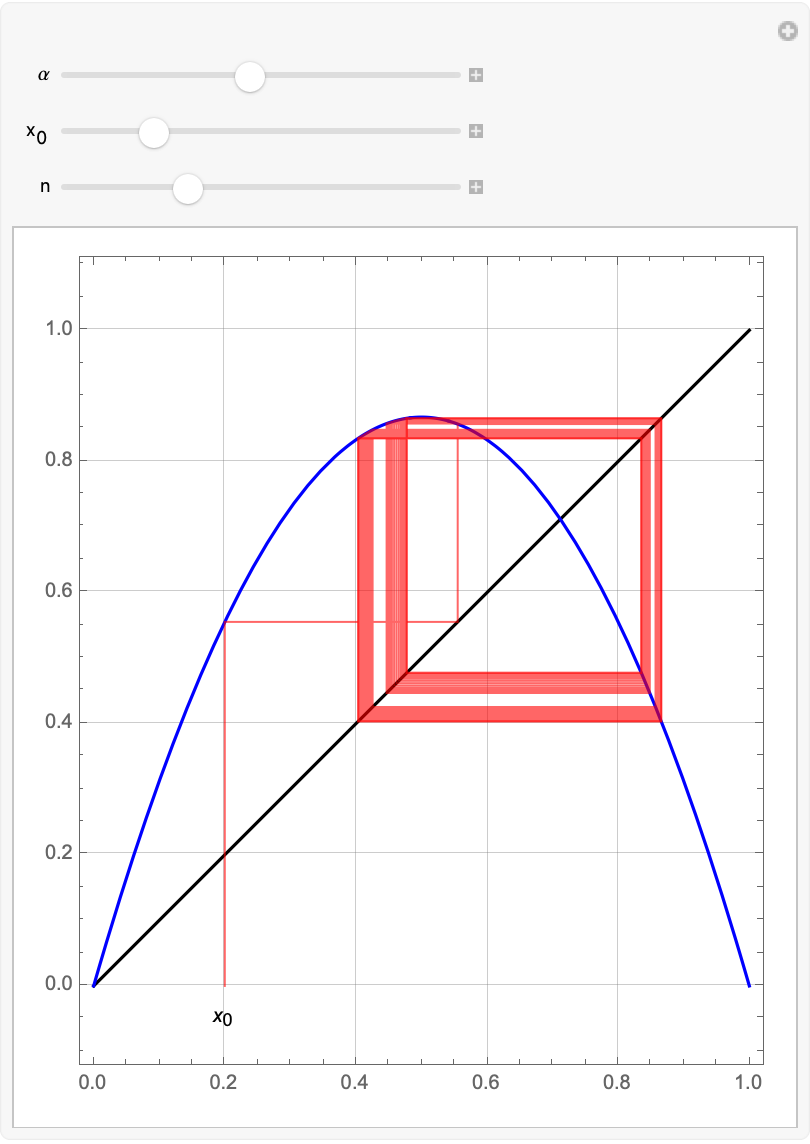 |
Display the logistic map along with the associated Feigenbaum diagram:
| In[4]:= | ![Manipulate[
GraphicsColumn[
{ResourceFunction["CobwebPlot"][x |-> \[Alpha] x (1 - x), Subscript[
x, 0], n, {0, 1}, AspectRatio -> Automatic, Frame -> True, Axes -> True,
PlotRange -> {{0, 1}, {-0.06, 1.05}},
ImageSize -> 300,
GridLines -> Automatic, Epilog -> Text["\!\(\*SubscriptBox[\(x\), \(0\)]\)", {Subscript[x, 0], -0.05}]],
Graphics[
{Raster[ImageData@\!\(\*
GraphicsBox[
TagBox[RasterBox[CompressedData["
1:eJzsvVeTHFmW5zfkEx/5Ffgt+MpHvi6NH2DXOFyjGW1JztCW3O2ZneXMbPd0
97Tu0o1CVUHrTCRS69BaeHi41lprFcL9MjIjUaK7qrpqCkAmgPiZAQlERrjf
6/84956rzvnv/s3/8a/+1//6L/7iL/76v1n89a/+9f/zP/zVX/3r//A//beL
//zP/+6v/7d/++/+8n/5H//d//2X//Yv/+q//zdnb+MXf0r/1V/8BVjxGlLk
+fmPiDs9vOyyrPi+LNQrzn74SH3/o598eOeyy7Pi+1CciwdAjBys/+ZH+09r
vU/3L7lIK74zz9ULsf17v3vnvzy4eXTUqD97vHfJxVrxnSgu5PPg+s2f/vXt
d3968707t6/1Nj9uNrTLLtuKP8eF1wJ8tLf5zh9aP/70WnX9+Obtd6/deIT0
4MPhJRdvxbfy3PZ8pnTtVz/7bfOzm73rdw5OT44rh49Ka9u9Kt44vuQirvhG
imW3B0Li+N6v//0v39nfX3/6t8+sZ/+4UwEa8Qm9cas9bj9cVy+3lCu+nouW
c+JIxx//59/c/MOv3//ok8/utbt3D9TBE3WHpZ91ur29x4MHHx9Cl13WFX/M
5/0ex3Cj3s/+9x9/eufhT2/v/3Lv7iF69wnXHd/h9+S1Rn/cl1p0e791ycVd
8RWez7X4ZOnp3/TmAOTyrX9chzeqv7z+XvOgH66dcNsoD2P63XsS3QPkCXFM
XXaZVzznue0F2O76O7/7T7/6CQfO3Jjp3Rtrv3/24LeH5a29/m8OyIe1siKe
wusqfAJDXebQvORirzjnuc+5GK1/9k9/9+vtw//vR++/i4JiIWvw7PqP3z14
VH324OhY3BLk94njTsSiFMee0BzGycJll33F5/0edXj7t7+6ff/OzbXDd2/d
vfMBf6YgCDfJhze6t7eh/bsQIzVMpjPcHg3KdJNb37V3G2J4ycV/y1nY3vnP
gNv/4Gd//6O9n13/w8F7R2t/d6d3//GGvNAPFDOpDr97D2I6jf59cq8itrbo
cen0Btlm+3ssq9IrG7w0nnstLnJ4929r1N9ev3va/uXNT5s77w0+3Hj80We/
ps8VzIb3xvWfErWj449L/uB+q/f4cNB6ItG0eCwAA67ol12Pt5OLFSIQkxtr
7//n33/2MzJ79OkBvr6++fRO98Of1+/8bGtNcM8VzPH6Tnn3s+bTx7cZpr3X
OeF2RLR0Um6y1FDF2MFqRP/Ked5yRsTOzU/XfrXx3qNHP17T/NqTD1q/aSvQ
g8beO/eeHpbubDLnCgJh89E99ahM9x8MGOg6KfE61u2wY4TX4JlojKxLrs5b
xudeC77//i/++Uc/en/0yW9+eeP2jYfYtN7Yo9a7vdrOB/DvRx218fCpfq5g
QTfv3A965Ye3P0FQFJbUOl7HOtt8g2zLVGkUMJdcpbeI5yOGmN04fPrPf/3z
2zd3nx4QR2vXaxsb18lQJO+sDymk/ocPT07v/3aA3qH9809ltc5+gtw6Wr+F
w0PuMYPv9tpQTYYc1yJdXMnky63V28Jz27PH+9c/fPfHN6h3f7vxdK1046Rz
ssOWn/2q48YH948f3Kn5H37U2rq99xi9ubMmndkgyDziZIR013e2+MQZHdfr
AyTZKR9MwpZWjkmOVS63Zm8DRXG+ylAEzP5tuf737944+PAOe/3+R09cbm8H
Kp+ghwdHehHu7J+e1tZ6zyp766U6endTQOLzjyWQUK4eGP1bx3ssjdss4TXa
ZOCPhpBgTuuH3mVX7w2nuFgi8omd/X/6j3//Lgh+9+uPR3efVj5+d+tTOhwP
dKO6dau0255PupTwaKf30frHa81DqF7aGzeXI/rosIH2h6a49XNoiFK8V2kz
1VbKHuATQgAdkZxcchXfAnyx9sGv/8P/efrTX/xicxKt/X6jcX8bvf/swUfl
/XFLeLLWO715cKACXe41Tm68v79f6yJsGx4Ouvx5KzqZ7ZziKpDqv6xTyEQx
o974GNLhI9VGpiHHosll1+/N5ML2Mlvp3Hpv++n/9au196q/u/6r90HWunX/
+B8PatfVD2vj+tpGvfrswY07rS10xg7WzM3t9b0nx9vtk3u7/T2CXioocn3C
V7rta0aK42O07BDcfUHs9ltHuCey7MoGXzjP19ZnHidZWdp7d2f9P/5k6/Yv
fv3bT7pz/8O1yvYDiDxBjo7H1u2a1Hi0cbfXVLJgR64om9dLg/s7JRi59X71
uImfXamYMP22qrD+sHHzqaHDtGDDHSTViWkNsmujBoxfbm3fNC7Um7oaSzMQ
pZui8PE7W/v//oMbv9nZefDx+iQr3xc2fna/V9vGG/sorrBHJw/3En0rDB0P
7t+4BxEntf0e+qTTvFZ1zxXMsFKr3dNNs1YnUcbwGhQy5m20octUYzY7lVZ7
1V4cS/kmjsTwkpXMzqzQ05mda3vVn9xd+6vDT96/dqMIe7+AyY9brU/gYP0Q
NLH6s9Y7d8WDrUkCMxsf/+GT/nC3TG63yy4D1cTzVjQHAi0AG8XqexB1XQ8J
CYHIKdNCFKKZGZq2mtl+UZw97flCPU4N5ssXLlrTiN7+8Gfv/Jfqtd2/OQHm
jY8847cQvUl1mwfN0yby4OmzZyePTTDpHjTqPTpEduriDtV6Igh2dn6VlH56
OkAg8Wh8fxtuDAMtYui4TLDhsMGMKr4lXVaF3zAWas1sjpGX6j0fRBQX/9Lf
/U/v7j5t/c2N3N+5hXP39+MD7GF7UPHFEL2NQ3ZbnaQEukM803ra4eChxnYh
qCUm51ewj10WPyGDTqvShPSucErTNKK0eGUsdyjJouFLrPUbxUxl5HPH/rnp
fU4xB9Q/33i/9pOdh435rLY3Inaekds3WycuvbUttSoKW8ZazETa2cW6h/c3
Go37W25dhrkxs7RrneE4SG/iXvUkyXTKlLrNHVziBuL4xNVwajWz/QIocmDS
1vkMytf9tnC2b394/+cfX3/vEUj29nulnZoJbVcr5Wf3GX17t9KptGE/7t2t
YdA/b947HqikdDhs1bzzixVAakGMguqz+AFR6cq+uzsY7jS0KIQ9cjqS2ZWC
P4iLGTPgGeDr5Tt7y/x0vTY+efbTT97fLqyjnSmxU3MIEi2dGhWVru/td8s+
4U0ejritrXZ9OKL29nH0oP4UufCMXKBhqpE3y6FIPDwRRZiBTVzyUMmeeAdl
pf7qavtmUXzeWuYTn+X+tPH8gn779w10Q6hev36Q29tY52S7S48qe3yr+bEi
QuakR5pdcXj34dN6aTio1++0epuYPED75/OiYD4JWdRhjpucJZYbKEqpVGXz
WFYNHsQ2euqt5mS+N19oN4scWaFZRlbkb7LAxeulPnVveOeX1YVgu0VwrTNQ
u4rCtyqN9tbxcPczaLvdGEHurfXDMvagvf2odeDzjzENc7r68kYzDlMnUDvw
5sS7/C7G1uzRViV4CpMUV4QBslpd+j58Lt5CO4lnaFHxwtnZ/yMxBV/jxCxk
zR7+2hB+j4mPVdJ81AX2Vr1tssjoRvlWY6s6orqb1XI4OP5U3bg7uPNM4A/Q
rtikNMMZ0lG6vIYPOKHN2vh9Bd49qZlYS21wwkEDI2SPHKcF+cpq/5rzXLx8
4mrsmXZuOv/SryJW9L78tudMlad7ePdJg8Er9YYIZZ3NWzv9x3j79naFrPIn
GlenjcZ4vIU9vt8v95H9e3V6eAqP9rYEk02fX4LE54bPH7pOpemHXaRl2ihz
EkMI6GGKMX5lj+D15XPxFo0mzbLL+ZaLX3yhVyDQnDX78uvFYogxFkfvd55t
lqryzv7R6cC4/VHtqHmfPm60Io7ZYFij3GoeNzY+c496mNu/UesPtL3NjRZH
YdKWvFzhDYYUz1eQENasKY+o22NaPIF5kiQxJ6j2EPbVPozXjc/FC3WJZng5
+DrtnpOHKkMLxnN9F6IyFrCvPa7jzfLx4Sm5czCe3yS0hnIf52tiv9b/SG7J
ZbJ+0q5/qGbHuw/2pDbtN6tbzRFxUB9sLdcmMgkbqLsQTcCiGkGyfFDuE124
m5QsZTtlRWu1Rv+NfNnyaM7wp89f/gaf5fzlaagu29hsCiL5bIUWfjTAtjun
z6rrFLEBpAOkCSPQ6aPq3jbFtY9cXajWd/FPtPRma/+hwaSNZnNw1HLpXbFl
LHc68YsxIKbgh4jOGCe9ubkwwrlmDlh80HbjxJi+kofx2vHFGgNDcl+yvD/3
seWPMz9HJBn2XO54baf+SZ0bwz9/utuYgdppi+h38c31FoYJKNZvPm41ubu9
0ClBrAUf6E/He8dsvzPsNaH4/JJZD4VJBUV4xzESokoPTUoeksecLPb1cRPV
VqOJP+FCp+drDF958bt/fGG8rn3+c5cXnj3mYXt90MfnMXat1m1t+N0TYdjD
7SpHox8cjEtNa7rTP+rdfWpv1dCmU6HdRm9NO/9GJIw4HEAcIz1icL0l2JAm
GyjdGHUSNl50iJzxIuv++vMl9f5kjeH7XWfxqUKl9TSuvX/MHV/bb2ewPlLn
OVw78sq7oy2y0kqSY1yUBsf45qNbZNbjSLhRFRs3eyTZfdyocHvUuYKzscQJ
WsbiGiTPGMofKpgq8IiCB2rc7ehc8AKr/7rzxfrec/W+sc/7jszUxbjhnWel
DXxvg62ektv5XK0dhK0Bt3l7/6EAnNEpRGrDB0cdJ2Ae7m/XSsw6yqsWc1JH
+ra6bJVNFXCQwMNcaM3oTzjs6YCvDuosb0JIglmD9AfX+w1hOYP1FfVeyDWz
1t2T3k/ao12RPOoJc/fo6FGrJKKn3NpAImsjRccaT3rHZJGdPMP2mSjcq1Dd
Ye0UZ0ra0kcp4mF1a9ENIoOePkm7UtLtIdZTqOJYAZ7HsrTqB89YbkvSGFp+
YepdXHhxoQS59U83htfave1aJZ/SMLpdamCNQXcgY5sn/MHh6fG1B+sQQMaq
ykmUOmYtrjwIJcG9sK5ZoaL9PlEHhK1rBy7fGowxzAIZj3qa4Dir0cRyK0Oo
0oz19et7P5AcgLD9wbWPhx8/+WCrSPk1lmv21M4JfXzCNBlqiOxs78Icn5Wa
WyIC4dvP6OpOe2DRqhMuv1m6AkTJHhk8j01iBiHi1vGRmDFA8sLZiLDf9r1q
5/J9MZ3ygtX7/B5J/d1qU4KPZkVnu0Vf2/ZKSvO4SR73h2tHN26ha/tzh5OO
KE2dmM0e1B6WenhJvRgPSg3EYTRxFsb5ZNrr4Bxaa3bYvsoOJl1uprzV+2TO
9VrI93xK86XdaGGHSulWHVkD0TFDtm7d8vsHd4f6zrA22X8co+gmlkyQMWPq
aaRpJ+h4EEKayCytq4ifqQyi2cpoDQ86jNlioNhmcBFnx0BAIx19aaW+8pz7
GRolLY8IvTz5zlloSNz45B4w7wpUv9+xh09RfFA/HqjXazYFCYxpbsszaTQY
sF3sUSvo1ThRX37DCh8TRjzvBuapO7PbmtzYH/mUQju6wrgSJb7Nuw1nNk87
Z43nS1bvnMVXZFK+D7xr1QNbImm6US4/29mQ4T0ChivGjlmMRhan0TKN1im4
6rhm4zBYfq1Mb667NZnGTM+AeC0YU2OqEnCKrbOFVdO7r6DwV4+zJxMqjHy2
n+9lW9+Xb6rKdz6tlCSCOLy/LXf32o+hwcZg/9AYHwQRjjS748pxazgYksxY
oOXW0ggLYIkFfCLZqCoXwI6g0nDqji3DGyp6obBM5RUV/ypx9lx8lrOKVyjf
OTlI1p+JUIlN7h4e4Mrmw6MSc/10bXcDwoQcqe3bra4ajyr0IwQbkkTrfDRR
JI0xrFPyAGd5PxsIHkYMDJG6R9ge7fmIouWvsgZXhZnNCcvNmK+YxQ3Rm88W
wzv2ZA86QnaIQXX9dpM83K+rM2TQ51u6N6RM1DzCdjEOX44H56jB4wNLgmTD
8lVPrPXq8kmPizWuC1JZs195JS6b4nxnZ/aqze85OcBuMc3u6W/Hh+9BRmm3
0xnvUEi5Ic7tocwORX18j+UGFlVhcNlafsUmSiA/g3LSHPLTSZSwMAF1e64x
UG3H5Ybk2zei95jz5vOybr9waDZ+53Y3Kp2dtf6794ebpdun949FP0NhaQjL
cdThjk4JiqW42F+WUqMRn2HZ6aAEZgrs9DchanwgKgzHRH5PD9+q9cHirP+T
LlO/ZSF2byaDG+/3P31wb7M0GAnqXuNAd9siPa5pNCmhmyI7KGmIf/F2WRBd
d0zCRBxOMca2Wx3koDI1J/47jFgC4ezP3O/NYiYK6eXqd0YBkFJz+6T/6Me/
Lwul0nE9HfS5CdZdoxpDXj6ixHKzuo/yxnJOBlB6YoisW1KEyQSvub7bP8Xe
nfkJvy6aaEC+VTZo0sHl6wfOOsPyHw7gO89uH7A9un50UtsYyHO2Wt44gkyP
7oyZcZWejKcXqw5K4HOGrbcUHWQ0Z1JPULLxZOjqGgtcO7femqhcCw9GMq6E
fuDcsDbuXXv/xma9iz96BI+2ORt0H3nbHABNAOuY8lCY4su1iQKMTEXr4nbA
Dd0J6wXDes86Rru8ptkGsEYWe8l1eVUUIGSu0Gp2DpQnN97/yRAdjT7shenJ
ojPDH2pDFfPkKdOExQrqk3G8fK+u2mKdIxUz8YCqOt6zmpnWXTczOH+SOcZb
cn6wAOb5xrErQw7av/qnf6gcMFqp24/voiFAGnv1HUyPxMFGWz/sqrRjnxc4
6nqK2YAGw4EcBakycTBX8FnXJRRzYoxl7+2IL7oQ8Mq0oEvySe2z37zX7ijy
7d0R0tvUJ+3+8BiXWP9ppMIUforxF93gPPCDOYaYpnRXC1VD7mLtZrXHKCGp
Jo4jJ/7lVuTVsBDwikWjLkB3BN38h+sbtVFzs/XZJuokTAWln4wVt8/3tikK
J6nne5iiCp90nSw3AzV1LaGQng4ImjJM2bR8MYrfhn0y5wJeJQMEZ+HQqzsH
lTs7lX12p0ttEc6ceXqIlqgR02Er/bpYj2BsvlxdClRZxMNcTCR+GrtT77A1
hxbGa8V42hoS9FvgixbAvmoCFsVBD7qLlncbjTtP20OLGBnZMdltMwOuB2v7
HCTu0hJ10cOFbkbt1sKxOhZsHMdLw4bQZXGBCkmBVWz1bRgPZvZVExCIBw0V
7/yhelK5e9g5obRT1b8O5V5fARPLhJs4bnCMdbFddTZ2WiOdbkvAjZXIPtVm
CqeWCdVKYSCTBnfJlXkF5EZ+tQQEeb650zWk3ccPlNavcBXfH7czo9krsTzP
MIhNNbSxzyLixbyoDKx2zRODPqPOEGmW001KhVhVIMUkKWFO87Jr8/KJrt6O
SpcKaied69tHsHrwaaOPHw/c5MSIY1GkRwQuSdz2abtHY2d7M8BUD7unrKWR
ogrNXMPsQiS16AVP2QqRzL2JzF52ZV46c/eyS/DHFNlIwSrb/KBNI+Xa0Tt3
T5kNKN8fjnoYSe1BpDE7RXoj+CJK87SPOHyJUiNLiGaTNEMlzdZsYQhHCQaY
qvzmj+hn2WWX4I84i5w90bgq0UiqIx4f776/vrsXBr2HO1T3UEGaHWxSY8lT
tblsO2Y+zpOIrEe6EQaRl/l7SomqoYob+BO7UcHFS67Oy8e/Yp1gAeIngS2c
jrooVHmqal737mH7QyonWeS0PLJOTaTa6XMQJsLOxQqvriqGAcxqRFmJaxg2
c2rB9ETEFDQzJOeNn5PJZ1dOwepGMD5KDJSORBIaiQPk3t6aFJb6IyKQEhUi
hn0Mgvtwe3kKG7iJYYqHXd8wY51jDUBRfUiaRByiyOhQT9/YWPfFxUHpPLrs
knyVAuillsU9qFX7alZnOROGouG1rhdsInv3KUkQh5uH91tQeSgJz5v/WLMB
K6kcaw7HopeyArToCqmErYts3dbetFm14qsn3GcZP//mN18GxbxTOBJZM/pl
k9C6THfftPvln0tRk+gMmhVmSI33IFYKaA2+GE1EIO0bTOTPx8BPuUhSEFan
cMHI9HReOPYbEk+m+Kpys1nsmgvXnOOwxtUaDBaArfraVki1QeDyXM3BlG4H
VZ/yFWQkIloNhVlRc0pYzsPl8/a/KIwaw6uS4ASEPPU31CRWUCnhmDhWp0NT
UpzLrtIP46vC5bPY82SF4ThGEm03nc3P5qSu0oRMAaIaM5fFbq83dEdlrEcf
I9SY08fwRq/13kmilxtiM2af2rix9rz5T12R7Qyz6aDNpwhwa7pB6K5npCSv
615kXqHafR/+yOQmixqJIsmRkqR54Wz+pfdlwdVSsLIoZgi6cmgozbu4641l
k584uP7pdutYPC1TpNHq1/rjYZ+yl3t5E1iuoaqx6Pm4KBGV2LBc8lin2yNG
B0C3X7tj9F9VbnphcgQpn5ncV971eYjdKyUg3eO6Y8Eedlrz2FCGGl6njinY
oaKdj4/ZQX/cx1mY4u09gxCNizP94Ri3XcN2iuEUgJ6EhAzboIWeHvWEjO4k
9iXX6bvyFaN7rhzDy39scn968n1yhSbvi/yzkzw2lfigWXHI5oCz+4cKi2Hx
UIvvtS0cf0YN+dbjroCwRsc6P31WABs50eqkhk4KKy9seWrzIwIEvN0LUsAI
syt/fvDLmuTTs2CCf6pc8XXKPWd6dYYTC6/k0zskZegaMZRgaAdXA5zi5zN6
loOEOsVoyRqpMHJSUnqkqfLL9n9GWXSYccPJWBbnIHadCQmNcX8eDBZDRYxJ
r+z5wa8a3blruejnzoMJzr/2Pd+If3XOhoRBfwRBkaMUE8yHMWyYhX3DMl3F
MFK5dQA99R1qMMo3xoTK1aDwvHIpabmyDowAUtWpEXk1g8122ilIo35Bwxxz
9RIvfVmW50ZHL13Lr3vLn2dydZYHRZC0JLGYMQqFEBHHQYpyuz3VCE5PUlKC
1QHjgBaJE7p6eNxnl3HV5rNht6JYguGI3oRpi0gXNXSaiKkxrYDA8q7QaOIr
7eXEc6WvN7rvf2H3aiwvFYDoFHbDsQnJ13VDNcZtlQD1dq6FdFzkE+LoenVg
uArUFcR6ZQAJ5/OiRdIbcMyxLDqTKNXMp4E7GlBTWha5CFCzxZjySlTuS8Is
nJSzcQHLLnq67F9odH9yeeMq2GAB/I393KowCstWcrvPowHPmJEGR67eYUHm
J8bR01RlWz0EqzVlBibN8zqHpIPDJLroPgNUtKOUR1xOrVEdVuP1WQqMy93p
9OUG88zqeIbhpT9uL3/4bTLtCrSjRVFt9IsQ902OH+XsmGKBGKgRWoEkpNEM
w9hhsqMno2ZvKKCmOUHS8fL0WeK6nfmgNSOoEpnKsAmKTmge0ikIOU7uacJl
RSP5al8nXVhd+gPby28itC5dwhw0t/on+WxEI2ippWrJoYygdZRgT3aruW4X
k5bFiHhlqyIatK7AzGB2sTI9F6UyYbuECPX4DOMUC2VGFIGQqNxGzRLtv/K9
al9uMWPXkOizvs79vMH8Ye3lN93z8rcbFsDowV0ETMY+sFtkwXukzM77Kj8Q
D2DRzZyclwfzWWW92u0TOKc2B9SpuDy7xHU6d8O+Y1GqMe3VJbEpBPXeyDJn
CsuEM/wVjui/0Obc7HjmzMMMpn/665fBJW/5LXLnCZGJi6aAGbBKn4kEKR1x
se64ogh3hkILBi4j2rxyu98aJ31EUPeHzLkRFkCrNndMTxuL5tTA2xHT1oyc
pSjKsoDiENgrWeH9knYT77nZfTnQ+Eu3j+W2+8ujAAzCa6A2AykNuR9RrshI
AamxZuxy9LBh0CZQF79LQW9A1Tu99q5soN7FVISDiC0ZL9VcxctobWLGrBlS
GJNN/DzpesJLbkX/WDuWlb4wu1ch3ecFudSjLwWgK5QhImIRt4+BjsopX7d6
lKEJM0XuSHuNQQrauE1lc/DuOtvsdU7Mcbe1HE0UrDyfC5zDBrYWzOiU1OjU
H9t2FGignylY/NIKfVW0e37Lhe82vSQJCxB/tjmC2SOrACkjEY5oSoJSIsMy
gVYou91vsEXGUnhX8/PSgyMV03BfkZHlPpkp21ZZIyUSS5BnnOcjIMljhSsj
2rzIVBp7GVvx/ox2L+GO36lUYMJfzgnCAiRPDxFw62GpBNLYSXkIjjVfArkq
YYFr8J1ItfIp0+ZVWpas0l75kBaOh5vmMufLjIO40VyuczDC+1U2t13gG3GH
3bMUiahVrBc7ov9cn+Iqafe8AAvH3LiMljSf737ingwrmDAGhSvKXSru9BxM
TXjL9EFKtAXencyME7RhU8h4WpeZjepJvcxefNoVxxjft80KJkUeGuuyGjp+
zTcUGRCe0FNfVDG/ktCGo5irpN0XmOyrn4TKQXsNIpswr+mzPBctgqdSTcl9
JACkbiWuzYwMIc0SH9O8UVGpCw5NNR410dvLSAjzluuNMZ2KWBONBgstp2rW
k/goZ4RE5ooXcWziS43m5wlt/vhXV4RFS8q96qOgRaFvrXWF9dAZs2IRYHiH
bClRo8RgXDFlEU7K5F6JNqdB7Pi0KwkIfdxFuXK7dfNs130B7LWkQQq9Ki7k
M6BMEi2ei7nUwlIHdlI1sn7Y4tmXDe9PEtr8wJq/FIqLgBav8o7RXvMxIwhR
YKVunpkSNGXYCBvY9RwAy5OiPJGkTgxIbu4e4AvHRWTrt+v2HqlF5x939qF+
1zBh0QqyeSIEhuxyeRx0xak0cjx38i9em/hcoqmni+zC8L41oc3VoXi1QWUW
zucRpN3BHMkZnlDUFMTyyLYdhj3CghzgVhaxslFvk1Yq+dgJCdltZhKk+4ZM
iRcnQIEt6+ackIhsPPRI1aIHYbqohN0YuOQkjuB/ya77z/MEn7WaFCfZ/vyr
v7jSnAd20sEr0jCf7G4QBCxJtEvZc2ReRPRowomBLnNUMDcmTu5VOaSjWfMy
2vDGZMzH2tC/ThgItM2eF3HSlW3EkdlEn2rpExEsrM9wFNjBbIHSGlb+Pdcm
vpTD7dxdsZL5V15/XVimzX0VZXar6/0WquOoL2NqXADOcHIe1YYTrD0LBSzK
064myF4xi1gn5DoJihG8u/tIHfTLyx2/k5bleWyzXRvbWkgY2WIkSVAeXjlS
DV3nRtx3zz/4VfFo1Uu/+vrrxFmAw1eiYcHJtdunLoHXxAQXVX42l8aCY5Mm
lWWuRk9CX6cU3qWNIpRkAELZtx1qZsRHOzVzazlWjyjGtuQk0We+4OJDU+Dn
vmhJncoYdjSbJ79blObnIr0B4i0pwCvRsJBd+/07ntAd2ubCsfSl+YwdD2Jv
DOTyRCBnU0Xu6YICmmqSjqYwLqQTPkTZMlFUHtIH56OxIqzwQMAlP1fHIEIM
DzFE+6BCdRnKzSJG7/7Z+d7nKk3P+jxWe/3Fu+AVaFgUcgiAXCX1xiPNinHf
jOa5eRvGKMpjq2IBvMSwraGlSQPBAZ5YHwDg9DDaC9G5jpX3hPNnbHkEE+jD
gSQ5AZD7HEQ0kDQkZI2NADnJvj1S+ufpEzXhPA3Y69nnfRMvX0MvXDysuCRm
5CPe9SglEYup1GC0QDAolF00nohLFabmwF7fnOBCPDbRicHpeDAnRp1e42yn
UwHa6JCisKGkewsrnslWZSoDXwhIneKnfdXAv2lt4nN38yJ94psl3gXnGl7E
S38Jl5965xI0JxojeUk6ONpYfF0wiQXJXKIwXTZ9sg3yQMIY88jJIF0lGM0H
tg4TogAdjT8582SKokHMU5/leZYbu6lpZyQFZYamQBTrJ5I8B1+3y+J5uxmq
zKLTCz7PLfsSKnnZFMug2zF48RoWxXSZCYHj+Cqf7Mm3dmVzPmvZKMZwFsIr
gjUtlIDLJMeQeu5MohFhmk6ADUux4kqYsiacPXTnYIDThjlMPF6ZjaEsPtSQ
AGfkIemqQHTjSP/j2y7jCE0ciTtLKfv81RdcuyvEWdV8ln4Zge+D89Nj8cHB
qIZbQBUnEQyiHlljYrndVnVS0YlR0KI4wUeOLCCXUD0SUUZiENSYTYECS2eF
S0sKGrqBOzc1l5cMzTBDQsoLvCd2MUAzqfml8eDnvd7S9P7l6RNfM86XcBTq
hUa/X1wnYL3zLtaoVtQ2JWt6N1W7hWVM0UDNJno6EvW9yC6mSdTr4JgMy/O5
TUapqkm+qjmxyz5mz54+1pYiT7Mln+1SUjwaTjiKtEOXJ++JY2iauV7v4o4X
52QWowWSvTC9N7Pd/FoWFc197kUmgPFZIXbObRDQGkfieJMhCcUH+47hmFXJ
53TaEzb8TCbJthTKzbTveBON5GAnEVDU1Mha1u6BfNGLQqnCSg4zYIgqAw8m
UxvJVWyijhsK47nuRK1+od5Z9sTno4W3R7wLzmc/tMW3HPzgyp9P251Z9Fkc
lAKQpBaSGr05BbxNTzdsV9cg13Gnc0QTPX0qUjJCjxphE6F8jCYxKFIUwWCx
6VxGQZ5Pn35IxrHXJzXZDGha4l23S0rCyKkdIvI8CwWIOi/tD847+6bgs4z0
g1P5TM71K8DcObtOp+9O+6Jm1gROsotNNMXjcVDusHnoU/N4yhgzaToRJbqb
xFqkHhm2zwFTm/KybOSgyEdVeSIOBqrrmnMcNxqzLLYVUdZLJ2nCTHJOmr7Q
vLOvOec9os3T5g8RcaayyUVbHPogn5QMRvFg3pJFrQmi4yNVlRTfD+HUiDzT
ywnXqCtA9DuoNspA4EdDijQX/qWdBt6kADEKjzGzPeaNjjGpPXX6hm4DAGGa
zUhYQjtcBAj2xeWdfQM4ewiZxiwTSv5LHsl5QpKLwTTQA2C5pcEhJaC45Jh4
PR6OxXqPCIge2ielTAhccxIXEsXGfayODmLvSJSmtplNZrwJsghkbnUAD1HR
CvcoNiB2eLlPeXwfH8sgYaaaodA5tkx9uVLvc84fRaSSgv29RVw0nJL05Q8U
spe31kWpKovzcbevkpFOjfFE8DSc9eeyzk+YmHaB1ilpVCejIM6sjSf2JNMc
N4w14EyzSftYrzWi1IJ4akzvB8g4iBlOdhu2YE0MBzkN1JV6f8qyCVyIaKSf
//c7fSzi/iihRcFZjhGxsjI1GYaL/DlFQZaFoHZdUTiSnkwMWHamRsQBhIzN
iJ1yrmfaPj4JjalsTRUP9K9zzb7um6yJzR1aqVmZZHYdxZIUdxjIZUiEXnTt
3xAuRGQp83ukVzbFP9mRmmeuSLCFQvC6Zjpaofs422OhgPAoVSA4LkBNwg0j
Oz1yFF9yBYFH5GnGUnE6XYzVsxhg1wgqMIY9ty6LbPiga3Qxf2R6yqzd8IDR
tUrMi676m8O5FmcpzqXvJmKhft0mKl/qKNqJNrFib1Iv5XbFltJZLJM8waBO
mx8NPFRFFFRojAkko7t9KcMKup8asYovLpYVlZalyz00gGHRGCjjxSjT84rM
mIFxV6cmCkpdoSwaV5DlllubJZ+nyv5mFYtc/ppTREXhnTJpSHm6FkxSJQBz
3nbAQkF/MJxII9sadGOHM+1J3uy3GQ6yA46EMcsJJeE8lEWQ7/92ZHADi54p
ncDTVDxg4ZRlPOCKA6uRGjb8FkRp/mEsw+v92XT1C78z/LoOswDIyPHXifjA
sX2JmAFqlKRUmIA0J0MDV1mYyxJD8qdji9bks/2DiqgFpgzog7PrTbKd93qS
5YtS6LkW0EnBs7u6kFiSAzA59hULvF25z/5lFM/b028zRdv/Wo+nAOG2Ihs+
u0E3JFUstPsqyZl9S+As1ZZQ2tHyKZcA0UxwS2+BXHAKh6aFWDbis6xmc/3R
9sNGwKC2HRdc5CiLIYYlsIQIgCs7c5cfoCsb/G6cq3Nmit8wfE6/MWDGXFCi
gTnQLB86qgOHUBDRi2OWRyYM1UpjD0xcGTBh1Ju6SsMOJr5rSXk0jEQjP1sk
uvEZLfvNZDiYak1BdWdFJkq9QUeLzB7H6wHOsS+34m8SxfMJyM+X3b5QsXC+
OWiNG9vlyiEiZv1WPZ+XosDCBDfxIYsP+dxMOcb1XJDnCDZnpc5YY9PA4EqW
du6h5MVnNw46MtTXTGWiQTplmTwS5ZHDycwx13ctq3N1Ah69FiwlC1XmSys4
Z39P4m8eNcZITzmFlOl4XVJmGUM6dd7XPdFiBKD6c6FKmuMZKOJnpyrit48R
VrPBzPUDcbllm/xnalCXudaBlfcbjuUbE4VisMDRfVof+cnMeQtyvrxgiucN
6pdV9L7FSS269H6SYQ7Cjg7yxNKAtCFPzZmpe57haLwFxZNAzSeaJeou2rYB
GukTUSf15RL/bKOHDEWhN5AywpIkO2CiMSv2Bl7EpkYU++PLimXxevM1Kn4L
E7PbyiH80wFq5IkgJYFJA9fz4R7LsQrMpJIiKXGRDIO5exrQ0nTGeXLuA804
32bTKqUu3Jl5qsqPZIVICcubpolrWgGiLSy1NXz51X1D+UJFimOMb5t6m6K0
zNe77x40+7MpByWcQRQRrPG6NswBS+uMrlte5si449sNAUNGqoUEiaUuYxtm
GzAIG75gMbi50bAidSh5fsJJbh9ODC1PVr7oD+FCxSnPfYuCBYAgaiif9oed
ZwsnsyF6DOObmOw7uq2EAwTzGE7AARBty7fh2nS8jSVOagUXQRmjY4XRYN6v
CQKbpUHqOCbjYXLiNzTZqC3s99VU9Q3mz8+2AcOREfuQrH6y0Eka9/gaI0kh
hLqUOIzsxUiTAVwWkCjrciE1tTVxohgxbhfn7m0x5U7rJaVKDnSyh/eM2JoZ
Xi7LvFVQgmgqb3y6iVfEt6YMKJI+jn8Gs4MWD3Kz0HskXpCoyQKDspwBAjQ7
skIwS3oy78MzIiGMucJMhWVw4mIub9cH8HGvbfApT0K6hzjW4mUrD8SSLTDE
FYpt+DqTfdsZsAL0artbPTgaL8bj0tgAB6KmVpUkWgxLdLWtnQIrB6miQUk5
MSPPZgQni1VRXg4xs+j0AWSNq5B+jE0ZIQ/SzM+y2HDxvujq6cmqH3whzI1v
CUNbAAFz4PG6RQ9mgK/HQRufRxYNu0YY5740AwZk5gXgbamfAYNRQzrS5PSL
dFF8hfZ0nJcq7lQyI0SpsFZu6iFDM9PYIHuvoHpvA9+apbKIW+9t8qebzepk
rll6JqMzfArRghxSkwAt8Ym60F9J7LlJu5w5l1GfEgFIllGaiyLDhoJsC2IH
N1Fjoiu4F6YeSociNbHJ9M3PnPVKKL5pZnv526K9U8b7oy114Zec5HIzzKzw
CKOIs1BTeLepOWdbHYkBnIJ0unBLMdzR4iR/nmchSCi5b2CK2ybvSEYtBEIQ
ZUzkiZibW+xqi8WLoQD6NwcZLKZPd8e8OF1X8liojZV1NdNCJ/Q0YSz0RImh
mzqY64baI72pIHKL3i0DJMsuz9FPsjS7eYBmU16dzCaWI/WQIAJOAYK+JNm0
c4VC+b/eFPnXLtGfkYPNuyeQDHXv6SDsHnpenbAZxPSC4tAacbptGDoznyY+
hLQ3VMvybKnkTJJRc+mMzl2b6T/OdVlGeVpRU0LGMSfi9ufmwq11DAp5tfV8
o/mabTJn5IA8Od25Mbh78qlQRL0dMDmacuN4gsgubviSsM2H3gTMrcg+7bWT
CWlMGBFjZ8LkYqjnE1KyQ4Y5Re0yVuQBL2UtK+cCzsp5TNEvN+zmG8XZVjX7
T82wAEmvuXljNzgZ1ul8RlDAO01pOvCG4wj4poij9NyGz+Zfolqd5DygVINY
9FTSv5grSCQZnF531dKNIxDYtl6zS8rZ6x48sGcFs5qTeXEUYK6KfxyqZqHr
Pv5BW1zv7N3eHoCpfmo5Ap7yvCZLRZjq/X5plMtmFjuJYGKEryE2lWiGQonc
0gbnwSyw54bU6pedzLIGbqbyMCUIfojZ+Uj6boEQVnxnfFb6yrHuHPibJPfo
SDyCT+lmaz6zsapYsjPBCnhK51OeYzdgUMjFNHPdKc1oxhjJMEtjXCtezotO
/MBPCrpteATLm2Iw7Emmog4FVmRVkHj+C4uMt+ICjznbTLOcEVv8sT+4oymP
e60NGa6pg2lKPE7ojgrhsCMyAfAMTvOVeWGf7dxIZ5pqmJIiToAoBdjzNBmJ
GU8AdlKmmFg3D9n1QIlIC8wNLzBNQ/CuWIbM158CzDRKSsHyUGLICXCDkfdw
+bejdvsAyeeWALQRYfOEEYJYEjOv2TgdKF4+USd8EPQoSo5Zi+kMTEdcThIU
WYRbk6DZfxzMTE32MxAbTGzgsN7xZ1MztC67xm8kPiuepUMySU5zWg8G7V6d
7PO8wmk5UDkF3qBiRxFGsnWQ6oLGI/HCM0mqpui3no5MSNSlGKsa5MxbnsNR
i9xJQLvT8zw3sOwgnPPVliKEBCFlOqyuOsIXz9lzDwTG1PWzw9h/eLR3sN0b
DVsIcSTPcmRkIV3XN328Uk0ZK+EdUgh83QemYkXEIOkJ0sgWmoLNuPFFd6rq
8xAoW+22FzuWiaraSEq4VAbeolWdNq989rrXlpkunY3zAQTDMgR1pc36Hibk
Ec+6lul7soo5FsBl2316KPb5OjNNp1xqBqLMGYHLU6GMOJNlZ1oIqBcVs/aD
Dt+UVQkECyFduo8aqTAj/cFLi5T+trN4+rFxtl3Q/exw+KRUftbBSjs88IcQ
QvdQvB81VWDvsPaUqwwpl4tAaMjzWEBNhdEDj6Ns3nu+/0221aLwOzeHZF/Q
ClLidXdOedPUh1yNWzkyL48CmGejQ1AdbP8WgivDJxW0AuYOdkI/pP2GW7OV
dhcpH6UBLKZOtBis86n87AYmqK04syhhZi2ta+LhiB4WgNoX52Pd9HVYF3v5
lGcdvhymWXR1siu+iUSsaDbfweXtj2WFfKcM7wMQmnb4VAvmE1wS/SRSWYkx
CDacgFmm9gSM8xYuqDMFhWn7SwWLfJKw+mQS7+53bYpTx1GKY4AfKvMJAEos
r9YmXiJnjgx141f7nd3rtZ6zc3jSKUCfHai1RgwpkhINIj9FhWLeJNs+mCdT
zjJtjE8sNaWNyNbZ81Y0oZgozmNRQMaIlExd3G9lsmHai9eC6YBY7ZN5uRSg
IG8dnd5oPikt3JABN4vg9SpC9pUyM2yy4dQoVBI9phQpP0uSKB7jzV6r14Yl
mBi7Z8u+iwt4nSzMmMDu2QdDqcz7XFQh1MynXaZqTjhKXe26f+mkyP2/bUL3
6e1tYjcHox7M4GrUfdJDtGiMpnnCQuwxlKdoFutWVJHGzMT3fYzQ9AsnJY1j
aZQxA5SBOzUvJ4y+yi26WBczRYdXVq3oS2fxhLn7H26+g/bqx4NJxhza4XBk
YIQs4L7jUYHBkyw/XXiukK5AbpsQDNKzI02Nk2UDmYUz2ptlDgjHkDWZS1WT
N6a2x2I8CwPvRHgZWXtWfJWFhoNfvEPf/PDOcZ4c7u47e4yFPDagGUjtJJRK
mzPXnc/IukAA2cgyXddNUVOeT4sWE9tThUBFSF4dyaHq85yOM6M4HYT8JDAT
/nIr93ZQFCA7ur/eXPsUxPSz8ZjpYBRxgs/TKRV5IsNx/KSYK4zK6E7QYfQm
rtmkmXyediVkjHkB8S4w0MdUxIw0tLknKF3XrYf+XFvtdHolLJwS4fZaZbNI
1z7hEmLf4cgWAgJRFhx16qhmlGf8rKvDreBgWAsG5kSF/M4yxsF87liWGahy
ODE/alUYxtW8AZGEhmbXpoaFr/aLviIKkJR//GtgfUSjW/cJpcz6vCNyZorA
wFapGGQqpBMYYQ0PTE6gmRyDneXaxMR0qNgZC3xFcx7dKDESk6YVch76NJiH
mL1am3hlLNSQ1lLzVyet6tPBwpcsQbzfgSNBFCimk8ZAa9s9J5q1uj49tmse
h5AXvmiWqXMPt4W6b5od3BzABKyqYlMbG4YnKw5+udV6q1g0pfRn14+f8XjX
rFUSIfF42qR0B5LGg+mEZx9LhjuRdIWXOBFJLGLZihYSS85MAiI8Pw5qp8YY
YzK6xsk5qwJK9bJVPJlXyMKj4bfXm7sVga9uCB1UIkVrZgDHOXXn84lS52V9
pkO8bVRHXspfeDKZ2NPnU40xyGnijWoOVfIVRpGn1NwOq3YQrE6+vFIKUJze
wVvthRSwOaoNZRvW6MRzaW8aOyZvzT12o6Spvbara8XFyYnEYY2Jl4z4Lqu0
BTebwoqp+NJAquylkq+sdhu+Wha9of3sx3R356gBj0zZnuPkuA0RwzRLgiTz
LC0bdeyRavtBW9WXq0vJrAMDlCZIewq8Npj6ztRVOtIYq6fEYoD4PTNnrfjB
5GBe2m48fHTQVTyr5yrIrt0cse5ctLrm2RZuZ0eu5qorSRfdIFBblpfpx07I
TSx/T4gJFRFkgq96UaSeUskqEsIrZ2FYxo1fVOpYlRmjyNGg04PhvghCiY1I
ypOpKkOwiqmjjYstv0GfwxwHD3RyMi0ghj3kBlTZ0IBLQSoalF59WtoVCzOM
2x9/9AyprunySDM4CtHsFONTlUqAZDtil6Ud06g+Pw01jXoJHVgmoyd+VxlG
is4nwJr4sgosW1qtTVwGC2XE3z0ct/eRbo8ctBB7KARY3JmNfY1iJYRXbZHR
JG/5VrmPT4BuF2nkGyhuMMS+JDWJjilCUwq27W8+MrXiZVKAyfaPfts+MvRO
hzOPBLUYNCrMLqdp9wgRKdH9Nm3kSxOMQ6Z3FkENG6uxbmhQR9R5URuwIm0j
g1hdzYteEgt1iHulhu6QDTYqITOgdqUyzadOiDvGqFSjyOyifZwPmXAxnl+M
PlzLiYQ9UglSaqS6RKTnNqeXL7cebzMFSB9vDB/aMHzSJ0Jf82G3R/MzVT9u
BE1rjhgX/aCux5oNK1SPj8CcTdr9HkeTvEpyY8urcCh7ydV4m1mMK+jd38nw
uEJzUSo1EW3kaMah1B3YvV0aXR7OLQDsitKQUXWBDDOacq1TymGcmOvrbjAX
yvHKk7lc7Hc+6z1DFuPCrNs1BHkkdRp+p4p7JTzVlmv0oRDo7v5AzE0qzQ3R
Gm/2Ufg6aTkmHes9z1nt+L1UcjCpXL/HkU+l5MRIganpnBdRcMXphkppuRO0
mDSmeRW1KXeAe5nleG0mk0p12TWN2TSOkFV0ysvlbM3p2qdbH3DTzZ22ypMn
R4kVBdBwSozVi8DdGR7R1XwqTydCqkts7FGIbCneTIZsMPFT9pJrsCIH3uOb
N9no8V6vRJ2IY37cLyoy92S8MzpbjwJzE5iPahGBarKUEJgXd/sm0e1giZI6
KqknymVXYMXC0Go/Jq1PTGbdYVx+XN/SOzLTZmrqco0+5PTThharrgflnjx3
DI1iFJNCAl9qCiK3On12+RQFGPYeNKDTWjzsj/BOt7yBaYQIm8tW1CeCrqCl
vuibkTeN0UQ9rrv8DmqzStQno5UvehXIQXTvd+uPyw/2St3MzLyHrM2xzwOr
TTOUDDkxUhRb8pPMHrOb436z0mINfz4KyNX5wStBDvLBx1iT6rf6AubSvYaF
95SLHHhpnqOuKJqZYZu2mQJVr/aHJpBpk3bGXWbli14NzibZ1jbbMkucMvTj
8BGvHZHpMiqXJVYYmXFS3MyKjLbTqXrkZQI9t1vDUXkcfGto0xWvkBzoN/6h
ITo9Eh+Jg26n1lbP1wczooANESclF9XzaTzzC8Bg2Yi0g2kcziRytcJ7ZShA
una/PbJhDHDquD9siuex7n14BNd1WZRHtg0ikKtB4kAxCw8GqANMjl9Fxrs6
LCyu8/u91kldAFHt2Zw4zwYM7P7ogBursaEA2yatqOYaM73OJ7YkAbvXzVfZ
Cq4SOVDWyzDSbg+RTbZzvme7KBCiJGWqq1R2q9KB6fM6ZEzGEIwpkJNwHM1e
dqFXfJkc+KXf7e4TRwSObItLBand9k6IDEmxP9F3PCW1cCY+phRa5joGRqar
fTJXixzM66d7EH/r4S1oGdJpxmw6zQFUch2X4mUbSJqVg0q3HieC7ok4t4ov
esVYqMYe1AbbR+M2fe7JBOUpKfnVhsV2+BmFB2ISgFig+pqZAR94vdWe7StH
DtJbezMCesSfKVj4t8Y7uERu1V1PnHlOyiQg0+17qK56gLCQtdWe7atHUYSV
aw9aT87nRYv0WDaJ+JTENCua81GgOzMXOENUjdhIpOf7q+iUV5P+w6f3lrnP
hM3yFF2M+2SfZb0Gl07tucMBcrsxFCWFYYjVvOhVpCiA2P05vWhQC3AXk02T
H47bhlFMJNSifMIwZuPr7ZMBaGhDfmWDV5MCmH9og3kO6j8pE5pPjPyeICfA
8+2NiJknJo2N2mIspdbhamb7ilIAF1l0g8mDn1YklW3X+95kf6gTcSa4WGLk
OLU9LoeK4+mrE6BXlQJMmSiU93/35Lh7WIvRB5IjSOLC84xVYIV67ye1UaZ7
TufRZRd0xTdRgJlEg9t/d/hhw5Rst7GH0KQNMZOZJ7EqrNT5oQQbfX61Rn+l
sb37v9sq8639puHQBKdXDVuhE5y24LRSFgR5CJexyy7jim+hyLVfvv9Rha/2
0aYq2RNgxTktpSJIQAxtsKYz6m+tfNErTQHUDz49OoWf3XikBRzG1tSAEXyv
SDkneqYFvIpgq3nRq00B4o93EajKIrRa0VqwC0JBs3MMEr0SQ7oRv7cKMHrF
KcD8+N393v01mB+qtBRlDhIHeeHJLEEbhomP2Msu4Yo/w0LC01v9skilhu7B
rZQeowEo5lIMlTZkDN5nLruAK/4sBej/v6cJQUsdpzWyJYkK52AuxFZtPCaZ
0aoffA0oAPRgYYS7mEsGjtxWYcP24dTv2ZgaIKt+8HUgB9q7W3wHsdyaQxIO
E9GKyyZ9Bdi+sYoQ+1qQA/X+vV2RggcCkhYeBPEJKQ6PDV1A65ddthXfiQKE
H15jNuqYTKlMZE1oeWhkm5Tj4auzS68JOcg2PumXg3CP34mSdEhMdVb3miKx
StvzulAA0Li3n2VjaAzjpAnhWPc0ZlqD1frga0ORF/f+fpeulwX76QnHcHvT
kcVInf5ll2vFd6YowOGHIkZAmUmhRAuCnDod8sRlF2vF9yAHtSZfPWITvXtU
kyti5RN3lcz8/2/fjloShqIAjn//l3zI1yIhqBiEQWaoqbPm1WVkm7klrLnN
zWYOY/QQ5s7Jr7Dbw2Fwfp/g/3K5l8O5xZJhcHTRexrbqbvzHtK1YkcmdRPL
BXBabk27913XdIMkHoxWfeoklg/grG0kYixWizANJ9Yn34NFk2FYaUTBUBcw
T432aEAdxPLK0K862pvffJ7H1rUZUvew3AC353VbN16cL/PS16lzWH4ZbmqK
CJyP4Y9VaVLXMAmA31elM235Gi5V/kdfSIBYOxDYj5zjHnULkwLwq9x2vMQr
qdQpTM7+FNYbsTELeCZTVADwGL+rdxZ1CJMGoJ4uJhp1BpMGsG2d2B3qDCYP
cFc95E2nIts/Z27K1BHsPwBQ/AGvy59N
"], {{0, 225}, {450, 0}}, {0, 255},
ColorFunction->GrayLevel],
BoxForm`ImageTag[
"Byte", ColorSpace -> "Grayscale", Interleaving -> None, Magnification -> Automatic],
Selectable->False],
(ExpressionUUID -> "8ef0f7fd-b9a9-4ecf-bdf5-5aef5c484f96"),
DefaultBaseStyle->"ImageGraphics",
ImageSize->Automatic,
ImageSizeRaw->{450, 225},
PlotRange->{{0, 450}, {0, 225}}]\), {{2, 1}, {4, 0}}],
{Point[{Dynamic[\[Alpha]], Subscript[x, 0]}], Red, Line[{{Dynamic[\[Alpha]], 0}, {Dynamic[\[Alpha]], 1}}]}},
ImageSize -> 450,
Axes -> True,
AxesLabel -> {"\[Alpha]", "x"}
]}
],
{{\[Alpha], 3.7}, 2, 4},
{{Subscript[x, 0], 0.2}, 0.0001, 1},
{{n, 60}, 1, 200, 1}
]](https://www.wolframcloud.com/obj/resourcesystem/images/cf5/cf51482f-bd01-4b17-9f74-1a37759a62b1/0c9e70cb2a954608.png) |
| Out[4]= | 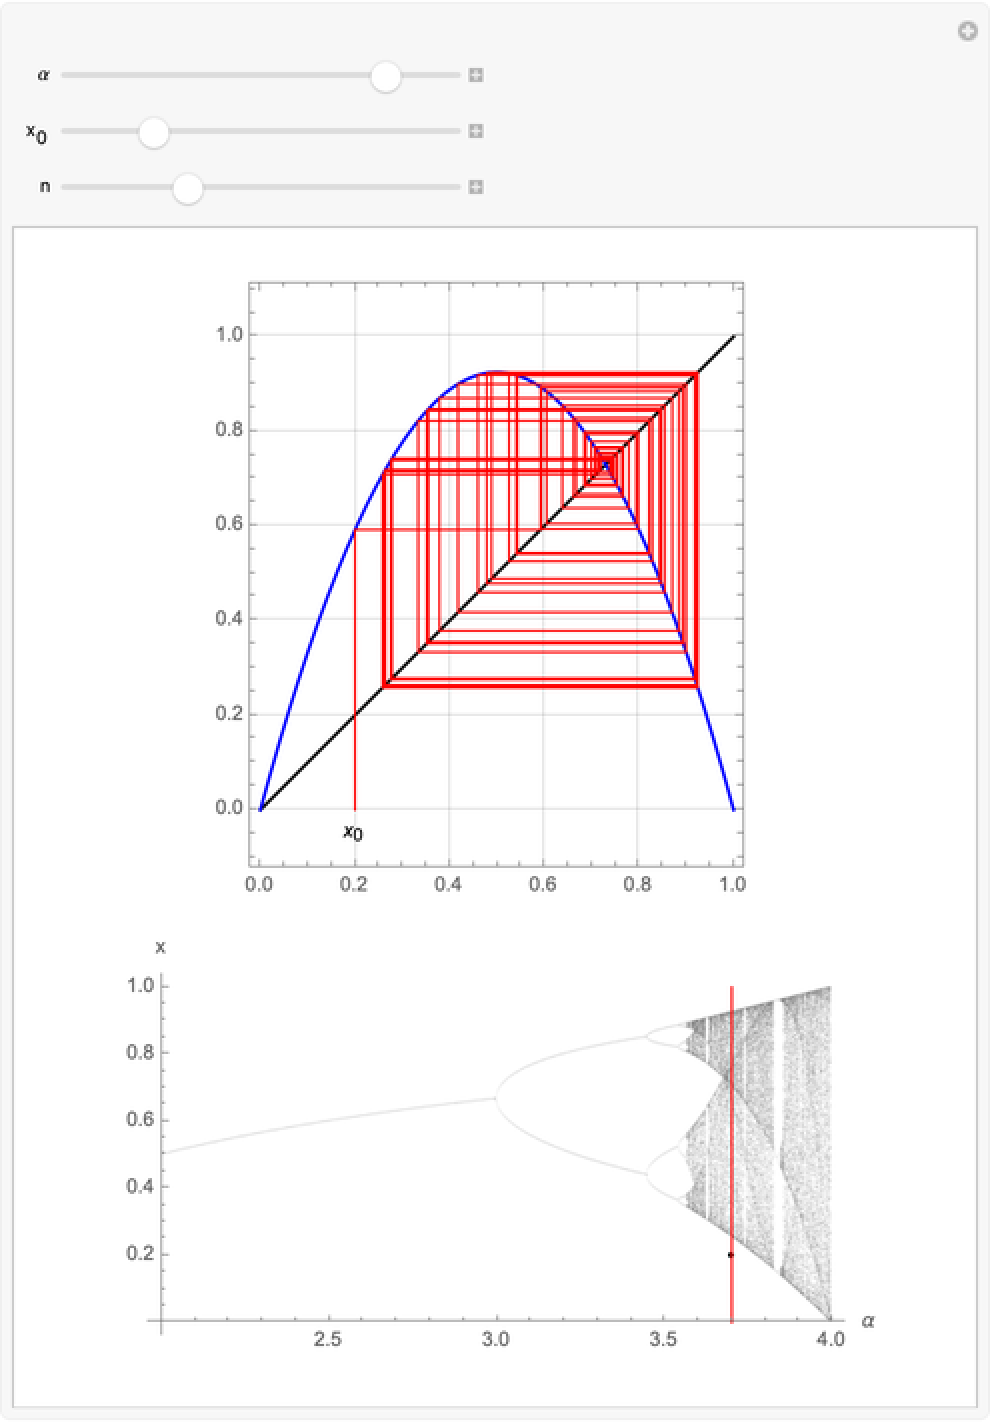 |
For integer values the map ![]() corresponds to the (reduced) Collatz (or 3X+1) function: if x is even, return x/2, but if x is odd, return (3x+1)/2. For small starting integers n, the Collatz map iterates to the cycle 1↔2 and the cobweb plot converges to the yellow square:
corresponds to the (reduced) Collatz (or 3X+1) function: if x is even, return x/2, but if x is odd, return (3x+1)/2. For small starting integers n, the Collatz map iterates to the cycle 1↔2 and the cobweb plot converges to the yellow square:
| In[5]:= | ![Manipulate[
ResourceFunction["CobwebPlot"][
x |-> x/2 + (x/2 + 1/4) (1 - Cos[\[Pi] x]), n, m, {0, 20}, Frame -> True, Axes -> True, Epilog -> {Text[n, {n, -1/2}], Yellow, Opacity[0.5], Rectangle[{1, 1}]}], {{n, 7}, 1, 20, 1},
{{m, 5}, 1, 20, 1}]](https://www.wolframcloud.com/obj/resourcesystem/images/cf5/cf51482f-bd01-4b17-9f74-1a37759a62b1/67c92adfc878fa29.png) |
| Out[5]= | 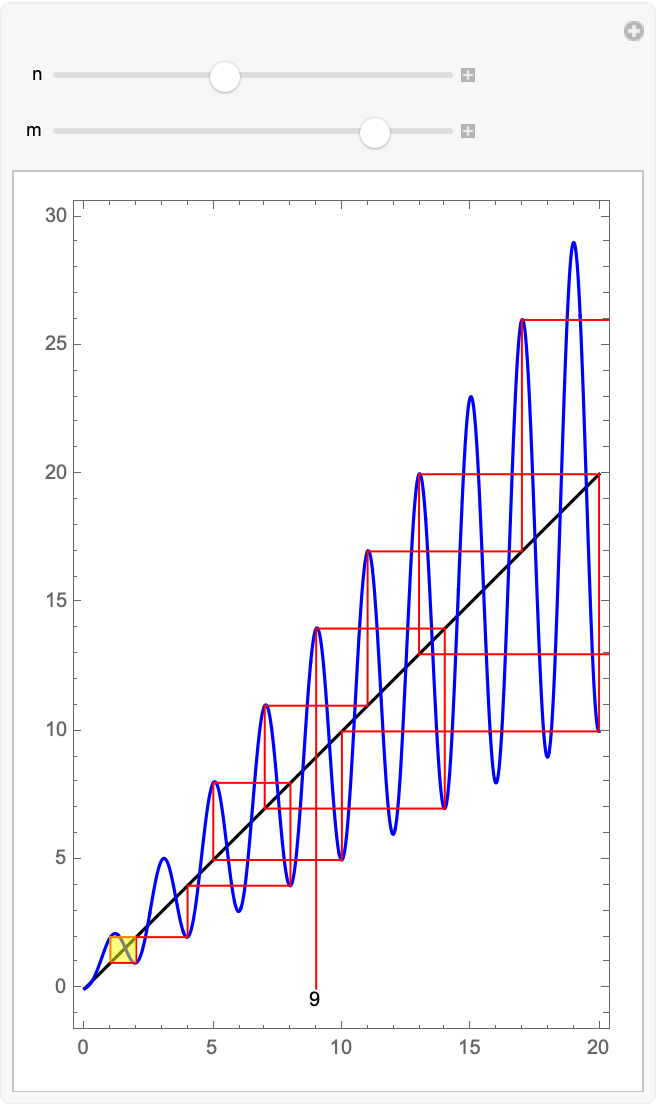 |
This work is licensed under a Creative Commons Attribution 4.0 International License